Transcription
Point & Figure AnalysisA Disciplined Approach to Investing inthe Stock MarketThe Company fundamentals looks great. All the analysts love it.So why is the stock going down?Copyright 2015 Dorsey, Wright & Associates, LLC.
Fundamental Analysis vs. Technical AnalysisWhat is Fundamental Analysis?1. What to Buy2. Company Management3. Earnings Quality4. Price/Earnings Ratio5. Product AcceptanceWhat is Technical Analysis?1.2.3.4.5.Copyright 2015 Dorsey, Wright & Associates, LLC. When to BuyTrend AnalysisRelative StrengthMomentumWhen to Sell
Long-Term InvestingSource: twitter account @ThinkingIPCopyright 2015 Dorsey, Wright & Associates, LLC.
Copyright 2015 Dorsey, Wright & Associates, LLC.
Basic Laws of Economics We all understand the basicforces of supply and demand. The same forces that affectprices in the supermarket alsoaffect prices in the stockmarket. Stocks, sectors, and assetclasses move in and out offavor just like produce in thesupermarket.Copyright 2015 Dorsey, Wright & Associates, LLC.
ORIGINAL POINT & FIGURE CHART4544434241 4140 40 40 4039 39 39 39 393838 38 3837373635403938373642414039 3938 3837 37364544444343 43 434242 42 42 42 4241 41 41 41 41 41 41 4140 40 40 40 4040 4039 39 39 39393838545352515049484847 47 4746 46 464545 4544 44 44 4443 43 43 4342 42 42 424141Copyright 2015 Dorsey, Wright & Associates, LLC. 535251504948475958575655545352515150 50 5049 49 4948 48585756555464646463 63 63 63 6362 62 62 62 6261 6161605958575655
CVS Corporation (CVS)Point & Figure Basics X’s Price is rising O’s Price is falling Alternate columns of X’s and O’s Minimum of 3 X’s or O’s in acolumn Time First action in month usenumber (1 for January, etc.) Use daily high & low for chartingprice actionCopyright 2015 Dorsey, Wright & Associates, LLC.
Measuring Supply & DemandDouble TopDouble BottomOne column of X‘s exceedsa previous column of X‘s.One column of O‘s exceedsa previous column of X33OXOX33X32OXOX32X31O31X30X30OCopyright 2015 Dorsey, Wright & Associates, LLC. XOO
Chart Source: www.dorseywright.comCopyright 2015 Dorsey, Wright & Associates, LLC.
Citigroup (C)Did the fundamental analystslearn from the 2000-2002Technology Bubble?The following is a quote from theFebruary 9th New York Timesarticle, “Why Analysts Keep TellingInvestors to Buy”“At the top of the market, theyurged investors to buy or hold ontostocks about 95 percent of thetime. When stocks stumbled, theystayed optimistic. Even inNovember, when credit froze, theeconomy stalled and financialmarkets tumbled to their lowestlevels in a decade, analysts as agroup rarely said sell. “The example above is presented for illustrative purposes onlyand does not represent a past buy or sell recommendationCopyright 2015 Dorsey, Wright & Associates, LLC. Chart Source: www.dorseywright.com
The example above is presented for illustrative purposes only and does not represent a past buy or sell recommendationChart Source: www.dorseywright.comCopyright 2015 Dorsey, Wright & Associates, LLC.
The example above is presented for illustrative purposes onlyChartandSource:does www.dorseywright.comnot represent a past buy or sell recommendationCopyright 2015 Dorsey, Wright & Associates, LLC.
NYSE Bullish Percent X’s Offense –WealthAccumulation O’s Defense –Wealth Preservation Two Lines ofDemarcation: 30%and 70% Measures Risk inthe Market Does not have tomove in tandemwith the S&P 500 orthe Dow Jones.Copyright 2015 Dorsey, Wright & Associates, LLC. Chart Source: www.dorseywright.com
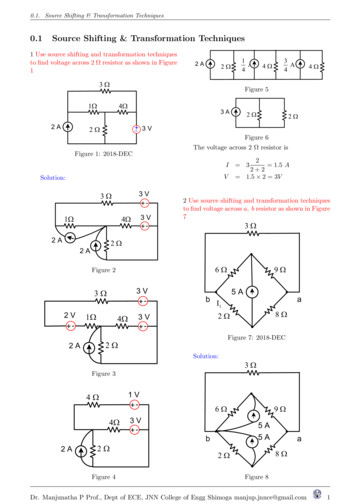
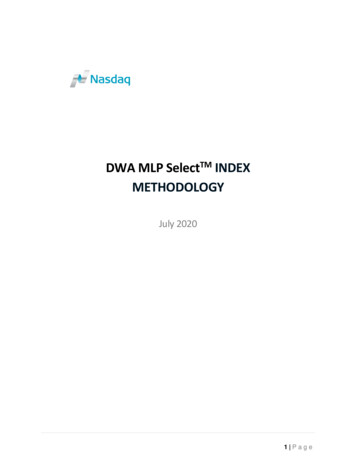
Relative Strength Calculation All major sports have a ranking system. ThePoint & Figure Relative Strength tool is theranking system we use for Stocks, ETF’s. Daily Calculation:StockIndexX 100 Relative StrengthReading This reading is plotted on a Point & Figurechart which then tells us whether we canexpect that stock or ETF to outperform orunderperform the base index.Copyright 2015 Dorsey, Wright & Associates, LLC.
S&P 500 Index (SPX)vs.Barclays Aggregate Bond Index (AGG)When RS Chart is on a buy signal, itsuggests outperformance by the numerator(i.e. ll- /09Sell- 22.62%- 0.69%6/5/0912/31/14Buy119.01%10.04%Buy and hold SPX:55.70%Buy and Hold AGG:37.07%Switching:228.62%RS Signal: Buy Outperformance of SPX to BondsSell Underperformance of SPX to BondsThe performance numbers above are pure price returns, based onthe applicable index not inclusive of dividends, fees, or otherexpenses. Past performance not indicative of future results.Potential for profits accompanied by possibility of loss*Performance of the switching strategy is the result of back-testing. Back-tested performanceresults have certain limitations. Such results do not represent the impact of material economicand market factors might have on an investment advisor’s decision making process if the advisorwere actually managing client money. Back-testing performance also differs from actualperformance because it is achieved through retroactive application of a model investmentmethodology designed with the benefit of hindsight.This example is presented for illustrative purposes only, and doesnot represent a past or present recommendation.Copyright 2015 Dorsey, Wright & Associates, LLC.
Performance Differential Among AssetClasses: 1990 – 01120122013The differential numbers above are based on the price returns of the applicable noninvestable index. Indexes do not include fees or transaction costs. Potential for profits isaccompanied by possibility of loss. Past performance is not indicative of future results.Copyright 2015 Dorsey, Wright & Associates, LLC. 2014
Why Relative Strength?Source: What Works On Wall Street, 4th editionBased on data compiled by James O’Shaughnessy and published in, “What Works on Wall Street”.Study period encompassed market data from 1926 to 2009, and the chart above shows that stockswith better 6-mo. momentum (i.e. good relative strength) generally continued to outperformed boththe broad equity market, and weaker performance buckets.The relative strength strategy is NOT a guarantee. There may be times where all investments and strategies are unfavorable and depreciate in value. Relative Strength is a measureof price momentum based on historical price activity. Relative Strength is not predictive and there is no assurance that forecasts based on relative strength can be relied upon.Copyright 2015 Dorsey, Wright & Associates, LLC.
Relative Strength ResearchHigh momentum (aka high relative strength) stocks have been provento outperform Value, Blend, and Growth strategies over time.The performance numbers are pure price returns, based on the applicable non-investable index. Indexes do not include fees or other transaction costs. Pastperformance not indicative of future results. Potential for profits accompanied by possibility of lossThe relative strength strategy is NOT a guarantee. There may be times where all investments and strategies are unfavorable and depreciate in value. Relative Strength is a measureof price momentum based on historical price activity. Relative Strength is not predictive and there is no assurance that forecasts based on relative strength can be relied upon.18Copyright 2015 Dorsey, Wright & Associates, LLC.
A Time for RS StrategiesSource: http://www.arrowfunds.com/files/DDF/Arrow Insights RS Turns.pdfCopyright 2015 Dorsey, Wright & Associates, LLC.
Magazine CoversAugust – December 2011Copyright 2015 Dorsey, Wright & Associates, LLC.
Big Picture Concepts: What is “Trend Following”?Lesson:Four “trends” can bebetter than one.What Does “Trend Adaptation” Look Like?Source: Arrow Funds : www.arrowfunds.comTrack & Field400 meter World RecordMichael Johnson43.18 seconds4x100 meter World RecordTeam Jamaica36.84 secondsSource: Arrow Funds : www.arrowfunds.comCopyright 2015 Dorsey, Wright & Associates, LLC.
Dynamic Asset Level Investing (D.A.L.I.)The Dynamic Asset Level Investing(DALI) evaluates the supply and demandforces of asset classes, and ranks themfrom strongest to weakest based on theirrelative strength score.Step One:Create InventoryStep Two:US EquitiesCommoditiesRelative Strength AnalysisInt’l EquitiesStep Three:FixedIncomeRank Each Asset ClassOptionalForeignCurrenciesCash(Step Four)Check RS vs. Cash & TrendCopyright 2015 Dorsey, Wright & Associates, LLC.
Current D.A.L.I. ProcessDetermine Allocation to eachAsset Class through RelativeStrength AnalysisCopyright 2015 Dorsey, Wright & Associates, LLC.
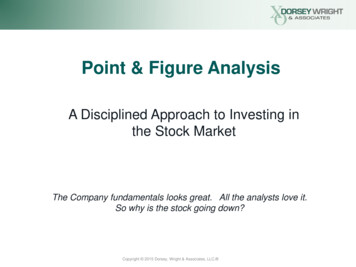
Sector Differentials120.00%100.00%Average Differentialbetween the Best &Worst Performing MacroSector is 43.65%80.00%60.00%40.00%20.00%0.00%All Performance numbers are based on the performance of non-investable indexes. Investors cannot invest directly in an index. Indexes have no fees.Examples presented on this slide are for illustrative purposes only and do not represent past or present recommendations. Past performance notindicative of future results. Potential for profits accompanied by possibility of loss .Copyright 2015 Dorsey, Wright & Associates, LLC.
Sector ImpactAll Performance numbers are based on the backtested performance of non-investable indexes. Investors cannot invest directly in an index. Indexes have no fees.Examples presented on this slide are for illustrative purposes only and do not represent past or present recommendations. Past performance not indicative offuture results. Potential for profits accompanied by possibility of loss. Please see the final slide for important information regarding hypothetical backtestedreturns.Copyright 2015 Dorsey, Wright & Associates, LLC.
Reaching Your DestinationXInt’lCashCommoditiesFixed IncomeEquityCopyright 2015 Dorsey, Wright & Associates, LLC.
Copyright 2015 Dorsey, Wright & Associates, LLC. The information contained herein has been prepared without regard to any particular investor’s investment objectives, financial situation, and needs. Accordingly,investors should not act on any recommendation (express or implied) or information in this material without obtaining specific advice from their financial advisors andshould not rely on information herein as the primary basis for their investment decisions. Information contained herein is based on data obtained from recognizedstatistical services, issuer reports or communications, or other sources believed to be reliable (“information providers”). However, such information has not been verifiedby Dorsey, Wright & Associates, LLC (DWA) or the information provider and DWA and the information providers make no representations or warranties or take anyresponsibility as to the accuracy or completeness of any recommendation or information contained herein. DWA and the information provider accept no liability to therecipient whatsoever whether in contract, in tort, for negligence, or otherwise for any direct, indirect, consequential, or special loss of any kind arising out of the use of thisdocument or its contents or of the recipient relying on any such recommendation or information (except insofar as any statutory liability cannot be excluded). Anystatements nonfactual in nature constitute only current opinions, which are subject to change without notice. Neither the information nor any opinion expressed shallconstitute an offer to sell or a solicitation or an offer to buy any securities, commodities or exchange traded products. This document does not purport to be completedescription of the securities or commodities, markets or developments to which reference is made.Unless otherwise stated, performance numbers are based on pure price returns, not inclusive of dividends, fees, or other expenses. Past performance is not indicative offuture results. Potential for profits is accompanied by possibility of loss. You should consider this strategy’s investment objectives, risks, charges and expenses beforeinvesting. The examples and information presented do not take into consideration commissions, tax implications, or other transaction costs.The material has been prepared or is distributed solely for information purposes and is not a solicitation or an offer to buy any security or instrument or to participate inany trading strategy.Some performance information presented is the result of back-tested performance. Back-tested performance is hypothetical (it does not reflect trading in actual accounts)and is provided for informational purposes to illustrate the effects of the Dorsey Wright strategy during a specific period. The relative strength strategy is NOT aguarantee. There may be times where all investments and strategies are unfavorable and depreciate in value. Relative Strength is a measure of price momentum based onhistorical price activity. Relative Strength is not predictive and there is no assurance that forecasts based on relative strength can be relied upon.Back-tested performance results have certain limitations. Such results do not represent the impact of material economic and market factors might have on an investmentadvisor’s decision making process if the advisor were actually managing client money. Back-testing performance also differs from actual performance because it isachieved through retroactive application of a model investment methodology designed with the benefit of hindsight. Dorsey, Wright & Associates believes the data usedin the testing to be from credible, reliable sources, however; Dorsey, Wright & Associates makes no representation or warranties of any kind as to the accuracy of suchdata. All available data representing the full platform of investment options is used for testing purposes.Copyright 2015 Dorsey, Wright & Associates, LLC.
Point & Figure Relative Strength tool is the ranking system we use for Stocks, ETF's. Daily Calculation: Stock X 100 Relative Strength Index Reading This reading is plotted on a Point & Figure chart which then tells us whether we can expect that stock or ETF to outperform or underperform the base index. Relative Strength Calculation