Transcription
The Travelers Companies, Inc.Together or Apart. Still Right Here.2020 Annual Report
Financial Highlights 2.7 Billion Core Income 11.3% Core Return on Equity 29.7 Billion Record Net Written Premiums 1.5 Billion Capital Returned to ShareholdersAt and for the year ended December 31. Dollar amounts in millions, except per share amounts.20202019201820172016Earned Premiums 29,044 28,272 27,059 25,683 24,534Total Revenues 31,981 31,581 30,282 28,902 27,625Core Income 2,686 2,537 2,430 2,043 2,967Net Income 2,697 2,622 2,523 2,056 3,014Net Income Per Diluted Share 10.52 9.92 7.33 10.28Total Investments 84,423 77,884 72,278 72,502 70,488Total Assets 116,764 110,122 104,233 103,483 100,245Shareholders’ Equity 29,201 25,943 22,894 23,731 23,221Return On Equity10.0%10.5%11.0%8.7%12.5%Core Return On Equity11.3%10.9%10.7%9.0%13.3%Book Value Per Share 115.68 101.55 86.84 87.46 83.05Dividends Per Share 2.83 2.623.373.239.283.03The Travelers Companies, Inc. (NYSE: TRV) is a leading provider of property casualty insurance for auto, home and business.A component of the Dow Jones Industrial Average, Travelers has approximately 30,000 employees and generated revenues ofapproximately 32 billion in 2020. For more information, visit Travelers.com.
OurOurabilityabilitytotogenerategeneratea significanta significantprofitprofitin ewhilealsoalsoinvestinginvestingin strengthof ofourourfranchisefranchiseandandthethevaluevalueof s.AlanAlanD. SchnitzerD. SchnitzerChairmanChairmanand Chiefand wFellowShareholdersShareholdersAt thisAt thistimetimelastlastyear,year,the theworldworldwaswasin ainstatea stateof crisis.of ruptionlay ahead.lay ahead.facedfacedin 2020:in 2020:a globala globalpandemic,pandemic,a recorda recordhighhighnumbernumberof catastropheof engeschallengesfromfromthe ntly,importantly,we deliveredwe ingcontinuingto toinvestinvestin thein lescaleandandresourcesresourcesto pursueto agenda.agenda.OneOneyearyearlater,later,the theworldworldis indeedis indeedchanged.changed.We Wemournmournthe o theto thepandemic.pandemic.We Wemissmissthe theabilityabilityto gatherto gatherandandthe thefeelingfeelingof connectionof connectionthatthatno virtualno virtualIn short,In rcumstances,we performedwe performedplatformplatformhas hasbeenbeenableableto replicate.to replicate.AndAndyet,yet,in thein 02020resultsresultsreflectreflectthe theimportanceimportanceyear,year,we havewe havealsoalsowitnessedwitnessedthe thetremendoustremendousgenerosity,generosity,of ourof ture,the thebenefitbenefitof ourof iliencyof soofmanyso manyin ourin cs,the thededicationdedicationof ourof dworkforce,workforce,andandthe thefranchisefranchisevaluevaluewe bringwe bringto toWhileWhileno oneno ndanddistributiondistributionpartners.partners.All that,All ,out,as I aswroteI wroteto youto youlast lastyear,year,I wasI dstrongstrongtracktrackrecordrecordof ofconfidentconfidentthatthatwe werewe werewellwellpositionedpositionedto weatherto weatherthe theexecution,execution,givesgivesme meconfidenceconfidencethatthatwe arewe tas weas havewe haveweatheredweatheredso manyso manyothers.others.Today,Today,to capitalizeon opportunitieson opportunitiesin 2021in 2021andandbeyondbeyondas theas theI amI ampleasedpleasedto reportto reportthatthatnot notonlyonlyhavehavewe weatheredwe weatheredthe the to capitalizestorm,storm,we arewe arestrongerstrongerby nearlyby nearlyeveryeverymeasuremeasureandandremainremain economyeconomyrecovers.recovers.on theon thecoursecoursewe setwe setlonglongbeforebeforethe thepandemicpandemichit. hit.In 2020,In 2020,we grewwe grewnet netwrittenwrittenpremiumspremiumsto atorecorda record 29.7 29.7billionbillionWithWiththat,that,let melet meturnturnto howto howwe performedwe performedin 2020.in 2020.andanddelivereddeliverednet netincomeincomeof 2.7of 2.7billion,billion,generatinggeneratinga corea core*returnreturnon equityon equityof 11.3%,of 11.3%,OurOur20202020ResultsResultsall*upall fromup fromthe thepriorprioryear.year.We underlyingunderwritingunderwritingincome,income,a aTravelersTravelersgeneratedgenerated 2.7 2.7billionbillionof coreof coreincome,income,an increasean increasemeasuremeasureof ourof ourcorecorebusinessbusinessstrength.strength.of 6%of 6%overoverthe thepriorprioryear,year,andand 10.48 10.48of coreof coreincomeincomeper perdiluteddilutedshare,share,an increasean increaseof 9%.of 9%.CoreCorereturnreturnon equityon equitywaswasTheseTheseresultsresultsstandstandon theiron theirownownas excellent,as excellent,but buttheythey11.3%,11.3%,a meaningfula meaningfulspreadspreadoveroverthe the10-year10-yearTreasuryTreasuryandandare areparticularlyparticularlystrongstrongin thein thecontextcontextof theof theextremelyextremelyourourcostcostof equity.of ratingoperatingenvironmentenvironmentthe theindustryindustry*See*“AdditionalSee “AdditionalInformation”Information”for afordiscussiona discussionand calculationand calculationof non-GAAPof non-GAAPfinancialfinancialmeasures.measures.11
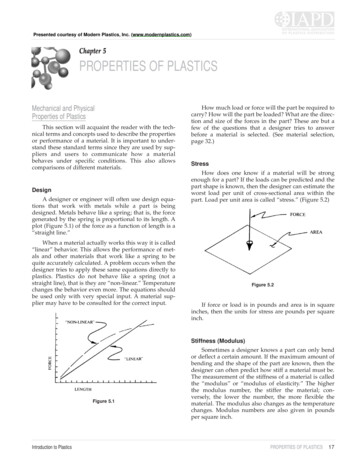
Underlying Underwriting Income1( in billions, after- tax) 2.0 2.0 1.6 1.3 1.2 1.4 1.4 1.5 1.3 1.4 1.2 0.9 0.8 0.5 0.4 0.0201120122013Underlying Underwriting Income12201420152017201822019220202Underlying Underwriting Income Contribution to Core IncomeExcludes the impact of catastrophes and prior year reserve development.ipsumprimisThe results for 2018, 2019 and 2020 reflect lower tax rates associatedVestibulumwith the Tax Cutsanteand JobsAct of 2017.Our earnings and strong balance sheet enabled us to growbook value per share by 14% and adjusted book valueper share by 7%, after continuing to make importantinvestments in our business and returning more than 1.5 billion of excess capital to our shareholders throughdividends and share repurchases. Notably, this year markedthe 15th consecutive year in which we increased ourdividend. Our ability to generate a significant profit in thecurrent environment, while also investing in our businessand returning substantial capital to our shareholders,speaks to the strength of our franchise and the value of ourcompetitive advantages.This year, we saw once again the power of our underwritingexcellence and the successful execution of our strategyto create attractive top-line opportunities and to improveproductivity and efficiency. We generated record underlyingunderwriting income of 2.0 billion after-tax, driven byrecord earned premiums of 29.0 billion and a very strongunderlying combined ratio of 90.7%. Importantly, asillustrated by the chart above, the contribution ofunderlying underwriting income to core income wasthe highest in more than a decade, an indication of thehigh quality of our earnings. In other words, when youadjust for the things over which we have less control,such as the substantial number of catastrophes, prioryear reserve development and the low interest rateenvironment, we delivered operating performance thatfar exceeds that of prior years. An important contributorto our record underlying underwriting income thisyear was our continued strategic focus on improvingproductivity and efficiency. Our strategy to grow the topline at attractive returns and improve productivity and22016in faucibus orci luctus etefficiency is particularly important in the current lowinterest rate environment.Underwriting ExcellenceOne critical component of our ability to deliver exceptionalreturns over time is our granular approach to underwriting.In our commercial businesses, that means execution,including the allocation of capital, on an account-byaccount or class-by-class basis. In personal lines, thatmeans a very high degree of account segmentation and theallocation of capital by product and geography. With thatand our advanced data and analytics, we select the risks wewrite and price our products deliberately with our targetedreturn in mind.We saw the benefits of this disciplined approach againthis year. Perhaps the most obvious example was ourdirect pandemic-related underwriting losses, which weremodest on an absolute basis and low relative to the restof the industry.However, the pandemic was not the only major event of2020 for which we were well positioned. We estimatethat due to the underwriting actions we took to manageour exposure to wildfires over the past several years inthe highest risk areas of California, our losses for the fivelargest wildfire loss events in California this year werereduced by more than one third and were significantlylower than our market share in the affected areas. Similarly,we actively manage and maintain a disciplined approach tocoastal underwriting, including thoughtful risk selection,flood sub-limits and coastal deductibles. As a result, ourshare of industrywide 2020 hurricane peril losses was
significantly lower than our market share in the affectedareas. We are also pleased that when we look at our overallproperty catastrophe losses over the past five years, ourshare of property catastrophe losses relative to totalproperty catastrophe losses for the domestic property andcasualty industry has declined significantly and has beenmeaningfully lower than our corresponding market share.passive rate takers. Our deliberate pricing strategy is alsobenefiting from a number of industrywide factors puttingupward pressure on prices, including increased weatherrelated volatility, historically low interest rates and agrowing recognition of higher loss trend in the liability lines.We are encouraged by the pricing environment and willcontinue to leverage the power of our franchise to meetour return objectives.Underlying these impressive underwriting results is aculture that understands how to balance the art andscience of decision making based on data and analytics.This culture alone is a competitive advantage, and one thatwe believe is hard to replicate. As I have said before, ourunderwriting expertise is a hallmark of our success, andevaluating risk and reward is at the heart of what we do.Importantly, we also maintained an expense ratio below30% for 2020, even after the impacts of the pandemic,such as the premium refunds we provided to ourPersonal Insurance auto customers. This reflects thecontinued effective execution of our strategy to improveproductivity and efficiency.Resiliency in the Face of Economic HeadwindsInvestment ExpertiseWe remained committed to our underwriting fundamentalslast year as we adapted to changes in the business andeconomic environment and delivered products, services andcapabilities that our customers, agents and brokers value.As a property and casualty insurer, we insure the outputof the economy, and, accordingly, changes in economicactivity have a direct impact on our top line. We are pleasedthat in a year of historic economic disruption, we grew netwritten premiums by 2% to a record 29.7 billion. Theseresults reflect the strength of our value proposition and thesuccess of our marketplace strategies. Across the enterprise,we achieved significant rate gains where needed andstrengthened terms and conditions where warranted, whilemaintaining historically high retentions.Much like our underwriting strategy, successfully balancingrisk and reward is at the heart of our well-defined andconsistent investment philosophy. Our investmentportfolio is managed first and foremost to support ourinsurance operations and, accordingly, is positioned tomeet our obligations to policyholders under a wide range ofconditions. With this in mind, we emphasize risk-adjustedreturns and credit quality rather than reaching for yield thatis not commensurate with the underlying risk.Underlying these impressive underwritingresults is a culture that understands howto balance the art and science of decisionmaking based on data and analytics. Thisculture alone is a competitive advantage,and one that we believe is hard to replicate.This marketplace execution is the result of effectiveleadership by our business and functional leaders and verystrong performance by our underwriters in the field. Asalways, we are actively managing all levers of profitabilityavailable to us, including risk selection, mix of business,claim and expense initiatives, volume, reinsurance, termsand conditions, and, of course, price. We price ourproducts with a return objective in mind – we are notOur asset allocation is designed so that the predictablestream of investment income from our fixed incomeportfolio will provide a firm and reliable foundation for ourbusiness. That is exactly what we saw in 2020, and thatis our investment philosophy at work. Our high-qualityinvestment portfolio generated strong net investmentincome of 1.9 billion after-tax in 2020 – an impressiveresult given the impact of the disruption in the globalfinancial markets on our alternative investment portfolioand the effect of the record low interest rates on our fixedincome portfolio.Profitable GrowthNow that I’ve shared our 2020 results, let me take amoment to put them into a broader context. We remainsteadfast in our view that return on equity over time is theright way to measure our success and that any commitmentto deliver an industry-leading return on equity overtime also requires a strategy to grow over time. To thatend, several years ago, we laid out a strategy to achieveprofitable growth in the context of the forces of changewe have previously identified as impacting our industry– namely, changing consumer expectations, emerging3
technology trends, more sophisticated data and analytics,and evolving distribution models. In light of these trends,we have established key innovation priorities and areinvesting in capabilities consistent with those priorities.that we know well. Over this same period, through ourongoing and relentless focus on optimizing productivityand efficiency, we have also improved our expense ratioby about two points compared to the run rate from earlierin the decade. The results of these efforts are significantlyhigher underlying underwriting income, meaningfullyhigher cash flow from operations and double-digit growthin invested assets. Those results have contributed to ourultimate objective of creating shareholder value throughindustry-leading return on equity over time. Our corereturn on equity has increased in each of the last threeyears and averaged 11% over that period, even afterbearing the impact of the pandemic, significant catastropheand non-catastrophe weather-related losses, a meaningfulincrease in social inflation and historically low interest rates.We successfully executed on this strategy again in2020 despite the challenging economic and operatingenvironment. As illustrated by the accompanying charts,since 2016, we have grown net written premiums at acompound annual rate of 4.5%, substantially outpacingboth gross domestic product growth over the sameperiod and our own growth rate of 2.4% in the prior yearsof the decade.We have accomplished this growth while maintaining astable underlying underwriting margin. In other words, wehave not grown by underpricing our products or changingour risk profile. The growth has come organically fromcustomer segments, products, geographies and producersIn short, our performance this year and over recent years isthe result of a sound strategy, excellence in execution andthe successful achievement of our strategic objectives.Stable Underlying Combined Ratio1Accelerating Net Written Premium Growth 29.7BGR% CA96.7% 4.5 22.2B2011201220132014201520162017201890.7%AVG 92.1% 2.4% CAGR201920202011Improving Expense Ratio201220132014201520162017201820192020Higher Underlying Underwriting Income1AVG 9.9%2019 1.1B2020Avg.2011-2015 6.5B 97%2017201820192020 79.2B 14% 3.3B ng Invested Assets2Higher Cash Flow From OperationsAvg.2011-2015 2.0B 82%20162017201820192020Excludes the impact of catastrophes and prior year reserve development.Invested assets excludes net unrealized investment gains (losses).
Broad Product Breadth and SpecializationOur Diversified BusinessesWe engage broadly across nine major lines of insurance through our three business segments – Business Insurance,Bond & Specialty Insurance and Personal Insurance. Our portfolio is balanced across these lines of business and furtherdiversified by geography and customer size and type. Each of our businesses is high performing and contributedmeaningfully to our 2020 performance.2020 Net Written PremiumsBusiness InsuranceBusiness InsuranceBusiness Insurance produced a solid underlyingcombined ratio of 95.5%, an improvement of 70 basispoints as compared to 2019. Despite the difficulteconomic and operating environment, our marketplaceexecution was excellent, and we remain pleasedwith the resilience of our business. In our domesticbusiness, we achieved record renewal rate of 7.4%,with meaningful increases in all product lines exceptworkers compensation, where profitability has beenstrong. Importantly, these rate levels were achievedwhile maintaining historically high retentions.22%InternationalWorkers Compensation7%23%CommercialMulti-Peril 15.4 Billion14%Property18%Commercial Auto16%General LiabilityBond & Specialty InsuranceBond & Specialty InsuranceBond & Specialty Insurance had another strong year,posting an underlying combined ratio of 87.0%. Thesegment delivered 8% net written premium growth,largely driven by record Management Liability renewalpremium change, with retention near historicalhighs. These resilient results in light of the difficulteconomic and operating environment are justthe latest example of this segment’s remarkableperformance over time.International11% 3.0 Billion29%Surety Bond60%ManagementLiabilityPersonal InsurancePersonal InsurancePersonal Insurance results were exceptional in 2020,with record levels of both segment income of 1.2 billionand net written premiums of 11.3 billion. Net writtenpremiums grew 5% in 2020, driven by domestic retentionof 85%, renewal premium change of 5% and a 15%increase in new business. Personal Insurance ended theyear with record domestic policies-in-force. Underlyingresults were very strong, with an underlying combinedratio of 85.0%, reflecting significant improvementacross products (automobile and homeowners) andgeographies (United States and Canada).Direct-to-Consumer6%4%International 11.3 Billion45%45%Agency Home& OtherAgency Auto5
Return on 20152017201820192020U.S. P&C Insurers12020 forecast: 2020 Conning, Inc., as published in Conning’s Property-Casualty Forecast & Analysis by Line of Insurance,used with permission. Historical data from the Insurance Information Institute (III), including the 2021 III Insurance Fact Book.Our Claim ExcellenceOur claim-handling ability remains a crown jewel of ourorganization – it is both at the heart of our promise to ourcustomers and a significant competitive advantage.Our highly sophisticated claim model enables us tohandle essentially 100% of our claims under nearly anyforeseeable circumstance without resorting to third-partyclaim handlers, which produces a better experience forour customers and a more efficient outcome for us. Thisyear was no different. Despite the challenges caused by thepandemic, we effectively responded to a record numberof catastrophe events and a more than 50% increase incatastrophe claim volume as compared to the prior year.We met our objective of closing more than 90% of allclaims arising out of catastrophe events within 30 days – anexceptional result given both the volume of claims and thelogistical challenges posed by the pandemic.Our claim-handling ability remains a crownjewel of our organization – it is both at theheart of our promise to our customersand a significant competitive advantage.We also accelerated our digital transformation this yearto meet customer demand for virtual claim handlingduring the pandemic and beyond. Consistent with ourinnovation priorities, our Claim organization has madesignificant investments in digital capabilities over the pastseveral years. This has enabled us to seamlessly serveour customers since the start of the pandemic and takeadvantage of the rapid acceleration of digital adoptionduring the crisis, all while meeting our objective of62016paying what we owe – no more and no less – quickly andefficiently. This year, by leveraging our state-of-the-artdigital capabilities, we handled 40% more auto appraisalsand wind/hail claims and 70% more water claims virtuallywithout the need for a live inspection, as comparedto pre-pandemic levels. In addition, we expanded ourworkers compensation telehealth capabilities throughoutall stages of the recovery journey, with usage of ourtelemedicine capabilities up dramatically year-over-year.All this means a better experience for our customers anda more efficient outcome for us – a result that will paydividends for years to come.Consistent and Successful Long-Term Financial StrategyDelivers Shareholder ValueIt is important to consider our results in the context ofwhat we are ultimately trying to achieve. At Travelers, oursimple and unwavering mission for creating shareholdervalue is to: Deliver superior returns on equity by leveraging ourcompetitive advantages; Generate earnings and capital substantially in excess ofour growth needs; and Thoughtfully rightsize capital and grow book value pershare over time.The results we deliver are due to our deliberate andconsistent approach to creating shareholder value. Wehave been clear for many years that one of our crucialresponsibilities is to produce an appropriate return onequity for our shareholders. This has meant developing andexecuting financial and operational plans consistent withour goal of achieving superior returns, which we definedmany years ago as a mid-teens core return on equity overtime. We emphasize that the objective is measured over
time because we recognize that interest rates, reservedevelopment and weather, among other factors, impactour results from year to year, and that there are years – orlonger periods – and environments in which a mid-teensreturn is not attainable. In that regard, we established themid-teens goal at a time when the 10-year Treasury wasyielding around 5%, and in that environment, a mid-teensreturn was industry leading. As we have said before, ourability to achieve a mid-teens return over time goingforward will depend on interest rates returning to morenormal levels by historical standards. In any event, wealways seek to deliver industry-leading returns over time.Our 2020 return on equity of 10.0% and core return onequity of 11.3% again meaningfully exceeded the averagereturn on equity for the domestic property and casualtyindustry of 5.1%, according to estimates from Conning,Inc., an insurance asset management firm. As shown inthe chart on page 6, our return on equity has significantlyoutperformed the average return on equity for the industryin each of the past 10 years.Importantly, over this 10-year period, our return onequity has also been less volatile than that of others in theproperty and casualty industry. The level and consistencyof our return on equity over time reflect the value of ourcompetitive advantages and the discipline with which werun our business.Our Financial StrengthOnce again, we ended the year extremely well capitalized,with no maturing long-term debt over the next five yearsand all our financial strength indicators at or better than ourtarget levels, including a debt-to-capital ratio of 18.3% (20.7%excluding after-tax net unrealized investment gains includedin shareholders’ equity) – well within our target range of 15%to 25%. Our strong balance sheet and our consistent returnsover time have enabled us to grow book value per share andadjusted book value per share at a compound annual rate of7% and 6%, respectively, over the last 10 years.Adjusted Book Value Per Share1 55.0120111 59.092012 66.412013 70.982014 75.392015 80.44 83.36 87.27201620182017 92.762019 99.54At the same time, we have returned a significant amount ofexcess capital to our shareholders through dividends andshare repurchases. Over this 10-year period, we increasedour dividend each year and grew dividends per share at anaverage annual rate of 9%.Dividends Per Share 1.59 1.7920112012 1.962013 2.152014 2.382015 2.622016 2.832017 3.032018 3.23 3.3720192020Notably, since we began our share repurchase program in2006, we have returned approximately 47 billion of excesscapital to our shareholders, including through 36 billionof share repurchases, which is well in excess of the marketcapitalization of the company at that time. We repurchasedthose shares at an average price per share of 68.00.Our capital management strategy has been an importantdriver of shareholder value creation over time. Our firstobjective for the capital we generate is to reinvest it inour business – organically and inorganically – to createshareholder value. For example, as we continue to growour premium volumes, as we have for the past few years,we will retain more capital to support that growth.Also, we continue to invest in everything from talent totechnology to further our innovation agenda and advanceour strategic objectives.Having said that, we are disciplined stewards of ourshareholders’ capital. To the extent that we generate capitalthat we cannot reinvest consistent with our objective ofgenerating industry-leading returns over time, we willmanage it the same way we have for more than a decade– by returning it to our shareholders through dividendsand share repurchases. By returning excess capital toour investors, we give them the ability to allocate theirinvestment dollars as they see fit, including by investing incompanies with different growth profiles or capital needs,thereby efficiently allocating capital across the economy.2020Excludes net unrealized investment gains (losses), net of tax, included inshareholders’ equity.7
Total Return to . 1,2008Dec. 31,2008Travelers1Dec. 31,2009Dow 30Dec. 31,2010Dec. 31,2011S&P 500Dec. 31,2012Dec. 31,2013Dec. 31,2015Dec. 31,2016Dec. 31,2017Dec. 31,2018Dec. 31, Dec. 31,20192020S&P 500 FinancialsRepresents the change in stock price plus the cumulative amount of dividends, assuming dividend reinvestment. For each year on the chart, totalreturn is calculated with January 1, 2008, as the starting point and December 31 of the relevant year as the ending point. Source: Bloomberg.Total Shareholder ReturnUltimately, it is the success of our strategy – with allits component parts – that drives our total return toshareholders over time. These unprecedented times are animportant reminder that we have a well-established trackrecord of managing the company to create value over thelong term, through periods of weather volatility; throughanticipated and unanticipated developments impacting losstrends; and through both foreseeable and unforeseeableeconomic cycles and more extreme economic conditions.With that in mind, the graph above compares our returnssince the 2008 financial crisis to the returns for the Dow 30,the S&P 500 and the S&P 500 Financials.We are as confident as ever that executing on our longterm financial strategy, managing Travelers with an overtime discipline and continuing to invest in our competitiveadvantages is the right approach for building on Travelers’outstanding record.Innovating Through the PandemicThe past year has demonstrated the value of the Performand Transform agenda we have pursued over the pastfew years – it has enabled us to adapt to, and executethrough, extraordinary circumstances. The significanttechnology and operational investments we have madewere crucial to our ability to address the challenges of thepandemic while simultaneously delivering strong financialresults for our shareholders.8Dec. 31,2014As the post-pandemic world comes into focus, we willcontinue to leverage our scale and resources to invest andinnovate for the future. We are not innovating for the sakeof innovation but rather in service of a clear vision to be:the undeniable choice for the customer and anindispensable partner for our agents and brokers.In support of that vision, our innovation agenda is focusedon three priorities: Extending our advantage in risk expertise; Providing great experiences for our customers, agentsand brokers and employees; and Optimizing our productivity and efficiency.For example, we are methodically digitizing virtuallyevery aspect of the value chain, while at the same timeenhancing our advanced analytics. We are deployingadvanced
The Travelers Companies, Inc. (NYSE: TRV) is a leading provider of property casualty insurance for auto, home and business. A component of the Dow Jones Industrial Average, Travelers has approximately 30,000 employees and generated revenues of approximately 32 billion in 2020. For mor. e. information, visit Travelers.com. Financial Highlights