Transcription
Syracuse Bicycle PlanA Component of the Syracuse Comprehensive Plan
SYRACUSE BICYCLE PLAN 2040Stephanie A. Miner, MayorCommon Council MembersHon. Van B. Robinson, PresidentAt-Large CouncilorsHon. Lance Denno, Majority LeaderHon. Helen HudsonHon. Kathleen JoyHon. Jean KessnerDistrict CouncilorsHon. Jake Barrett – 1st DistrictHon. Patrick J. Hogan – 2nd DistrictHon. Bob Dougherty – 3rd DistrictHon. Khalid Bey – 4th DistrictHon. Nader Maroun – 5th DistrictBureau of Planning & SustainabilityAndrew M. Maxwell, MPA, DirectorOwen Kerney, Deputy DirectorPrincipal PlannerPaul Salvatore Mercurio, MLACity Hall233 E. Washington StreetSyracuse, NY 132022012, City of Syracuse
Table of ContentsExecutive Summary 4Introduction 5Chapter 1Making the Case 7EconomicsHealthEquitySafetyCommunityChapter 2Inventory Measures and Maps 19Safety MeasuresConnectivity MeasuresDesign MeasuresMapsChapter 3Tool Kit 31PathwaysParkingChapter 4Neighborhood Recommendations orthsideLakefrontAppendicesAppendix A: Inventory Maps 89Appendix B: Public Participation 107
Executive SummaryThe Syracuse Bicycle Plan 2040 is a component of Syracuse’s Comprehensive Plan 2040– an update of the Comprehensive Plan 2025 adopted by the Common Council in 2005.This component addresses both the justification for creating a rigorous bicycle network,as well as outlining how the City of Syracuse can expand its current system.The Syracuse Bicycle Plan is broken out into four main chapters, each address a differentguiding principal for the component:Making the CaseInform the public about the personal and social benefits engendered withbicycle transportation.Inventory Measures and MapsProvide a clear methodology for determining the best corridors for bicycleinfrastructure.Tool KitHighlight appropriate bicycle infrastructure options for the City of Syracuseenvironment.Neighborhood RecommendationsPropose conceptual designs for corridors and identify which users would beaccommodated.4Syracuse Bicycle Infrastructure Plan
IntroductionOrigin of the Bicycle PlanIn the 21st Century, bicycling is becoming a more desirable transportation optionfor many people. Cities across the county have responded with expanded bicyclenetworks, which in turn have increase bike ridership and lowered accident rates. InSyracuse, bike lanes first began appearing in 2006. Going through various corridors inthe City’s Eastside, these bike lanes were the result of neighborhood requests to bothaccommodate existing cyclists and slow down motorized vehicles. Since this time, bikelanes have continued to expand based, on citizen feedback and safety needs.In 2010, the demand for more bicycle infrastructure remained strong, and the Cityadministration determined a need to create a plan for a cohesive and connected bicyclenetwork, or a blueprint for future growth. This blueprint would ensure that developmentalong targeted corridors would accommodate bicycle users, and that city resourceswould be deployed most effectively in expanding and maintaining bike infrastructure.It is from this initial vision of an interconnected city-wide bike network that the SyracuseBicycle Plan 2040 was created.Plan OrganizationDuring the initial outreach process it became clear that a network plan alone would notsuffice. Many people in the City of Syracuse were were unconvinced of the need for anycycling infrastructure. A series of five white papers were developed and incorporatedinto the Bicycle Plan. Highlighting five areas (both personal and societal) in whichbicycling has a positive effect, these papers provide targeted education to interestedcitizens. These five areas are: Economic. Cycling as a transit mode has positive effects on the local economywith regard to tourism dollars and also has less impact on a household’s monthlytransportation budget. Health. Cycling is a low-impact cardio-vascular activity that can becomeincorporated into one’s daily commuting routine, provides improved air quality andemits no greenhouse gasses. Equity. Bicycle networks can provide a dignified mode of travel for individualswithout the ability to afford a car, and increase mobility for children and the elderly. Safety. Large-scale bike networks have been shown to reduce the rate of cyclistaccidents, and also make streets safer for all people by slowing down the speed ofmotorized vehicles.A Component of the Syracuse Comprehensive Plan5
Community. Cities who have embraced a cycling culture have found that a sense of community is instilled in bothresidents and commuters along bike corridors.In Chapter One: Making the Case, the statements above are expanded. Each of the five white papers contain images andgraphs, and all supporting statements are cited for those who wish to research further.Chapter Two: Inventory Measures and Maps contains the main body of the Syracuse Bicycle Plan. In this section, the 13metrics of bicycle appropriateness are listed, along with weighted ranking criteria for each. These metrics are broke intothree general areas: Safety, Connectivity, and Design. The safety measures look at factors of speeds, presence of heavyvehicles, and volume of cars. The connectivity measures determine how well an individual corridor fits into the City-widenetwork. The design measures identify physical conditions of a corridor such as roadway width, topography, and presenceof on-street parking.Many people in Syracuse were also unfamiliar with many of the new options for bicycle infrastructure that were emergingin other parts of the county. Still others had concerns about the uniquely snowy climate of Syracuse and how theseinfrastructure investments would weather. To that end, Chapter 3: Tool Kit was developed. This chapter catalogues variousinfrastructure options appropriate for the City of Syracuse. The first section contains recommendations for pathways whichare infrastructure treatments along a corridor. The parking section recommends appropriate bike racks and other parkingfacilities for Syracuse.Finally, Chapter Four: Neighborhood Recommendations combines the inventory from Chapter Two with the Tool Kit fromChapter Three. This chapter is broken into 8 sections, each conforming to one of the City’s TNT (Tomorrow’s NeighborhoodsToday) planning areas. Each corridor identified in the Inventory is discussed in further detail here. A photo simulation isprovided, along with targeted user groups, and a brief discussion about why the corridor was chosen and how it fits intothe overall network. These recommendations are only intended as a starting point for neighborhood discussion andshould not be considered final design decisions.In this way, what started as a network vision became expanded into a full planning document with multiple goals.Guiding PrinciplesThe following four principles represent this Plan’s vision for a successful bicycle network in the City of Syracuse.Making the CaseInform the public about the personal and social benefits engendered with bicycle transportation.Inventory Measures and MapsProvide a clear methodology for determining the best corridors for bicycle infrastructure.Tool KitHighlight appropriate bicycle infrastructure options for the City of Syracuse environment.Neighborhood RecommendationsPropose conceptual designs for corridors, and identify which users would be accommodated.6Syracuse Bicycle Infrastructure Plan
making the caseBENEFITS OF ACYCLING CITYeconomicshealthequitysafetycommunityA Component of the Syracuse Comprehensive Plan7
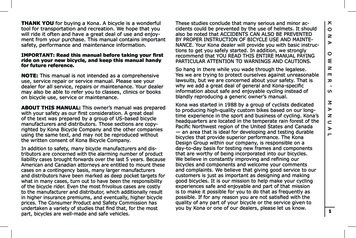
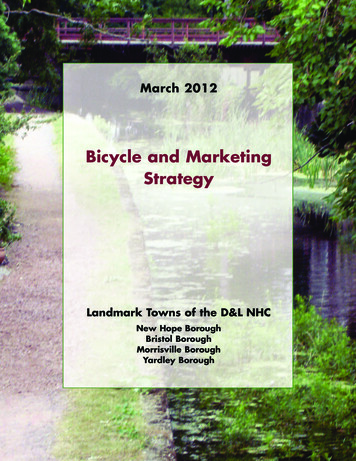
Making the Case: Benefits of a Cycling CityECONOMICSJobs Created Per 1 Million Spentindustry, fuel, & efficiency14131211109876543210Jobs Created by Type ofInfrastructure SpendingJobsOn a local, citywide level, the cycling industry has been shown by manystudies to generate economic stimulation through boosting localemployment and commercial activity. A recent study in Baltimore, Marylandconcluded that pedestrian and bicycle infrastructure projects create nearlytwice the number of jobs compared to road infrstructure projects (11 to 14jobs per 1 million of spending versus 7 jobs per 1 million of spending)2.More importantly, nearly half of these employment opportunities arecreated in industries outside of construction, specifically in the areas ofhealthcare, retail, and food services. The economic stimulation generatedby bike infrastructure extends beyond the initial construction and has aripple effect on the local economy.Pedestrian & Bicycle RoadwayInfrastructureInfrastructureStephen D. Cannerelli, The Post-StandardPERI 2011Erie Canal Tour cyclists in 20098The bicycle industry in the United States is a powerful economic enginethat contributes about 133 billion per year to the U.S. economy fromjobs to taxes to local businesses1.TourismBicycle tourists spend on average 17 more in communities than touriststravelling by other means and dedicate much more time to enjoyinglocal culture, providing incentive to preserve historical attractions such asSyracuse’s Erie Canalway trail1,3. These tourists’ vehicles do not congest trafficor occupy parking spots, and have minimal impact on city infrastructure.By establishing a strong bicycle tourism industry, our city could cultivate alarge flow of income with little impact to maintenance costs. Parks and Trailsof New York (PTNY) encourages all canalway communities, like Syracuse, totake advantage of the historical attraction and connectivity of our locationby providing a thorough bicycle network for tourists to explore.Energy IndependenceThe implications of peak oil warrant a critical shift in American transportationpolicy. Oil is an escalating financial burden to the public as recoverable oilsupplies in the U.S. and globally continue to decline. Each day, over 1.22billion is spent on gasoline in America. It is not only desirable, but necessaryto invest in a full range of viable alternatives to oil-dependent mobility ifwe are to keep transportation affordable and accessible to all citizens.Syracuse Bicycle Infrastructure Plan
Making the Case: Benefits of a Cycling CityInfrastructureBicycle infrastructure allows for more than five times as many travellersas car lanes. Prioritizing bicycle traffic contributes to decreased fossil fueldemand by both decreasing the number of motor vehicles on the roadand limiting the amount of construction and maintenance needed forautomobile infrastructure4.Streetfilms.orgThe monetary benefits of bicycles overautomobiles for individuals and society, fromenergy and congestion reduction to vehicle andinfrastructure savings, are estimated to total 2.73 per mile biked4.Cyclists in lane in NYCUltimately, Syracuse is in an excellent position for an improved bicyclenetwork due to its dense urban grid built predominantly on a human scale,as well as a strong population density near the urban core. Cities show themost potential for a significant return on bike network investments dueto existing infrastructure, density of economic interactions, and minimalinfrastructure investment required for a potentially maximized userpopulation. By investing in bicycle mobility, Syracuse stands to establisha functioning alternative transportation system prior to potential fuelshortages and escalating prices, placing our city steps closer to a mobile,sustainable future.A Component of the Syracuse Comprehensive Plan9,000Annual Spendingon Transportation by Mode8,0007,0006,0005,0004,000Jim Motavalli, NYTimesIndividual CostsOwning a bicycle is much less expensive than owning an automobile.When comparing the cumulative costs of purchasing and maintaininga family vehicle to a bicycle, the bicycle will save an average Americanfamily of three more than 6,000 per year. In 2009, the average Americanhousehold spent roughly 8,000 on vehicles and maintenance5. Duringthe same year, purchasing and maintaining a bicycle cost, on average, 400 per cyclist. During times of volatile fuel prices, this gap betweenbicycle and motorized vehicle costs will likely continue to grow.Annual Household Spending in US Dollars (2007)Victoria Transport Policy eferences1. Flusche, Darren. (2009) The EconomicBenefits of Bicycle Infrastructure, The League ofAmerican Bicyclists.2. Peltier, Heidi Garrett. (2011) Estimating theEmployment Impacts of Pedestrian, Bicycle,and Road Infrastructure, Political EconomyResearch Institute (PERI).3. Erie Canalway National Heritage Corridor,Parks and Trails New York, and New York StateCanal Corporation.(2010) Attracting bike tourists to your trail:lessons from the canalway. Economic Benefitsof Trails.4. Litman, Todd. (2011) Evaluating NonMotorized Transportation Benefits and Costs,Victoria Transport Policy Institute.5. Gehl, Jan. (2010) Cities for People. Page 104.6. Motavalli, Jim. (2009) The Costs of Owning aCar, New York Times.9
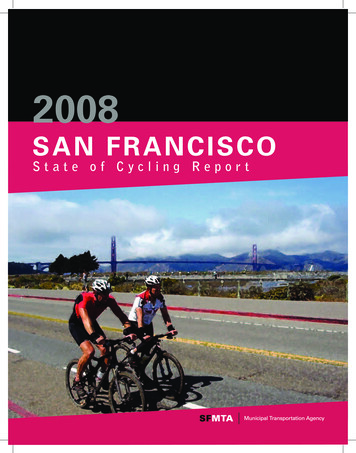
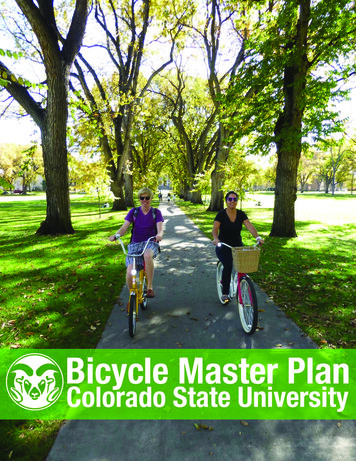
Making the Case: Benefits of a Cycling CityHEALTHphysical & environmental80357030602550204015301020510Peter Drew0Overcomingobesity.wordpress.comMotor vehicles have made transportationinto an inactive sndLaiatv0PersonalIn the past two decades, the United States and countries around the worldhave seen a sharp rise in obesity and associated increases in risk of majorhealth problems such as cardiovascular disease, certain types of cancer,and type-2 diabetes1. Compared to Americans at 34% obesity prevalence,some European countries, such as the Netherlands, have populations withonly about 10% defined as obese. With longstanding, extensive, and wellused active transportation systems, Europeans generally walk more thantwice and cycle almost five times more annually than the average American,suggesting an inverse relationship. This connection between high levels ofactive transportation and obesity rankings has been confirmed by studiesin the US and Europe2. As such, government has an obligation to updatetransportation infrastructure to include and emphasize access to walking,cycling, and public transit. Active transportation networks address themajor determinants of obesity, diet and exercise, with opportunities to: 10AUSJournal of Physical Activity & Health40Walk Bike Transit Trips (%)Prevalence of Obesity (%)Obesity Prevalence in relation to Active Transportationincrease density of local services,provide safe routes to access grocery stores with affordable, fresh food,encourage daily physical activity through safe and connectedneighborhoods.Syracuse Bicycle Infrastructure Plan
Making the Case: Benefits of a Cycling ial.wordpress.comTransportation cycling improves health and saves time by making exercise into an enjoyable, outdoor part of your daily routine.Portland, OR, New York, NY, and now Syracuse are a few examples of UScities addressing obesity and general health issues by investing in urbanplanning strategies that reduce reliance on automobile transportationand encourage healthy, active lifestyle choices. These strategies include: creating recreation facilities and opportunities for more outdoor,active engagement with the environment, encouraging private businesses to provide safe bicycle parking andlocker rooms to make commuting more convenient and attractive, promoting programs that provide health education and resources.further decreases air pollution,decreases impacts of polluted run-off and combined sewer overflow,decreases the urban heat island effect,provides more habitat for native species,improves visual character of urban environment.GlobalBeyond regional ecosystem health, cycling produces no emissions ofgreenhouse gases, which are responsible for altering the global climate.Syracuse’s contributions to climate change can be drastically reduced byencouraging non-motorized transportation.A Component of the Syracuse Comprehensive PlanPoint Sources(Business & Industry)Area Sources1%(Fireplaces, wood stoves, etc.)10%On-road Mobile(Cars, trucks, & buses)68%US Greenhouse Gas Emissions by SectorResidential& 20%Transportation27%EPA.gov Non-road Mobile(Ships, trains, planes, etc.)21%Pscleanair.orgRegionalBeyond personal health, shifting from car dominance to bikeengagement offers opportunities for improving the health of the cityas an ecosystem through reducing vehicular emissions of harmfulchemicals like sulphur oxides and nitrogen oxides. Syracuse, whileno longer a nonattainment area for atmospheric concentrationsof carbon monoxide, is nearing the threshold levels for ozone (asdesignated by the US Environmental Protection Agency). In additionto air quality improvement, a robust bicycle network could reduce thearea of impermeable surface needed for roads and parking lots, andconsequently, increase the land available for vegetative cover, which:Sources of Air PollutionReferences1. OECD Health Data. (2005) Health Statistics:obesity (most recent) by country. (www.nationmaster.com/graph/hea obe-health-obesity)2. Bassett et al. (2008) Walking, cycling, and obesityrates in Europe, North America, and Australia.Journal of Physical Activity & Health, 2008, 5, 795814. Human Kinetics, Inc.11
Making the Case: Benefits of a Cycling CityEQUITYethnicity, income, gender, & ageEnrique Penalosa,former mayor of Bogota,ColombiaMajor Racial Groups in SyracuseCity-data.comCaucasianAfrican AmericanHispanicAsianCitiesforpeople.net“A bikeway is asymbol that showsthat a citizen ona 30 bicycle isequally importantas a citizen in a 30,000 car.”Cyclists enjoying a safe, two-way dedicated bike path in Bogota , ColombiaEthnicity & IncomeThe physical health effects mentioned in the previous section are not equallydistributed among the population in terms of ethnicity as the incidence ofobesity is 51% higher for African-Americans and 21% higher for Hispanicscompared to Caucasians1. The City of Syracuse is 57.4% Caucasian, 28.3%African-American, and 6.5% Hispanic2. Many minority communities inthe city are in the low to middle income levels with over one third of thecity’s population facing poverty and limited resources. Limited financialresources due to social disadvantages for education and employmentopportunities result in a much higher vulnerability to poor diets andsedentary lifestyles for minority groups. In addition, transportation costsfrom motor vehicle purchase, fuel, and maintenance can take up to 40% ofexpenditures for lower income families.With a well-established, accessible bike network connecting underservedneighborhoods to destinations throughout Syracuse, these families wouldbe able to reallocate much of their transportation spending to better food,housing, recreation, and other areas vital to evening the differences inquality of life between households of different income levels.12Syracuse Bicycle Infrastructure Plan
Making the Case: Benefits of a Cycling CityLacyclechic.blogspot.comGender & AgeWomen, children, and the elderly - who comprise the majority of thepopulation and are underrepresented in the cyclist and pedestriancommunity - are generally interested in joining the active transportationnetwork, but reluctant to regularly walk or bike in areas that feel unsafeand difficult to navigate.Women only make up 24% of the total cyclist population in theUS. Commonly cited reasons are that women don’t want to arrive atdestinations sweaty and unkempt and are more wary of dangeroussurroundings. However, a recent survey shows that convenience andinfrastructure are the top two reasons for the low percentage of femalecyclists3. Females generally have more errands to run. Household dutiesfrom dropping kids at school to picking up groceries continue to fall intothe hands of women, even with full time employment4. Both convenienceand infrastructure can be improved directly with bikeway planning.Children and the elderly are also a vulnerable population. They needaccess to means of frequent public socialization and recreation, butoften are relient on others to transport them for fear of safety anddisorientation.Woman in Los AngelesIntegrating bicycle and pedestrian routes into a continuous and regularmulti-modal transportation network can address the need for equity ingender and age active mobility, as well as between income levels.Bikefancy.blogspot.comBikesbelong.orgWoman and kids in ChicagoChildren and elderly man cycling in Boulder, ColoradoA Component of the Syracuse Comprehensive PlanReferences1. OECD Health Data. (2005) Health Statistics: obesity(most recent) by country. (www.nationmaster.com/graph/hea obe-health-obesity)2. City Data. (2010) Syracuse, New York. tml)3. Association of Pedestrian & Bicycle Professionals.(2011) Women Cycling Project: What would make youstart or increase your cycling?4. Blue, Elly (2011) Biking’s gender gap: It’s the economy,stupid gender-gap-its-the-economy-stupid)13
Making the Case: Benefits of a Cycling CitySAFETYcalm traffic & complete streetsMobility vs. AccessActive Design Guidelines NYCMobility measures how faryou can go and accessibilitymeasures how close you areto where you want to go.Transportation policy thatprioritizes personal mobilityvia automobiles and highwaysis one of the factors thatinduced the decline of theurban core and spread ofsuburban sprawl in Syracuse’ssurrounding neighborhoods1.By reframing transportationplanning to fulfill the needfor access to resources likeschools, community spaces,and local retail stores,we can re-emphasize theimportance of dense, mixeduse development.Bus lane separated from bicycle and motor vehicle lanes by a median that also serves as apedestrian refuge in New York CityStreets play an integral role in the daily life of our neighborhoods for travel,activities, and socialization. For the past half century, the automobilehas been the dominant mode of transportation, demanding wider andstraighter roads to accommodate increases in speed and volume of cartraffic. This yielding to the automobile has led to the decline of other streetuses and activities, like cycling and walking, vital to sustaining safe andinteractive communities. Transportation planning for smart growth mustshift from promoting mobility to accessibility (see sidebar).Traffic calming is a road design strategy that creates safer streets andpromotes balanced multi-modal mobility by engaging a variety ofstreetscape changes that slow the speed of motorized traffic. By utilizingbump outs (left) and medians (above) to narrow the width of streets andproviding separate or shared travel lanes, streets can safely accommodatea variety of transit modes.SMTCWater Street, Syracuse NY“Street design strategies that attract bikeriders are the same ones that inprove safetyfor all road users.”Norman Garrick & Wesley Marshall4bump out14Syracuse Bicycle Infrastructure Plan
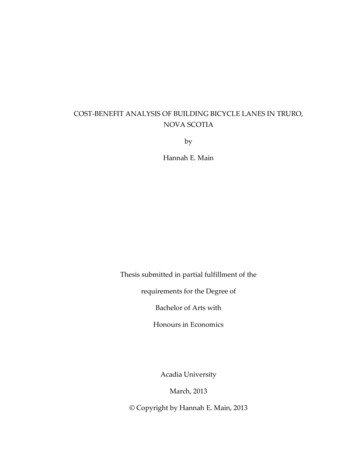
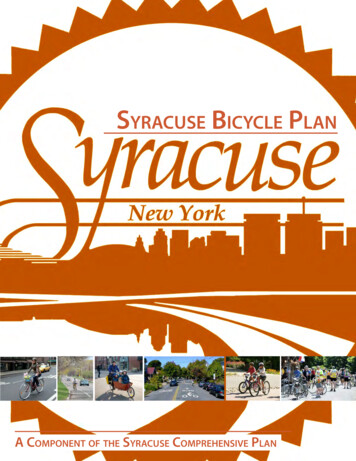
Making the Case: Benefits of a Cycling CityFatalities Based on Speed ofVehiclechance of deathif hit by a motor vehicle80%70%60%50%40%30%20%10%0%20 mi/h30 mi/h40 mi/hU.K. Department of Transportation, Killing Speedand Saving Lives, London, 1987.90%Four Types of Transportation Cyclists in PortlandBy Proportion of Populationno way no how33%interested but concerned60%enthused & confident7%strong & fearless 1%Portlandonline.comspeed1 mi/h 1.61 km/hAccidents & AttitudesThe level of safety along multi-modal transportation corridors is primarilydetermined by the speed and volume of car traffic. The frequency andseverity of automobile crashes can be reduced by lowering speed limitson roadways. According to a U.K. Department of Transportation study,on average, for every one mile per hour reduction, collisions decreaseby 5%; the fatality rate would drop by at least 80% if a 40 mph zone werereduced to a 20 mph zone2. Data shows that cyclists and pedestriansare over-represented in road deaths at almost 14% of fatalities3. Eventhough 12% of all trips taken in America are by bicycle or foot, cyclistsand pedestrians are under-represented in road infrastructure spendingtaking only about 1% of the budget3. The death rate of U.S. pedestriansand cyclists is two to six times higher per kilometer traveled than inEurope due to our lack of investment in safe and integrated varioustransport infrastructures in streetscapes. These accident rates reflect thefear and discomfort felt by 60% of urban citizens, who are interestedbut concerned about bicycling as their main mode of transport on cardominated roads. Transportation cycling should be accessible for thewhole population, rather than only for the confident and fearless (seebar graphic above). As the number of cyclists on the streets grows withinfrastructure, driver awareness and road safety will increase (see graphto the right).Providing adequate funding to create delineated and respected spacefor multi-modal transportation infrastructure would improve the overallincidental and perceived safety of urban streets with quality streetscapesand transportation facilities. In Syracuse, two intersections were noted aspart of a list of most dangerous intersections for pedestrians and cyclistsof upstate New York: Seymour Street & South Geddes Street with 10incidents, East Fayette Street & South Salina Street with 7 incidents.The safety of both can be improved much through implementing bicycletreatments that would balance street activity and calm traffic.A Component of the Syracuse Comprehensive Plan130/81mio. km/miles1996 index 5199619982000200220042006Jan Gehl, Cities for PeopleGraphic showing a decrease in cyclist accidentsas the numbers of miles cycled and miles ofbicycle pathways increaseReferences1. SMTC. (2011) Long Range Transportation Plan.Chapter 5: Land Use. er5 LandUse.pdf)2. Finch D.J., P. Kompfner, C.R. Lockwood & G. Maycock.(1994) Speed, Speed Limits and Accidents, TransportResearch Laboratory (www.trl.co.uk), Report 58.3. US DOT. (2011) New data adds job creation to themany benefits of bicycle infrastructure. cture.html)4. Garrick, Norman and Wesley Marshall (2011)Evidence on Why Bike-Friendly Cities are Safer forAll Road Users hy%20Bike-Friendly.pdf)15
Making the Case: Benefits of a Cycling CityCOMMUNITYactivity & understandingStreetswiki.wikispaces.comquality of physical environmentJan Gehl, Cities for PeopleOutdoor Quality & Outdoor ActivityCyclists and pedestrians interacting in a farmers market in New York CityActivityIn addition to the many other tangible benefits, emerging studies areshowing that bicycle infrastructure helps foster community vitiessocialactivities“What attractspeople most, itwould appear, isother people.”A safe, connected, well-designed bicycle network improves the quality ofoutdoor spaces, which is linked to the amount of social outdoor activities(see graph on left). The higher the quality of public spaces, the higher thefrequency and density of social activities. More social activities cultivatestronger communities of active citizens through enabling and encouragingmore diverse public interactions. Reinvestment in the shared public realmcan improve social connections for people of all backgrounds by engagingcitizens in a travel mode that allows for more active awareness of theirstreets and participation in their neighborhoods.Active streets also strengthen safety by creating public places that are usedregularly by all citizens. A consistent density of people on the streets providesa greater sense of community, as well as security against crime with moreeyes on the street. Multi-modal transportation infrastructure is extremelysocially valuable because of this effect of lively, self-policed streets.William H. Whyte16Syracuse Bicycle Infrastructure Plan
Making the Case: Benefits of a Cycling CityUnderstandingWithout two tons of steel and glass separating them from theirsurroundings, cyclists are able to better understand the socialatmosphere in which they liveand forge deeper connections with theircity and fellow citizens.Nicholas Lisi, The Post-StandardIn building a cycling-friendly environment with easily accessible andintegrated infrastructure, we provide the opportunity for Syracuse’scitizens to consider cycling as a rational mode of transport. This wouldovercome the fundamental attribution error (see box on bottom right)and invalidate the view that Syracuse is inherently a car-centric city.Understanding other citizens and the possibilities for Syracuse will allowus to move forward in providing infrastructural and social support formore sustainable individual choices.Cyclist on Comstock Avenue bicycle laneJohn. Berry, The Post-StandardCommunities are formed by individuals who are aware andunderstanding of the shared physical and social aspects of urban living.It is in shared spaces and resources, like a bicycle network, that we areable to cultivate an appreciation for both similarities and differences,along with a resilience that enables coordination and cooperation in theface of economic and environmental challenges.FundamentalAttribution Error (FAE)The FAE is an effect describedin social psychology. It is thetendency to attribute otherpeople’s choices to personaldisposition and overlook thesituational factors that oneacknowledges as powerful in one’sown choices1 . In other words, weassume other people are actingmore irrationally than they are, andthat we ourselves are acting morerationally. This undermines theability for people to understandthat every individual chooses themode of transport most availableand suitable to their providedsurroundings.Syracuse’s first bicycle showcase in Near West Side in 2009References1. Druck
Hon. Kathleen Joy Hon. Jean Kessner. District Councilors Hon. Jake Barrett - 1st District. Hon. Patrick J. Hogan - 2nd District . In 2010, the demand for more bicycle infrastructure remained strong, and the City administration determined a need to create a plan for a cohesive and connected bicycle .