Transcription
Basics of MRIProfessor Sir Michael Brady FRS FREngDepartment of Engineering ScienceOxford UniversityMichaelmas 2004
Lecture 1: MRI image formation Basic nuclear magnetic resonance – NMRNMR spectroscopyMagnetic field gradients – spatial resolutionExtension to 2D, 3D – images and volumes
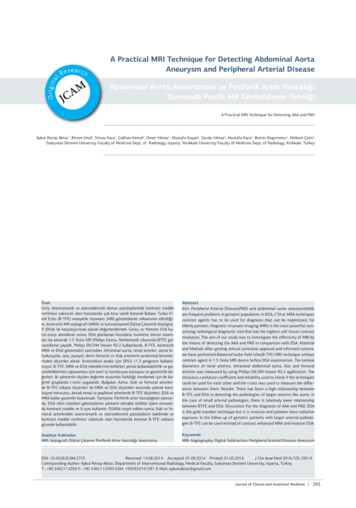
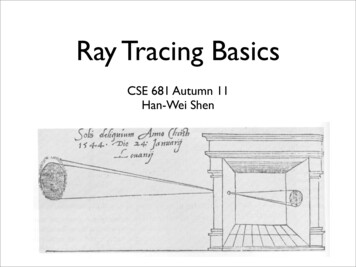
T1 Weighted ImageMR image of a horizontal slice throughthe brain.In this T1-weighted image, grey matteris lightly coloured, while white matterappears darker.T1/sR1/s-1white matter0.71.43grey matter11CSF40.251.5TSPGR, TR 14ms, TE 5ms, flip 20º
Brain image analysis Accurate shapemodelling andmeasurement
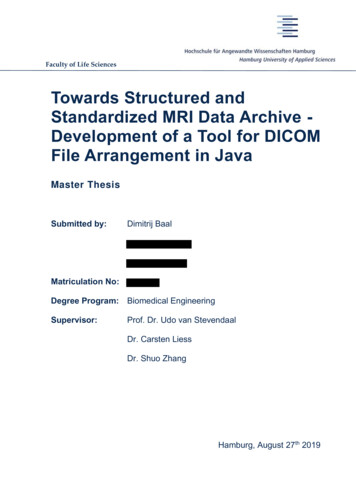
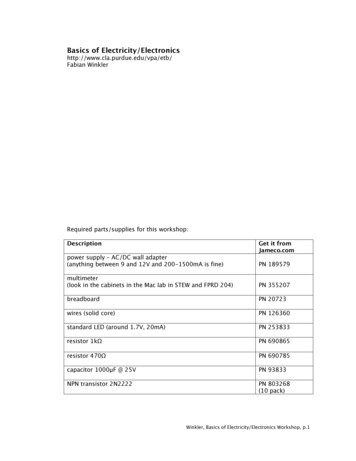
T2 Weighted ImageT2/msCSFgrey matter50080 90white matter70 801.5TSE, TR 4000ms, TE 100ms
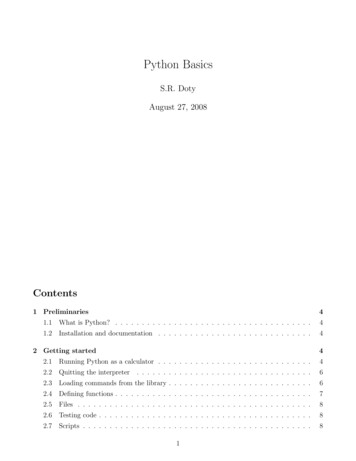
Over the past 20years, we havedeveloped new waysto image anatomy,new ways to seeinside the body, noninvasivelyWe can watch the body inaction, as it responds to theinjection of a drug orcontrast agent, to highlightaberrant physiologyWe canwatch thebodyfunctioningin a wholerange ofways – thebrainthinking,degradationin whitematter, andthe pulsingof the heartNow we arebeginning toimage cellularand molecularprocesses –theconvergenceof molecularbiology andimage analysis
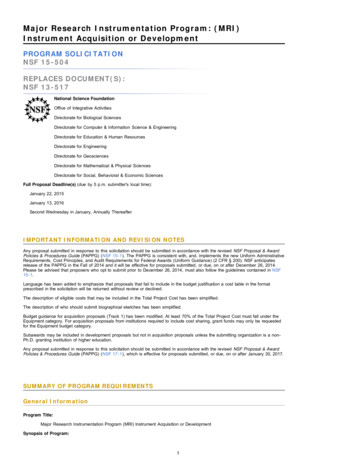
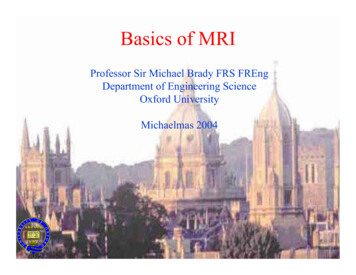
MRI machinesMagnetbedSiemens Avanto 1.5T state-of-theart MRI machine
The MagnetMagnets field strength:imaging 0.2T to 2.0Tspectroscopy- 2.0T to 7.0T Low field Intermediate High field Ultra high0.2- 0.5T0.5- 1.5T1.5- 4.0T 4.0TEarth’s magnetic field 5 10-5 Tesla
MRI System Block DiagramRFampXYZamp amp ampspectrometerr.f.coilgradient coil
MRI is considered ideally suited forsoft tissue problems*** MRI is to soft tissue as x-ray is to dense tissue (bone)*** Diagnosing multiple sclerosis (MS)Diagnosing brain tumoursDiagnosing spinal infectionsVisualizing torn ligaments in the wrist, knee andankle Visualizing shoulder injuries Evaluating bone tumours, and herniated discs inthe spine Diagnosing strokes in their earliest stages
Some disadvantages of MRI Extreme precautions must be taken to keep metallic objectsout of the room where the machine is operating People with pacemakers can't safely be scanned Some people suffer from claustrophobia, and find theconfinement discomforting The machine makes a very loud continuous hammeringnoise when operating Some people are too big to fit inside the magnet MRI scans require patients to hold very still for longperiods of time . up to 90 minutes or more in some cases MRI systems are expensive to buy – and run – so arecurrently beyond most DGHs. An MRI scan costs about 500 to the NHS
MRI installed base 1990 – unit sales of MRI systems, tens tohundreds of MRI scans 2004 installed base is 12,000 MRI systems 75-80 million scans per year ( 400/scan) Market growth at 10% pa Major growth is in high field MRI ( 3T) Despite much excitement about open magnetsystems, take-off is slow (Hitachi dominate thissector) Special purpose MRI systems have not had muchimpact (sigh)
Energy (spin) statesLong before Tony Blair, Quantum Mechanics invented theconcept of spinIn a strong magnetic field, nuclei act like tiny dipolemagnets that align with – or, amazingly, against – the fieldStrongmagneticfieldB0Aligned with the field: lowerenergy stateAligned against the field: higherenergy stateProtons ( hydrogen nuclei) have two spin states. They actlike miniature tops and “precess” about the field direction
Spin, moment All nuclei have spin – multiples of ½ Combined with charge Î moment Nucleus with odd spin acts like a smalldipole magnet If nucleus has S spin states, the moment(magnet) has 2S 1 stable states in anexternal magnetic field Hydrogen (proton): S ½ Î 2 states
Alignment of Spins in aMagnetic FieldMmagnetic momentM 0spinWith no magnetic field,the spins are randomlyalignedB0 field
Energy in a Magnetic Field(Zeeman Splitting, Spin ½)mI ½E 1/2 γħB0/2P 1/2 0. 5000049mI ½N up1.5T, T 310K, P(E) exp( E/kT)N downE-1/2 γħB0/2P-1/2 0.4999951 γhB0 exp kT
Excess of protons aligned with field For an external magnetic field of 3T, thereare only about 10 per million more protonsparallel to the field than anti-parallel!! Nevertheless, there are millions of protons,so this is enough to give a useful magneticfield The smaller the field, the fewer the excess,the poorer the SNR – so use a very largemagnetic field
NMR – the key discoveryThe nucleus isbombarded withRadiofrequency (RF)energyAn unsuspecting lowenergy nucleusAt certain resonantfrequencies of the RFenergy, the protonflips to the highenergy stateWhen the RF energy is turned off, the newly high energynucleus may revert to its low energy state, giving off RFenergy in the process
So what?The resonant frequency at which this happens is called theLarmor frequency:ω B0 γIn this equation,γis the “gyromagnetic constant” forthe stuff that is being energisedCritically, this constant depends on the biochemical nature of the stuff and itssurroundings: Chemical ShiftA typical field strength B0 used in MRI is 1.5 TeslaAt this field strength, the Larmor frequencies ξ for Hydrogen and Carbon 13 (theatoms most relevant in medical imaging) are 63.9 MHz and 16.1 MHz respectively.Probing with different frequencies of RF energy enables us to build a spectrum ofwhat is in the sample
Exciting a spin system subject it to a short period of high intensity radiowaves at a frequencyclose to the Larmor frequencyThis is called the B1 field, orientated in a direction perpendicular to,and rotating about, the B0 field. The magnitude of B1 10-5 B0In a co-ordinate system rotating at or close to the Larmor frequency,this results in rotation of the magnetization away from the direction ofthe external magnetic fieldB1 rotates about B0B0
Applying a pulse – B1z-axisB0MzResultant magnetic field onthe voxelαM xyB1x-y planeThe longer the RF pulseis applied, and thestronger it is, the biggerthe deflection of the netmagnetic field, that is, thebigger the angle α.It can reach 90, or even180 degrees. The biggerα, the longer it takes torecover when the RF isturned off.
Free Induction DecayFTMtimefrequencyFTtimefrequency
The relaxation constant T1For the nuclei to return to their initial energy states by emittingenergy (the MR signal), the excited spin system must be exposedto an electromagnetic field oscillating with a frequency at or closeto the Larmor frequency. This process can occur by the nuclei being stimulated' by surrounding nuclei and is assumed to occur in asimple exponential mannerM z (t ) M 0 (M z (0) M 0 )e tT1T1 is called the spin-lattice relaxation timeIt corresponds to the time required for the system toreturn to 63% of its equilibrium value after it has been exposed toa 90 pulse
T1 Weighted ImagingwhitemattergreymatterContrastOptimal TR T1b ln T1a T1b T1a Optimal TR T1a T1bTR
T1 Weighted ImageT1/sR1/s-1white matter0.71.43grey matter11CSF40.251.5TSPGR, TR 14ms, TE 5ms, flip 20º
T1 RelaxationdMz(t) [Mz(t) M0]dtT1Mz(t) M0 {Mz(0) M0}exp(-t/T1)saturation–recoveryM0MzMz(0) 0tMzinversion–recoveryM0Mz(0) M0 t
The contribution of all the spins precessing around the external magneticfield B0 produces a net magnetisation M0. When a 90º RF pulse is applied,this net magnetisation is tipped onto the x,y-plane. Dephasing of the spinsresults in a quick decrease of the net magnetisation in the x,y-plane. Thedephasing is exponential and characterised by T2.
The relaxation constants T2 T2 Immediately after a pulse is applied, all of the nuclei precessaround the magnetic field in phase. As time passes, thespins begin to dephase and so the observed signal decreases. Theydo so according to:M T (t ) M T (0)e tT2T2 is called the spin-spin relaxation time T2 values are 40-200ms depending on the tissue T2 is approximately ten times smaller than T1. Different scan sequences show up differences in theserelaxation times generating what are referred to as T1, T2 orproton density (the concentration of protons) weighted images.
T2 RelaxationdMxy(t) Mxy(t)dtT2Mxy(t) Mxy(0) exp( t/T2)Mxyt
T2 Weighted ImagingEchoAmplitudegrey T2 a T2 a T2 bln T2 b Optimum TE T2 a T2 bwhiteContrastOptimum TETE
T2 Weighted ImageT2/msCSFgrey matter50080 90white matter70 801.5TSE, TR 4000ms, TE 100ms
Slice SelectiontimeGω0frequency
To image a slice of materialrequires a method of exciting onlymaterial within that slice. This isachieved by superimposing a smallspatially varying magnetic field, Gz, called a gradient field. The field isapplied in the same direction aswhile the RF pulse is applied.Recall Larmor' s equation : ω B0 γNow suppose there is a magnetic field gradient δB per metreω δω ( x ) (B0 x.δB ) γ , so knowing δB and the chemicalshift δω enables us to estimate xThree mutually orthogonal gradient coils are used to localise a nucleus inx-, y-, and z-. Normally a slice is localised (z) and then a coil pair in x,y
MRI: the Fourier TransformFFTK-space – as measured inthe MRI experimentThe medical image weinspect is the FT of k-spaceNote: motion of the subject will be local in k-space – so have a globaleffect on the image!
K-spaceEach row of k-space contains the raw data received under aparticular phase gradient, where the order in which the rows arerecorded depends on the imaging sequence used; Once all of kspace has been assembled, it is Fourier transformed (2D FFT) toobtain the image
Full k Space Coveragekykx
Only Centre of k Spacekykx
Only Edges of k Spacekykx
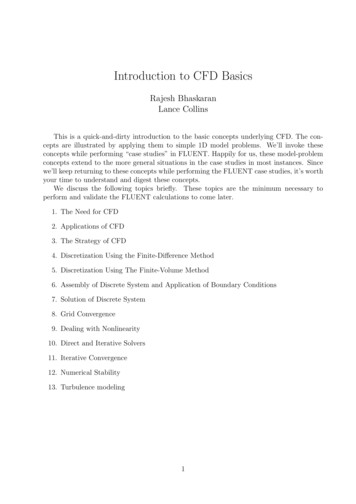
Illustration of the MR read gradient and signals generated at differentspatial locations. The illustration shows all the signals in phase whichcorresponds to the zeroth row of k-space. The material at A and D has ahigh MR signal, the material at B and C has a low signal. A andC are towards the left so have a low frequency of precession; Band D are on the right so have a higher frequency.
phase-encoding gradientsA, B and C have high, medium and low MR signals. They are at thesame x-position so have the same frequency of precession.Their y-positions are encoded by repeated scanning with different phasegradients. With a zero phase gradient (the central row), all the signals arein phase.With a positive phase gradient (the top row), A has a phase lead, and Chas a phase lag with respect to B. Recording the signals under all phasegradients allows the y-positions to be recovered by Fourier Transformingk-space.
Why Use k Space?Larmor equationν γB0x 1cmx 0x 1cmν(x,y) γB0 γGxx γGyyphase φ(x,y,t) 2π γB0dt 2π γGxxdt 2π γGyydtelemental signal δS(x,y,t) ρ(x,y) exp{i φ(x,y,t)}total signal S(t) ρ(x,y) exp{i φ(x,y,t)} dxdy
A Few SubstitutionsFrom:total signal S(t) ρ(x,y) exp{i φ(x,y,t)} dxdykx(t) γGxdtky(t) γGydtIn rotating frame:To:total signal S(t) ρ(x,y) exp{2πi(kxx kyy)} dxdyThis is the standard Fourier Equation!
A potted history of MRI 1: NMRFreq. occurrence Felix Bloch & Edward Purcell (1946) NP’52 Mostly uses oxygen and potassium nuclei – eg ATPconsumption in the heart Oxford has made massive contributions RexRichards, Walter Bodmer, George Radda, Continues for spectroscopy currently 18T systems forprotein structure (OI/Brucker) NMR says that there is a substance present in aMany of the termscompound but can’t say whereand concepts in MRIoriginate in NMR:T1 , T2 , flip angle, pulse sequence, .Molecular weight
A potted history of MRI 1973 Paul Lauterbur demonstrated MRI using the backprojection ideas introduced in CT (the same year) NP ‘03 1975 Richard Ernst introduced the modern technique kspace NP ‘91 1977 Peter Mansfield introduced EPI – basis for allmodern fast imaging & fMRI NP ‘03 1980 first whole body image, 1986 first clinical systems,1987 first research cardiac motion sequence, 1989 Siemens– OI joint venture to make superconducting magnets, 1989-1997 competitive advantage based on technologicalsuperiority; 1998 Î MR system becomes commoditized –competitive advantage based on systems integration &software
Siemens Avanto 1.5T state-of-the-art MRI machine. The Magnet Low field 0.2- 0.5T Intermediate 0.5- 1.5T High field 1.5- 4.0T Ultra high 4.0T Magnets field strength: imaging - 0.2T to 2.0T spectroscopy- 2.0T to 7.0T Earth’s magnetic field 5 10-5 Tesla. MRI System Block Diagram RF amp spectrometer r.f.coil gradient coil X amp Y amp Z amp. MRI is considered ideally suited .