Transcription
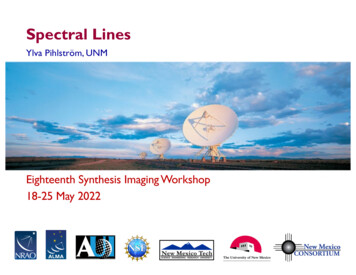
Spectral LinesYlva Pihlström, UNMEighteenth Synthesis Imaging Workshop18-25 May 2022
Outline Motivation for spectral line observations– Advantages also for continuum experiments What can affect your observations:– Instrument responses– RFI environment What to consider during observation/calibration– Bandpass, RFI and flagging– Doppler corrections– Spectral response– Continuum subtraction18th Synthesis Imaging Workshop2
IntroductionMulti-channel observations utilize n channels of width Δν, over a totalbandwidth BW nΔν. Why? Science-driven: science depends on frequency (spectroscopy)– Emission and absorption lines, and their Doppler shifts (HI, OH, H2O,SiO, CH3OH, etc.)– Slope across continuum bandwidth (spectral index) Technically driven: science does not depend on frequency– Science quality improved using multiple channels (pseudo-continuum)Most instruments today observe in multi-channel mode.18th Synthesis Imaging Workshop3
SpectroscopyAalto etal. 2015ALMAArp 220 Need high spectral resolution toresolve spectral feature(s) Many channels across a largebandwidth allows– Doppler shift determinations– Search for many transitions Detection of spectral line: need toseparate the line from thecontinuumKoch et al. 2018M33 HI18th Synthesis Imaging Workshop4
Pseudo-continuumScience does not depend on frequency, but using spectral line mode isfavorable to reduce at least some frequency dependent effects:– Bandwidth smearing– Problems due to atmospheric changes as a function of frequency– Instrumental signal transmission effects as a function of frequency– Editing for unwanted, narrow-band interference.18th Synthesis Imaging Workshop5
Bandwidth smearing: instrument responseAlso called chromatic aberration. 𝜈1 1 GHz (blue)𝜈2 2 GHz (red)Frequencies sample differentregions of the u-v plane.10021000Amplitude (mJy)Fringe spacing λ/B c/𝜈BBand coverage 𝜈2-𝜈11004998996994992990050100150200u,v (k wavelength)250300Ampl vs uv distance,VLA A-config.618th Synthesis Imaging Workshop
Bandwidth smearing: instrument responseFringe spacing λ/B c/𝜈B10041002Frequencies sample differentregions of the u-v plane.Amplitude (mJy)More important at longer wavelengthsas it scales with λ1/λ2 :- VLA 20cm, 1 GHz BW: 2.0- VLA 0.7cm, 2 GHz BW: 1.04- VLA 0.7cm, 8 GHz BW: 1.2- ALMA 3mm, 8 GHz BW: 1.08- ALMA 1mm, 8 GHz BW: 1.031000998996994992990050100150200u,v (k wavelength)250300Ampl vs uv distance,VLA A-config.718th Synthesis Imaging Workshop
Bandwidth smearing: instrument responseBand coverage 𝜈2-𝜈1 𝜈1 1 GHz (blue) 𝜈2 2 GHz (red)300200Effect more pronounced in largerconfigurations, and at lowerfrequencies.Can be utilized for multi-frequencysynthesis!100Kilo WavlngthFringe spacings change by λ1/λ2 u,v samples smeared radially0-100-200-3003002001000-100Kilo Wavlngth-200-300818th Synthesis Imaging Workshop
Instrument frequency responseResponses of antenna receiver, feed, IFtransmission lines, electronics are a functionof frequency.18th Synthesis Imaging Workshop9
Atmospheric effectsPWV Precipitable Water Vapor Atmospheric opacity is afunction of frequency,with largest effects oververy wide bandwidths ornear atmospheric lines Source emission can change with frequency too:– Spectral index, shape– Polarized emission: Faraday rotation λ2ALMA18th Synthesis Imaging Workshop10
Radio Frequency Interference (RFI) Avoid known RFI if possible, e.g., by constraining your bandwidthUse RFI plots and tables posted online for the telescopeRFI at the VLA 1-2 GHz18th Synthesis Imaging Workshop11
Example VLBA18th Synthesis Imaging Workshop12
Calibration Data editing and calibration is not fundamentally different from continuumobservations, but a few additional items to consider:–––– Presence of RFI (data flagging)Bandpass calibrationCorrelator effectsDoppler correctionsYou also might deal with a large dataset– Averaging (time) may be helpful to reduce size if needed– Flagging edges of your band18th Synthesis Imaging Workshop13
Preparation: Editing your dataMany ways to do this, here some examples: Start with identifying problems affecting all channels by using an averageddata set.– Has better signal-to-noise ratio– Can use calibrator data– Apply flag information to the full data set Continue with checking the line data for narrow-band, time-dependentRFI that may not show up in averaged data.– Channel by channel is impractical, instead identify features by usingcross- and total power spectra (POSSM in AIPS, plotms in CASA)18th Synthesis Imaging Workshop14
Example VLBA spectraScalar averaging helpsto identify RFI features Is it limited in time? Limited to specific telescopes?Plot the RFI affected channels as a function of time can be useful toidentify bad time ranges and antennas (VPLOT/plotms)18th Synthesis Imaging Workshop15
Spectral flagging Flag based on the feature SPFLG/Viewer/plotms Try avoiding excessive frequency dependent editing, since this introduceschanges in the uv - coverage across the band.18th Synthesis Imaging Workshop16
Bandpass calibration: Why?Important to be able to detect and analyze spectral features: Frequency dependent amplitude errors limit the ability of detectingweak emission and absorption lines. Frequency dependent amplitude errors can imitate changes in lineshapes. Frequency dependent phase errors can lead to spatial offsets betweenspectral features (imitating motions)For pseudo-continuum, the dynamic range of final image is affected by thebandpass quality.18th Synthesis Imaging Workshop17
Example ideal and real bandpassPhasePhaseAmplAmpIdeal RealWant to correct for the offset of the real bandpass from the ideal one(amplitude 1, phase 0).The bandpass is the relative gain of an antenna/baseline as a function offrequency.18th Synthesis Imaging Workshop18
Bandpass calibrationThe bandpass is a function of frequency and is mostly due to electronics ofindividual antennas. We need the total response of the instrument to determine the truevisibilities from the observed: Assume instrumental effects vary slowly with time– Break the complex gain Gij into a fast-varying frequency independentpart, and a slowly varying frequency dependent part:18th Synthesis Imaging Workshop19
Bandpass calibrationDifferent approaches can be taken. A common one is to generate complexresponse functions for each antenna (antenna-based) Least square method applied channel-by-channel to decompose crosspower spectra: self-cal procedure– Gives solutions for all antennas even if baselines are missing To determine Bi,j we usually observe a bright continuum source18th Synthesis Imaging Workshop20
The BP calibrator Applying the BP calibration means that every complex visibilityspectrum will be divided by a complex bandpass– Noise from the bandpass will degrade all data. A good rule of thumb is to useSNRBPcal 3 SNRtargetwhich then results in an integration time:tBPcal 9 (Starget /SBPcal)2 ttarget If long observations, include several scans of the BP calibrator in yourexperiment to account for slow time variationsGod18th Synthesis Imaging Workshop21
The BP calibrator Select a continuum source with:– High SNR in each channel– Intrinsically flat spectrum– No spectral linesGood22 Not required to be a point source, but helpful since the SNR will be the samein the BP solution for all baselinesNot good, line feature18th Synthesis Imaging WorkshopToo weak
Good quality bandpass calibrationExamples of good-quality bandpasssolutions for 2 antennas:PhaseAmp Solutions should look comparablefor all antennas Mean amplitude 1 across useableportion of the band.Phase No sharp variations in amplitudeand phase; variations notcontrolled by noiseAmp18th Synthesis Imaging Workshop23
Bad quality bandpass calibrationExamples of bad-quality bandpasssolutions for 2 antennas:PhaseAmp Amplitude has differentnormalization for differentantennasNoise levels are high, and aredifferent for different antennasPhaseAmp18th Synthesis Imaging Workshop24
Test: Apply to continuum sourceBefore accepting the BP solutions,apply to a continuum source and usecross-correlation spectrum to check: Flat phasesConstant amplitudesNo increase in noise by applyingthe BPBefore bandpass calibrationAfter bandpass calibration18th Synthesis Imaging Workshop25
Spectral response correlatorHow extract frequency informationV(u,v, 𝜈)? If we just used filter banks,visibilities V(u,v, 𝜈) could be formeddirectly. Not a versatile method.Instead use the delay methodalready introduced for geometricdelay & fringe stopping.This would then give V(u,v, 𝜏).18th Synthesis Imaging Workshop26
Spectral response: XF correlatorFor spectroscopy in an XF correlator “lags” 𝛥𝜏 are introduced– Correlation function is measured for as many lags as possible– FT gives the spectrum.We don’t have an infinitely large correlator (number of lags) and infinite amount oftime, so we don't measure an infinite number of Fourier components.A finite number or lags means a truncated lag spectrum– Corresponds to multiplying the true spectrumby a boxcar function Π(x).Π(x)– The spectral response is the FT of Π(x), which is a sinc(x)function with nulls spaced by the channel separation:22% sidelobes.18th Synthesis Imaging Workshop27
Spectral response: FX correlatorExample FX correlators: ALMA, VLBA, EVN SFXCFor FX correlators:– Time sequence of voltages FT into a spectrum– Spectra from pairs of telescopes cross multipliedSince the spectrum at each antenna formed from sample with limitedtime extent, hence also a truncated signal Total response sinc2(x) with 5% sidelobes18th Synthesis Imaging Workshop28
Spectral response example18th Synthesis Imaging Workshop29
Gibbs ringing We care about this since thisresponse introduces unwantedspectral features Produces a "ringing" in frequencycalled the Gibbs phenomenon. Occurs at sharp transitions:– Narrow banded spectral lines(masers, RFI)– Band edges18th Synthesis Imaging Workshop30
Gibbs ringingTo reduce effects, window functions can be appliedin the correlator Reduces sidelobes at the expense of main peakresolution Can also smooth in post-processing (oftenHanning window applied)18th Synthesis Imaging Workshop31
Doppler tracking/setting Observing from the surface of the Earth, our velocity with respect to astronomicalsources is not constant in time or direction.Caused by rotation of the Earth and its orbit around the SunRotation of EarthOrbiting around Sun– If not corrected, will cause spectral line to slowly drift through spectrum18th Synthesis Imaging Workshop32
Velocity frames:Correct forNothingEarth rotationEarth/Moon barycenterEarth around SunSun/planets barycenterSun peculiar motionGalactic rotationGalactic motionLocal Group motionLocal Supercluster motionAmplitude0 km/s 0.5 km/s 0.013 km/s 30 km/s 0.012 km/s 20 km/s 300 km/s 100 km/s 300 km/s 600 km/sRest frameTopocentricGeocentricE/M BarycentricHeliocentricSolar system BarycentricLocal Standard of RestGalactocentricLocal GroupVirgocentricCMBStart with the topocentric frame, then successively transform to other frames.Transformations standardized by IAU.18th Synthesis Imaging Workshop33
Doppler tracking used to be applied in real time to track a spectral line ina given reference frame, and for a given velocity definition: Make sure you have determined the correct velocity frame and definitionwhen planning your observations.18th Synthesis Imaging Workshop34
Note that the bandpass shape is a function of frequency, not velocity! Applying Doppler tracking will introduce a time-dependent andposition dependent frequency shift. If you Doppler track/set your BP calibrator to the same velocity asyour source, it will be observed at a different sky frequency!– Apply Doppler setting to the source positionMost times, we apply a Doppler setting at the beginning of the observation,and then apply additional corrections during post-processing.18th Synthesis Imaging Workshop35
Doppler corrections in post-processing Calculate the sky frequency for, e.g., the center channel of your targetsource depending on RA, Dec, rest frequency, velocity frame and definition,and time of observations (VLA has an online Dopset Tool)– Shift using cvel/cvelAmpAmpVelocityChannelBefore and after Doppler correction18th Synthesis Imaging Workshop36
Before imagingWe have edited the data and performed band pass calibration. Also, we havedone Doppler corrections if necessary.NB: CASA can do this on-the-fly in the imaging processBefore imaging a few things can be done to improve the quality of yourspectral line data: Image the continuum in the source and perform a self-calibration. Apply tothe line data:– Get good positions of line features relative to continuum– Can also use a bright spectral feature, like a maser For line analysis we want to remove the continuum, to separate out theline: continuum subtraction18th Synthesis Imaging Workshop37
Continuum subtraction Spectral line data often contains continuum emission, either from thetarget or from nearby sources in the field of view.– This emission complicates the detection and analysis of line dataSpectral line cube with twoseparate continuum sources(structure independent offrequency) and one spectral linesource.Roelfsma 198918th Synthesis Imaging Workshop38
Why continuum subtraction? Spectral lines easier to see, especially weak ones in a varying continuumfield.Easier to compare the line emission between channels.Faster to clean as most channels will be empty if continuum is removedIf continuum sources exists far from the phase center, we don’t need todeconvolve a large field of view to properly account for their sidelobes.To remove the continuum, different methods are available:visibility based, image based, or a combination thereof.18th Synthesis Imaging Workshop39
Visibility based A low order polynomial (0th, or often 1st) is fit to a group of line free channels ineach visibility spectrum, the polynomial is then subtracted from whole spectrum. Advantages:– Fast, easy, robust– Corrects for spectral index slopes across spectrum– Can implement with automatic flagging (based on residuals on baselines)– Can produce a continuum data set Restrictions:– Channels used in fitting must be line free (visibilities contains emission from allspatial scales)– Only works well over small field of view θ θB ν/ΔνtotUVLIN/uvcontsub18th Synthesis Imaging Workshop40
Restriction: small FOV15” from phase center A consequence of the visibilityof a source being a sinusoidalfunction For a source at distance l fromphase center observed onbaseline b:This is linear only over a smallrange of frequencies and forsmall b and l.15’ from phase center18th Synthesis Imaging Workshop41
Imaged based Fit and subtract a low order polynomial fit to the line free part of the spectrummeasured at each spatial pixel in cube. Advantages:– Fast, easy, robust to spectral index variations– Better at removing point sources far away from phase center (Cornwell, Usonand Haddad 1992).– Can be used with few line free channels. Restrictions:– Can't flag data since it works in the image plane.– Line and continuum must be simultaneously deconvolved.18th Synthesis Imaging Workshop42
Check your subtraction after imagingLook at spectra on/off source position:– No continuum level, flat baseline– No ‘hole’ at the position of the continuumsource in line-free channels.Flux density (mJy/bm) Velocity (km/s)18th Synthesis Imaging Workshop43
Imaging spectral line dataDeconvolution (CLEANing) will image the data and in the process it will: Remove sidelobes that could obscure faint emission Interpolate to zero spacing to estimate fluxChallenges include: Emission structure that changes from channel to channel– Try to keep deconvolution as similar as possible for all channels (samerestoring beam, clean to same depth) Large data volumes (computationally expensive)Want both: Sensitivity for faint features and full extent of emission High spectral & spatial resolution for kinematics– Averaging channels will improve sensitivity but may limit spectral resolution– Choice of weighting function will affect sensitivity and spatial resolution,Robust weighting is often a good compromise18th Synthesis Imaging Workshop44
SmoothingSmoothing your data in x, y, or z (spatial or spectral), can be done either whenmapping or in the analysis stage.Spatial smoothing Can help emphasizing large-scale structures Useful if you want to compare observations made with different beam sizes Can be done by uv ‘tapering’, or in the image domain by convolutionSpectral smoothing Can help emphasizing low SNR lines Can reduce your data size Be careful with noise propagation, adjacent channels will be correlated18th Synthesis Imaging Workshop45
Visualizing Imaging will create a spectral line cube, which is 3-dimensional: RA, Dec andVelocity (frequency). With the cube, we usually visualize the information by making 1-D or 2-Dprojections:– Line profiles(1-D slices along velocity axis)– Channel maps(2-D slices along velocity axis) ‘Movies’ can be formed from the channel maps– Moment maps(integration along the velocity axis)– Position-velocity plots(slices along spatial dimension) 3-D rendering programs also exist: CARTA18th Synthesis Imaging Workshop46
1-D line profiles325034101 5112 61278 139200331504Line profiles show changes inline shape, width and depth asa function of position.51MilliARC SEC 1010011650212708-5041349-100-15010-2005-250200 Can give information ofrelative position of features(absorption in front)1000MilliARC SEC-100-20051111662 Velocity width2127713EVN MERLIN 1667 MHzOH maser emission andabsorption spectra in aluminous infrared galaxy(IIIZw35).18th Synthesis Imaging Workshop8947
2-D channel maps Channel maps show how thespatial distribution of the linefeature changes withfrequency/velocity. Information about kinematics.Contours continuumemission, grey scale1667 MHz OH lineemission in IIIZw35.18th Synthesis Imaging Workshop48
Rotating disk model Vcir sin i cosθ Vcir sin iθ-Vcir sin i-Vcir sin i cosθ18th Synthesis Imaging Workshop49
Moment analysis You might want to derive parameters such as integrated line intensity, centroidvelocity of components and line width - all as functions of positions. Estimate usingthe moments of the line profile: Integrated intensity18th Synthesis Imaging Workshop50
Intensity weighted velocity Intensity weighted velocity dispersion18th Synthesis Imaging Workshop51
Moment 0Total intensityMoment 1Velocity fieldMoment 2Velocity dispersion Moments sensitive to noise so clipping is required Higher order moments depend on lower ones so progressivelynoisier.XMOM, MOMNT/immoments18th Synthesis Imaging Workshop52
Moment map challenges Can be demanding to interpret correctly:– Both emission and absorption may be present– Velocity patterns can create misleading moment maps– Biased towards regions of high intensity– Complicated error estimates: number or channels with real emission used inmoment computation will greatly change across the image. Use as guide for investigating features, or to compare with other ν. Alternatives ?– Gaussian fitting for simple line profiles (CASA viewer/CARTA)– “Maxmaps” show emission distribution (finding the max in each x,y pixelthrough the cube: SQASH)18th Synthesis Imaging Workshop53
Position-Velocity diagramsPV-diagrams show, for example, the line emission velocity as a function of position (RA,Dec, longitude, latitude, radius).CMZMolecular ringCarina armPerseus armOuter armCO(1-0) as afunction oflongitude in theMilky Way, fromDame et al. (2001).3kpc arm18th Synthesis Imaging Workshop54
Useful spectral line catalogsOnline databases with spectral line information: Splatalogue (VLA/ALMA/GBT): http://www.cv.nrao.edu/php/splat/ NIST Recommended Rest Frequencies ‘Lovas Catalogue’: pl JPL/NASA molecular database: http://spec.jpl.nasa.gov/ Cologne database for molecular spectroscopy: http://www.astro.unikoeln.de/cdms/18th Synthesis Imaging Workshop55
Summarizing remarksMost instruments observe in high resolution, multi-channel mode meaning Large bandwidths implying bandwidth smearing effects RFI effects: preparation of observations and removal in data Correction for atmospheric and instrumental gain variationsBetter, it also implies: Ability to reveal details of kinematics of line emission Line searches: multiple transitions can be used to derive temperature anddensity in a region.The End18th Synthesis Imaging Workshop56
18th Synthesis Imaging Workshop57
-Search for many transitions Detection of spectral line: need to separate the line from the continuum 18th Synthesis Imaging Workshop 4 Aalto et al. 2015 ALMA Arp 220 Koch et al. 2018 . God. The BP calibrator Select a continuum source with: -High SNR in each channel