Transcription
NCAT Report 20-07IMPROVEMENTS OF OPENGRADED FRICTION COURSEIN ALABAMAALDOT 930-790Don WatsonNadeem Anwer QureshiZhaoxing XieNam TranDecember 2020
Improvements of Open-Graded Friction Course in AlabamaALDOT 930-790NCAT Report 20-07ByDon Watson, PELead Research EngineerNational Center for Asphalt TechnologyAuburn University, Auburn, AlabamaNadeem Anwer QureshiVisiting ScholarNational Center for Asphalt TechnologyAuburn University, Auburn, AlabamaZhaoxing XieDoctoral CandidateNational Center for Asphalt TechnologyAuburn University, Auburn, AlabamaNam Tran, PhD, PEAssistant DirectorNational Center for Asphalt TechnologyAuburn University, Auburn, AlabamaDecember 2020ii
DISCLAIMERThe contents of this report reflect the views of the authors who are responsible for thefacts and accuracy of the data presented herein. The contents do not necessarily reflectthe official views or policies of the Alabama DOT, National Center for AsphaltTechnology, or Auburn University. This report does not constitute a standard,specification or regulation. Comments contained in this paper related to specific testingequipment and materials should not be considered an endorsement of any commercialproduct or service; no such endorsement is intended or implied.ACKNOWLEDGEMENTSThis work was sponsored by the Alabama Department of Transportation.The authors gratefully acknowledge the following members of the NCAT ApplicationsSteering Committee for their review of this technical report: Heather Hall, Tim Kowalski,Kevin McGhee, Tim Murphy, and Debbie Schwerman.iii
ABSTRACTOpen-graded friction courses (OGFC) are special purpose surface mixtures that have awide range of benefits including: Reduces the risk of hydroplaning and/or wet skidding Reduces the splash and spray of vehicle tires on the pavement Reduces pavement noise Improves the visibility of pavement markings at night Improves the visibility of pavement markings during wet weatherHowever, performance issues that lead to decreased service life, such as raveling andcracking, have hindered the widespread use of OGFC.The primary objective of this study was to evaluate the performance of OGFCpavements in Alabama and determine methods for improving durability. The scope ofthe research included field work and lab investigations. Field work involved a fieldsurvey and coring on selected projects for laboratory testing. International roughnessindex (IRI) data from the pavement management system of the Alabama Department ofTransportation (ALDOT) was analyzed to help determine the nature of distresses andidentify whether the problem was consistent throughout the pavement section orlocalized. Review of the mix design, construction data and specifications werecompleted to compare ALDOT requirements with other state DOT requirements.Laboratory testing included indirect tensile strength (IDT), Cantabro stone loss, air voids,gradation, and asphalt content of the extracted cores. Other methods for improvingOGFC performance were considered by comparing the performance of OGFC sectionson the NCAT Test Track.Results of the analyses show that in raveled portions of a project, OGFC pavements tendto have higher air voids and lower IDT strengths. IDT strength can be improved by usinga thicker OGFC layer or using a finer gradation. An increase in tack application rates foremulsion should also improve resistance to raveling and OGFC should not be placed incold weather.iv
TABLE OF CONTENTS12345678Introduction . 11.1Background . 11.2Objective . 41.3Work Plan . 4Literature Review . 52.1OGFC Mix Design Procedures . 5FHWA Mixture Design Method . 5ALDOT Mixture Design Method . 7NCAT Mixture Design Method . 7TxDOT Permeable Friction Course Design Method . 11Other State Mixture Design Methods. 12European Mixture Design Methods . 13Australian Mixture Design Method . 152.2Laboratory Performance Testing . 15PHASE 1 - Conduct Field Survey . 193.1Selection of Projects . 193.2Review of Project Records . 21Tack Coat . 21Weather Limitations . 23Laboratory Testing of Field Cores . 244.1Results and Discussion . 25Thickness Data . 25Air Void Measurements . 26Indirect Tensile (IDT) Strength . 27Asphalt Content . 29Aggregate Gradation . 29Phase 2 - Evaluation of Rejuvenator and Fog Seal Surface Treatment . 315.1Methodology . 325.2Results and Discussion . 34Micro and Macro Surface Friction Characteristics. 34Air Void Measurements . 39Cantabro Tests . 39Phase Three – Investigate Methods to Improve Durability . 406.1Comparison of NCAT Test Track Sections . 41Experimental Plan . 41Laboratory Test Results . 436.2Additional Field Sampling and Comparison Lab Testing on U.S. 80 Mixture . 46Laboratory Test Results . 47Cantabro Tests . 47Permeability Tests. 48Conclusions . 49Recommendations . 50v
References . 52LIST OF FIGURESFigure 1. Raveling in Southbound Outside Lane at Milepost 93 (near Evergreen) . 2Figure 2. Raveling in Southbound Outside Lane at Milepost 177.9 (near Prattville) . 3Figure 3. Loose Aggregate on Northbound Shoulder at Milepost 94.1 (near Evergreen). 3Figure 4. Failures on Northbound Outside Lane at Milepost 173 (Alabama River) . 4Figure 5. FHWA Test for Draindown Characteristics (FHWA, 1990) . 7Figure 6. Relationship Between SGC and 50-Blow Marshall Density . 9Figure 7. Tensile Strength after Multiple Freeze-Thaw Cycles . 10Figure 8. Project Research Plan for Projects Selected for Field Review . 16Figure 9. Hamburg Wheel Tracking Test Results . 17Figure 10. Before and After Cantabro Test Results . 18Figure 11. Location of Projects for Coring . 21Figure 12. Average Residual Application Rate on Conventional Tacked Projects . 22Figure 13. Average Residual Application Rate on Spray Paver-Laid Projects . 23Figure 14. Cold Lumps Removed From OGFC . 24Figure 15. Patched Area Where Mix Placed in Cold Weather Had Raveled . 24Figure 16. Boxplot of Project Core Thickness . 25Figure 17. Boxplot of Project Air Voids . 26Figure 18. Boxplot of Project IDT Strength . 28Figure 19. Average JMF Asphalt Content and Asphalt Content from Project Cores . 29Figure 20. Gradation of Project 2 Mixture . 30Figure 21. Gradation of Projects 1 and 5 . 30Figure 22. Gradation of Projects 3 and 4 . 31Figure 23. Design Gradation for OGFC Mixture Used in Test Sections W4 and W5 . 32Figure 24. Spray Application of Seal Material on OGFC Pavement . 34Figure 25. Graphical Comparison of Effect of Fog and Rejuvenator Seals on Mean ProfileDepth for Section W4. 35Figure 26. Graphical Comparison of Effect of Fog and Rejuvenator Seals on Mean ProfileDepth for Section W5. 36Figure 27. Graphical Comparison for Effect of Fog and Rejuvenator Seals on FrictionNumber for Section W4 . 37Figure 28. Graphical Comparison for Effect of Fog and Rejuvenator Seals on FrictionNumber for Section W5 . 38Figure 29. Percent Decrease in F60 on OGFC Sections Due to Fog and Rejuvenator Seals. 38Figure 30. Percent Specimen Air Voids Resulting from Spraying with Rejuvenator Seals 39Figure 31. Effects of Treatment Type and Application Rate on Cantabro Loss . 40Figure 32. Heavily Loaded Triple-Trailer on the NCAT Test Track . 41Figure 33. Comparison of Air Voids and Cantaboro Loss for OGFC Mixtures . 43Figure 34. Comparison of Tensile Strength Test Results for OGFC Mixtures . 44Figure 35. Field Permeameter . 45vi
Figure 36. Field Permeability Comparison . 46Figure 37. Average Hamburg Rut Depth Based on Layer Thickness . 47Figure 38. Comparison of OGFC Layer Thickness to Cantabro Stone Loss . 48Figure 39. Comparison of OGFC Layer Thickness to Permeability . 49LIST OF TABLESTable 1. FHWA Gradation Band for OGFC (FHWA, 1990) . 6Table 2. FHWA OGFC Specifications for Granular Material (FHWA, 1990) . 6Table 3. ALDOT Gradation Band for OGFC (ALDOT, 1999) . 7Table 4. NCAT Specifications for Granular Material (Mallick et al., 2000) . 8Table 5. NCAT Binder Selection Criteria (Kandhal, 2002; Mallick et al., 2000). 8Table 6. NCAT Gradation Band for OGFC (Mallick et al., 2000) . 8Table 7. NCAT Criteria for Optimum Binder Content (Mallick et al., 2000) . 9Table 8. TxDOT Specifications for Coarse Aggregate (TxDOT, 2004) . 11Table 9. Summary of OGFC Requirements for U.S. Agencies (Jackson et al., 2008) . 12Table 10. Summary of PEM Design Methods (Huber, 2000; Alveraz et al., 2006;Brousseaud et al., 2005) . 14Table 11. Australian Design Parameters for Porous Pavements (AAPA, 2004) . 15Table 12. Projects Selected for Review . 20Table 13. Materials Used and Condition of Projects for Coring . 20Table 14. Comparison of Tack Application Ranges for OGFC . 23Table 15. Important ANOVA Estimated Statistics of Project Core Thickness . 26Table 16. Important ANOVA Estimated Statistics of Project Air Voids. 27Table 17. Important ANOVA Statistics of Project Tensile Strength . 29Table 18. Layout of Test Sections for Evaluating Fog and Rejuvenator Seals . 33Table 19. ANOVA Statistics for Analysis of Effect of Fog and Rejuvenator Seals on MPDfor Section W4 . 36Table 20. ANOVA Statistics for Analysis of Effect of Fog and Rejuvenator Seals on MPDfor Section W5 . 36Table 21. Mixes Used in the Study . 42Table 22. Design Aggregate Gradations for OGFC Mixtures . 43vii
Watson, Qureshi, Xie, Tran1INTRODUCTIONAn open-graded friction course (OGFC) asphalt mixture is designed to be waterpermeable and is normally placed on top of traditional dense-graded pavement. OGFC isa special purpose thin surface mixture (Cooley et al., 2000) used to: Reduce the risk of hydroplaning, Reduce wet-weather skidding, Reduce splash and spray when driving in the rain, Reduce pavement noise, Improve night and wet-weather visibility of pavement markings, and Provide better friction surfaces during wet weather.OGFC offers numerous benefits to the environment in terms of sound absorptionpotential and pollution control (Hamzah et al., 2010). OGFC has helped to reducepollution by enhancing road water surface runoff, thereby reducing harmful metaldischarge into the environment (Pagotto et al., 2000; Boheman et al., 2003). OGFC isalso effectively used in storm water drainage and parking lots (Boving et al., 2007;Martin et al., 2007).OGFC mixtures are frequently used as surface layers in countries like the United States,Japan, United Kingdom, Malaysia, Australia, New Zealand, and South Africa on highspeed roadways and interstate expressways (Huber, 2000; Alvarez et al., 2006). OGFC isalso recommended to be used as surface course on airport pavements (Cooley, 2007).1.1BackgroundThe Alabama Department of Transportation (ALDOT) has customarily used OGFC as thefinal riding surface on interstate and high traffic volume roadways. The OGFC mixtureprovides several benefits due to water drainage such as reduced hydroplaning, reducedsplash and spray, and improved visibility. However, some pavement sections that weresurfaced with OGFC have experienced premature failures that may threaten its use as asurface course in Alabama.ALDOT has experienced premature failures in several of its construction divisions. Mixeson those projects are raveling out after only six to eight years. In contrast, it is reportedthat ALDOT's spray paver-placed OGFC surfaces are lasting more than 10 years (onextremely high traffic volume roadways). Industry representatives have contended thatthe problem with OGFC performance in the past was that the former placement rate (70lbs/yd²) was not thick enough. However, less than satisfactory performance has alsobeen experienced on some projects with a rate more than 90 lbs/yd².Raveling at transverse joints is an issue on some OGFC projects. At plant start-up, thereis usually some time required for all the metal of the plant and roadway equipment tobe heated up and production temperatures to be stabilized. One good practice toimprove transverse joint construction is to begin with the third or fourth load of mix,which is more likely to be at a consistent temperature than the first load produced.Transverse raveling may also be a result of paver stops waiting on truckloads of mix. To1
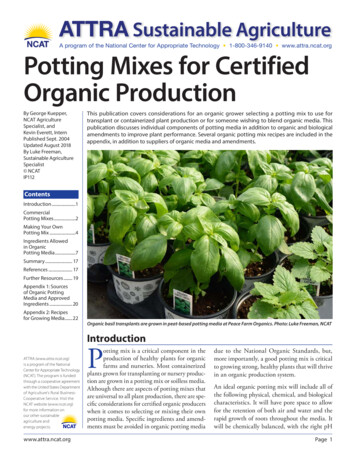
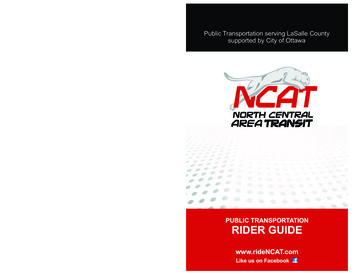
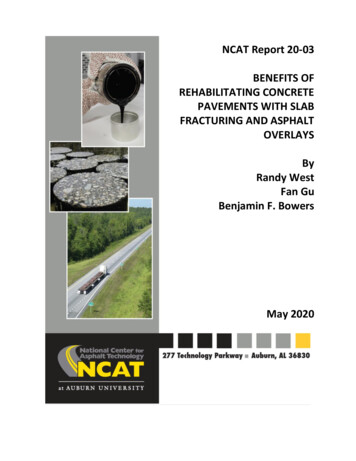
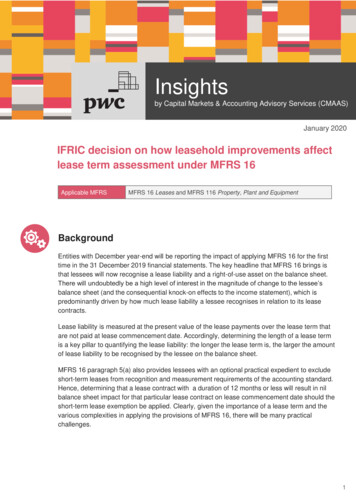
Watson, Qureshi, Xie, Tranprevent this, make sure mix placement is a continuous operation and require thecontractor to take corrective action if paver stops are encountered.Several pavement sites were visited on I-65 that exhibited severe failures. Althoughsurface distress was evident in all lanes, the severe failures were more predominant inthe outside lanes in both the southbound and northbound directions. The types offailure were visually identified and placed in three categories: Raveling from the top downward; Raveling completely through the layer; and Combined failure distresses.Significant loss of coated aggregate from OGFC (raveling) that appears to be from thetop downward is consistent with wear from high traffic volumes, moisture damage, andinsufficient asphalt particle coating. An example of this type failure is shown in Figure 1.Figure 1. Raveling in Southbound Outside Lane at Milepost 93 (near Evergreen)Raveling that extends completely through the surface layer to the interface of theunderlying layer, as shown in Figure 2 and Figure 3, may be associated with a lack oftack bond strength or insufficient internal cohesive strength. Such distress may be dueto an insufficient amount of tack coat, improper application of tack, or failure toadequately clean the surface prior to application of tack. The raveling may also be aresult of inadequate binder content and use of a coarse gradation with little to no fines.Figure 4 (a) and 4(b) show pavement failures at milepost 173 northbound, which is nextto a bridge at the Alabama River. The distress evident on the pavement surface suggeststhat the failure is a combination of raveling in the OGFC and cracking caused by2
Watson, Qureshi, Xie, Traninsufficient support from the underlying layers. The lack of support may be caused bymoisture damage in subsurface layers or structural base failure.Figure 2. Raveling in Southbound Outside Lane at Milepost 177.9 (near Prattville)Figure 3. Loose Aggregate on Northbound Shoulder at Milepost 94.1 (near Evergreen)3
Watson, Qureshi, Xie, Tran(a)(b)Figure 4. Failures on Northbound Outside Lane at Milepost 173 (Alabama River)The current maintenance practices of OGFC pavements are also not yielding effectiveresults. The application of fog and rejuvenator seals, or the lack thereof, could be one ofthe possible causes for this issue.1.2ObjectiveThe purpose of this research study was to improve the durability of OGFC pavements inAlabama. A three phase research plan was conducted to accomplish the studyobjectives. In the first phase, five OGFC pavements located in Alabama were evaluated usingfield work and lab investigations. In the second phase, the effect of using fog and rejuvenator seals on the surfacefriction and durability of OGFC was assessed with the aim of recommending anoptimal application rate. In the third phase, laboratory performance tests were conducted to evaluate thedurability of OGFC mixtures.1.3Work PlanThis research study was conducted by performing a literature review to determineavailable OGFC mix design procedures currently used by ALDOT and others, conductinga field survey to determine the cause of failure on selected projects, and evaluatinglaboratory test procedures that may lead to improved performance by making revisionsto the mix design procedure.Field work involved a field survey and coring on selected projects for forensicinvestigation. The mix design, construction data, and specifications were reviewed tocompare ALDOT requirements with other state DOT requirements. Laboratoryinvestigation of field cores included measurement of layer thickness, indirect tensile(IDT) strength, air voids, gradation, and the asphalt binder content of extracted cores.OGFC pavement thickness and gradation were believed to be important factors in thelong-term performance of OGFC mixtures so comparisons were made of OGFC sections4
Watson, Qureshi, Xie, Tranon the NCAT Test Track, which included coarse and fine gradations and differentcombinations of binder modifier and fiber stabilizer. The performance tests includedpermeability, Cantabro stone loss, Hamburg wheel tracking tests, and IDT strength tests.22.1LITERATURE REVIEWOGFC Mix Design ProceduresOGFC was introduced in the United States in the 1940s, but it was slow to beimplemented until the development of an OGFC design method by the Federal HighwayAdministration (FHWA) in 1974 (Smith et al., 1974). This method was adopted by anumber of states for the design of OGFC mixtures; however, problems such as raveling,stripping, draindown, and short service life forced state agencies to abandon theirshortly afterward. During the same period, OGFC mixtures were used successfully inEurope and Japan because those were placed in thicker lifts, had coarser gradations,higher air voids, and stabilizers such as fibers were used to control drain down. FHWAincorporated several modifications to the earlier versions of OGFC mix design andrevised the mix design method in 1990. Some state agencies developed their ownmixture design procedures that included a combination of the 1990 design method andexperiences of Europe regarding OGFC mixtures.When the Superpave mix design method was introduced and state agencies startedadopting this technology for design of dense-graded mixtures, there was a need toincorporate the technology into the OGFC mix design method. The National Center forAsphalt Technology (NCAT) developed an OGFC mix design method based oncomprehensive research along with European and state agency experiences (Kandhal,2002). The method incorporated the Superpave specifications into the OGFC mix designmethod. This method was further refined by NCAT in 2004 and has been adopted by anumber of state agencies with some modifications (Watson et al., 2003; Watson et al.,2004).Some state agencies have sponsored research projects to develop their own OGFCspecifications and design methods. For example, the Texas Department ofTransportation (TxDOT) developed a procedure for designing OGFC in 2005 andincorporated further refinements for achieving durability in 2008 (Alveraz et al., 2006;Estakhri et al., 2008). ASTM has incorporated an OGFC design procedure in ASTMstandard D7064/ D7064M Standard Practice for Open-Graded Friction Course (OGFC)Mix Design, which is almost the same as the NCAT method of OGFC design with minorvariations.FHWA Mixture Design MethodFHWA developed a mix design method for OGFC in 1974, revised it in 1990, andpublished a technical advisory T5040.31: Open Graded Friction Courses (FHWA, 1990).Both the original and revised design methods are based on the Marshall mix designprocedures with a 12.5 mm maximum sieve size and include four design steps:1. Estimating surface capacity of predominate aggregate fraction and optimumasphalt content;5
Watson, Qureshi, Xie, Tran2. Selecting gradation;3. Selecting optimum mixing temperature; and4. Evaluating mixture resistance to moisture susceptibility.The first step is to estimate the surface capacity of the predominate aggregate fraction(passing the 9.5 mm (3/8 in.) sieve and retained on the 4.75 mm (No. 4) sieve) byimmersing and draining the aggregate in S.A.E. No. 10 lubricating oil. The asphalt bindercontent is calculated using the surface constant value estimated from the percentageretained lubricating oil and the apparent specific gravity of the aggregate fraction.The second step is to calculate the fine aggregate percentage of total aggregate (byweight) by taking into consideration the asphalt binder content and target air voidcontent (15%). If the air voids content at the selected asphalt binder content is not 15%or higher, the gradation of the predominant aggregate fraction should be modified. Therecommended gradation band is given in Table 1. The recommended grade of asphaltbinder was an AC-20. Table 2 gives granular material specifications. Specificationsregarding mineral filler are flexible and can be modified according to local requirements.Table 1. FHWA Gradation Band for OGFC (FHWA, 1990)Sieve Size, mm (in)12.5 (1/2)9.5 (3/8)4.75 (No. 4)2.36 (No. 8)0.075 (No. 200)Passing by Weight (%)10095-10030-505-152-5Table 2. FHWA OGFC Specifications for Granular Material (FHWA, 1990)ParameterLos Angeles abrasion, %, maxFractured faces, one face, %, minFractured faces, two faces, %, minMineral filler’s specificationsSpecified Value409075AASHTO M 17 or state standardThe third step is to establish the optimum mixing temperature by conducting a Pyrexglass plate test and keeping in view the draindown potential. This test can be conductedby spreading approximately 1000 grams of coated aggregate under specified conditionson a Pyrex glass plate (8 to 9 inches in diameter). The bottom of the glass plate isobserved after 60 minutes. A slight puddle of asphalt at the points of contact betweenaggregate and glass plate is desirable, as shown in Figure 5; otherwise, the test isrepeated at a higher or lower temperature. Several agencies use this draindown test toestablish optimum asphalt content. In that case, the mixing temperature is heldconstant and the binder content is adjusted until the desired amount of draindown isobtained.The last step is to evaluate the mixture’s resistance to moisture susceptibility by theimmersion-compression test (AASHTO T 165, Effect of Water on Cohesion of CompactedBituminous Mixtures, and T 167, Compressive Strength of Bituminous Mixtures).6
Watson, Qureshi, Xie, TranNo DraindownDesired DraindownExcessive DraindownIncrease Mixing TempOptimum Mixing TempDecrease Mixing TempFigure 5. FHWA Test for Draindown Characteristics (FHWA, 1990)ALDOT Mixture Design MethodALDOT-259-97 “Open-Graded Asphalt Concrete Friction Course Design Method” is basedon the FHWA method with differences in gradation band, sample compaction method,and moisture susceptibility testing. This method was last revised in 1999. Therecommended gradation band is given in Table 3 with a maximum aggregate size of19.0 mm. A vibrating table or vibrating rammer operating at 3600 cycles per minute isused to compact samples for determining the void capacity of coarse aggregate.Optimum binder content is based on a surface constant determined using the oilabsorption test performed in the FHWA procedure.Table 3. ALDOT Gradation Band for OGFC (ALDOT, 1999)Sieve Size, mm (in)19 (3/4)12.5 (1/2)9.5 (3/8)4.75 (No. 4)2.36 (No. 8)0.075 (No. 200)Passing by Weight (%)10085-10055-6510-255-102-4All moisture susceptibility samples are compacted in a Superpave gyratory compactor(SGC) using 100 gyrations. Moisture susceptibility of the designed mixtures is checkedusing the modified Lottman method with no vacuum saturation or freeze/thaw cycleconditioning. The retained tensile strength of OGFC samples should be 80% forsuccessful design.NCAT Mixture Design MethodNCAT developed a comprehensive method for designing OGFC mixtures in 2000 (Mallicket al., 2000). This method was based on different approaches used in the United States,European methods, and additional research. This method was refined in 2005 toincorporate additional information. The method includes the following steps fordesigning an OGFC mixture (Kandhal, 2002):7
Watson, Qureshi, Xie, Tran1.2.3.4.Selection of materials;Selection of design gradation;Determination of optimum asphalt content; andEvaluation for moisture susceptibility.The first step is to select granular materials and a binder. Table 4 and Table 5 show thecriteria for selecting granular materials and binders, respectively. PG 76-22 binder istypically used in southern parts of the U.S. and PG 70-28 used in colder, northernregions of the U.S.Table 4. NCAT Specifications for Granular Material (Mallick et al., 2000)ParameterLos Angeles abrasion, %, maxFractured faces, one face, %, minFractured faces, two faces, %, minFlat and elongated particles, ratios of 3:1, %, maxFlat and elongated p
National Center for Asphalt Technology Auburn University, Auburn, Alabama Nam Tran, PhD, PE Assistant Director National Center for Asphalt Technology . Raveling in Southbound Outside Lane at Milepost 177.9 (near Prattville) . 3 Figure 3. Loose Aggregate on Northbound Shoulder at Milepost 94.1 (near Evergreen). 3 Figure 4. Failures on .