Transcription
Report No. CDOT-DTD-96-11DETERMINING the DEGREE of AGGREGATEDEGRADATION After Using the NCAT ASPHALTCONTENT TESTER.Randolph ReyesColorado Department of Transportation4201 East Arkansas AvenueDenver, Colorado 80222Final ReportAugust 1997Prepared in cooperation with theU.S. Department of TransportationFederal Highway Administration
The contents of this report reflect the views of the author who is responsiblefor the facts and the accuracy of the data presented herein. The contents donot necessarily reflect the official views of the Colorado Department ·ofTransportation or the Federal Highway Administration. This report does notconstitute a standard, specification, or regulation.
The author would like to express his gratitude to the COOT Research Panelwhich provided many excellent comments and suggestions for this study; itincluded Donna Harmelink (COOT Research), Robert LaForce (COOT FlexiblePavement), Tim Aschenbrener (COOT Staff Materials), Ken Wood (COOTRegion 4 Materials), Cindy Price (Region 1 Materials), R.J. Hinojosa (Region 6Materials), Chuck McGarvey (Region 2 Materials), Charlie MacKean (COOTStaff Materials) and Paul Macklin (COOT Geotechnical Section).II
REPORT DOCUMENTATION PAGEFORM APPROVEDOMB NO, 0704-0188Public reporting burden for this collection of information is estimated to average 1 hour per response, including the time for reviewing instructions, searching existing data sources,gathering wd maintaining the data needed , and completing and reviewing the collection of information, Send eomments regarding this burden estimate or any other aspect of thiscollection of information, including suggestions for reducing this burden, to Washington Headquarters Services, Directorate for Information Operations and Reports, 1215 JeffersonDavis HW:wav. Suite 1204, Arlinltton VA 22202-4302 and to the Office of ManaJtement and Budllet Paoerwork Reduction Pro'eet (0704-0188), Washinllton. DC 20503.1. AGENCY USE ONLY2. REPORT DATE(Leave Blank)3. REPORT TYPE AND DATES COVEREDFinal ReportAugust 19974. TITLE MiD SUBTITLE5. FUNDING NUMBERSDetermining the Degree of Aggregate Degradation After Using the NCAT Asphalt Content Tester6. AUTHORS(S)Randolph Reyes7. PERFORMING ORGA:'lIZATION NAME(S) AND ADDRESS(S)8. PERFORMING ORGANIZATIONColorado Department of TransportationREPORT NUMBERCDOT-DTD-R-96-114201 E. Arkansas Ave.Denver, Colorado 802229. SPONSORINGIMONITORING AGENCY NAME(S) AND ADDRESS(S)10. SPONSORINGIMONITORINGColorado Department of TransportationAGENCY REPORT NUMBER4201 E. Arkansas Ave.Denver, Colorado 8022211. SUPPLEMENTARY NOTESPrepared in Cooperation with the U. S. Department of Transportation, FederalHighway Administration12a. DIS1RIBUTION/AVAILABILITY STATEMENT12b. DISTRIBUTION CODENo Restrictions: This report is available to the public through the·4'.: lrl VA 22161N tion::ll Technical Information Service. ['.13. ABSTRACT (Maximum 200 words)The purpose of the research conducted was to determine if aggregate degradation takes place and tomeasure the possible degree of degradation after bituminous mixtures are heated inside the NCAT AsphaltContent Tester. A study was conducted which compared the orginal aggregate blend (Control specimens)to the residual aggregate blend (Experimental specimens) obtained after several bituminous mixtures wereheated inside the NCAT Asphalt Content Tester. The Control specimens and the Experimental specimensused to produce the bituminous mixtures were the result of an aggregate sample which was split threetimes. Two methods of analysis were used to review the gradation results. It was determined afterreviewing both methods of analysis, that the gradations of the bituminous mixtures used in the study werenot statistically different after being heated inside the NCAT Asphalt Content Tester. The aggregategradation correction factors that were required in this study were relatively low (less than one percent) andwere needed only in a few instances. However, this might not be true in all instances.14. SUBJECT TERMS15. NUMBER OF PAGESignition oven, aggregate degradation, gradation, degradation, ignition furnace12816. PRICE CODE17. SECURITY CLASSIFICATIONOF REPORTUnclassified18. SECURITY CLASSIFICATION19. SECURITY CLASSIFICATIONOF ABSTRACTOF THIS PAGE. UnclassifiedUnclassifiedIII20. LIMITATION OF ABSTRACT
TABLE OF CONTENTS1.0 INTRODUCTION.11.1 Background . . . . . . . . . . . . . . . . . . . . . . . . . . . . . . . . . . . . . . .12.0 PURPOSE .33.0 APPARATUS .43.1 NCAT Asphalt Content Tester . . . . . . . . . . . . . . . . . . . . . . . . . . .43.2 Basket Assemblies . .43.3 Asphalt Mixer and Mixer Bowl . . . . . . . . . . . . . . . . . . . . . . . . . . .53.4 External Scale .53.5 No. - 200 Wash Sieve Screen . . . . . . . . . . . . . . . . . . . . . . . . . . .53.6 Set of Nine 203.2 mm (S inch) Diameter Sieves. . . . . . . . . . . . .53.7 Set of Three 304.Smm (12 inch) Diameter Sieves .53.S Riffle Sample Splitter . . . . . . . . . . . . . . . . . . . . . . . . . . . . . . . . .63.9 Miscellaneous Equipment . . . . . . .64.0 PROCEDURE .74.1 Sources of Aggregate . . . .74.2 Aggregate Set Up .94.3 Separating and Splitting Aggregate . . . . . . . . . . . . . . . . . . . . . . .9IV
4.4 Combining with Hydrated Lime and Water .94.5 Treatment of Control Specimens . . . . . . . . . . . . . . . . . . . . . . . .104.6 Rational for Mixing the Experimental Specimens with AC.104.6.1 Treatment of Experimental Specimens .114.7 Gradations . . . . . . . . . . . . . . . . . . . . . . . . . . . . . . . . . . . . . . . . . .114.8 Methods of Analysis . . .124.B.1 First Method of Analysis (Comparison of the Mean ofthe Experimental and Control Specimens) . . . . . . . . . .124.B.2 Second Method of Analysis (One-to-One Comparisonbetween Experimental and Control Specimens).135.0 GRADATION RESULTS AND DiSCUSSiON.155.1 Analysis Method One (Aggregate Gradation Results)155.1.1 Mean Differences Between the Control andExperimental Specimens Illustrated for theFranciscotti Aggregate Source.165.1.2 Confidence Interval Figure Displaying the Upper andLower Limits for the Franciscotti Aggregate Source185.1.3 Frequency Distribution Illustrating the MeanDifferences for the 9.5 mm (3/B) Sieve Size .205.1.4 Frequency Distribution for the 54 Sieve Tests .225.1.5 Experimental Specimens that Appeared Coarser afterUsing the NCA T Asphalt Content Tester .v25
5.1.6 Summary of Results Using Analysis Method One. . . . .255.2 Analysis Method Two- Aggregate Gradation Results .275.2.1 AASHTO T 27 Precision (Single Operator) .275.2.2 (Experimental - Control) Data Minus AASHTO T 27(Single Standard Deviation Data) . .345.2.3 Control Data Minus AASHTO T 27 (Single StandardDeviation Data) . .365.2.4 (Single Standard Deviation Data, Figure 8) . .385.2.5 Summary of Results Using Analysis Method Two. .40. . . .415.3.1 Testing for the Possibility of Aggregate Degradation .415.3 Application of Correction Factors5.4 Aggregate Absorption Values436.0 CONCLUSION . .456.1 Analysis Method One . 456.1.1 Mean Differences Between The Experimental andControl Specimen Gradations .456.1.2 Experimental Specimens that Appeared to be Coarserafter Using the NCA T Asphalt Content Tester . . . . . . .456.1.3 Possible Reasons for the Variation in GradationResults . . . . . . . . . . . . . . . . . . . . . . . . . . . . . . . . . . . . . .466.1.4 Student's t-test .466.1.5 Summary of Analysis Method One .46VI
6.2 Analysis Method Two (One to One Comparison) . . . . . . . . . . . .476.2.1 (Experimental - Control) Data Minus AASHTO T 27Gradation Data (Single Standard Deviation) . . . . . . . . .476.2.2 Control Data Minus AASHTO T 27 Gradation Data(Single Standard Deviation) .6.2.3 Figure 8 (Single Standard Deviation)47.486.3 Absorption Values . . . . . . . . . . . . . . . . . . . . . . . . . . . . . . . . . . .486.4 Summary of Analysis Methods One and Two .497.0 RECOMMENDATION. . . . . .508.0 FUTURE RESEARCH . . . . .519.0 REFERENCES . . .52VII
LIST OF TABLESTable 1. Aggregate Source, Absorption, Mineralogy, Specific Gravity andLocation .8Table 2. Number of Gradations Performed per Sieve Size .12Table 3. Data used to generate Figure 4. . .24Table 4. Precision Statement from AASHTO T 27 . . . . . . . . . . . . . . . . . . .29Table 5. Percent of Aggregate Passing One Sieve and Retained on theNext Finer Sieve for Each Aggregate Source .VIII31
List of FiguresFigure 1. Mean Differences Illustrated For Each of the Nine Sieve SizesRepresenting The Franciscotti Aggregate Source . . . . . . . . . . . . . .17Figure 2. Confidence Intervals Representing the Upper and Lower LimitsFor The Franciscotti Aggregate Source . . .19Figure 3. Frequency Distribution Displaying The Mean DifferencesRepresenting The 1.18 mm (# 16) Sieve . . .21Figure 4. Frequency Disbibution Of Tbe Mean Differences For 54 SieveTests . . . . . . . . . . . . . . . . . . . . . . . . . . . . . . . . . . . . . . . . . . . . . . . . .23Figure 5. Summary of the Gradation Results (Mean Differences,Analysis Method One) . . . . . . . . . . . . . . . . . . . . . . . . . . . . . . . . . .26Figure 6. (Experimental - Control Data) Minus AASHTO T 27 (SingleStandard Deviation Data) . . . .35Figure 7. Control Data Minus AASHTO T 27 (Single Standard DeviationData) .II . . . .37Figure 8. Difference Between Figure 6 and Figure 7 (Single StandardDeviation) . . . . . .39Figure 9. Absorption Values for Each Aggregate Source . . . . . . . . . . . .44IX
List of AppendicesANALYSIS METHOD ONEAPPENDIX A:1. Mean Difference Figures for Aggregate Sources2. Data Used to Calculate Mean DifferencesAPPENDIX B:1. Confidence Interval Figures for Each Aggregate Source2. Data Used To Calculate the 95% Confidence Interval Figures3. Data From the Students t-Test4. Gradation Results From Each Aggregate SourceAPPENDIX C:1. Frequency Figures for Each Sieve Size2. Data Used to Calculate Frequency FiguresANALYSIS METHOD lWOAPPENDIX D: DATAAPPENDIX E: CPL-5120x
1.0 INTRODUCTIONThe United States Environmental Protection Agency (EPA) is phasing outchlorinated solvents used in the United States. These solvents have beenused in the past to remove the asphalt cement (AC) from bituminous mixturesallowing aggregate gradations to be performed. The NCAT Asphalt ContentTester (an ignition oven) has been introduced as an alternative to the solventextraction method. It works by removing (physically burning away) the ACfrom the bituminous mixture.Several companies manufacture ignition ovens, includingBarnsteadlThermolyne, Troxler, and Gilson Corporation. TheBarnstead/Thermolyne equipment is known as the National Center for AsphaltTechnology (NCAT) Asphalt Content Tester and was used to generate the datain this paper. The ignition oven and the NCAT Asphalt Content Tester refer tothe same equipment in this document.1.1 BackgroundIn June of 1995, the Colorado Department of Transportation purchased andreceived six NCAT Asphalt Content Testers manufactured byBamstead/Thermolyne Corporation. The Central Laboratory located in1
Denver, Colorado retained two of the ovens and distributed the remaining fourovens to different Regions throughout Colorado. One oven in the CentralLaboratory was set up (electrically wired and vented) for use. The NCATAsphalt Content Tester was then evaluated concerning its effect on aggregategradations from different bituminous mixtures.2
2.0 PURPOSEThe purpose of this experiment was to detennine if aggregate degradationoccurs in a bituminous mixture when heated inside the NCAT Asphalt ContentTester. In addition, if aggregate degradation does occur, to quantify theextent of the degradation.3
3.0 APPARATUS3.1 NCAT Asphalt Content Tester-- The NCAT Asphalt Content Tester is aforced-air ignition furnace, with internal balance, capable of maintaining atemperature of 538 0 C (1000 0 F). The NCAT Asphalt Content Tester consistsof an electronic housing unit, an oven chamber and an exhaust chamber. Theelectronic housing unit is located underneath the oven chamber and isseparated by an air space. This area of the unit houses the electroniccontrols as well as the internal scale used to monitor weight loss. The ovenchamber is located in the middle of the unit. The oven chamber is heatedelectrically using ceramic heating elements. A hearth tray located inside theoven chamber is supported by ceramic tubes which extend down to theinternal scale. The accuracy of the internal scale balance is verified byplacing calibrated weights on the hearth tray at room temperature. Theexhaust chamber is located above the oven chamber. An exhaust fan andfilters are used to control the smoke and fumes while testing.3.2 Basket Assemblies--Two stainless steel 2.36mm (No.8) mesh perforatedbasket assemblies were nested on top of each other with a drip pan locatedon the bottom of the assembly. This configuration allowed the bituminousmixture increased surface area exposure and facilitated more completeburning of the AC.4
3.3 Asphalt Mixer and Mixer Bowl··A HOBART mechanical mixer (Model N50)with an approximate capacity of 5 liters and capable of mixing approximately1250 grams of aggregate.3.4 External Sea/e.·An AND 20 kg capacity scale accurate to 0.1 gram wasused in this experiment.3.5 No. - 200 Wash Sieve Screen·-A 304.B mm (12 inch) diameter 0.075 mm(No. 200) sieve was used to wash the minus 0.075mm (No. 200) material fromthe Experimental and Control specimens before performing the subsequentgradation analysis on the remaining aggregate.3.6 Set of Nine 203.2 mm (8 inch) Diameter Sieves·-A set of sieves having a203.2 mm (B inch) diameter, with sieve openings conforming to ASTM E-11.The sieve sizes used were: 12.5 mm, (1/2 inch); 9.5 mm, (31B inch); 4.75 mm,(No.4); 2.3 mm, (No.B); 1.1B mm, (No.16); 0.625 mm, (No.30); 0.3 mm, (No.50);0.15 mm, (No.100): and 0.075 mm, (No.200). A ROTAP mechanical sieveshaker (Model RX-29) was used to separate the aggregate into differentparticle sizes.3.7 Set of Three 304.Bmm (12 ineh) Diameter Sieves--A set of three 304.B mm(12 inch) diameter sieves with screen sizes of 9.5 mm ( 31B inch), 4.75 mm5
( No.4) and - 4.75 mm (- No.4) were used to separate the aggregate intothree different particle sizes prior to using the riffle sample splitter.3.8 Riffle Sample Splitter--A sample splitter with 12, 37.5 mm (1 1/2 inch) equalwidth chutes was used to split the aggregate. Four chute catch pans wereused.3.9 Miscellaneous Equipment--A pan having dimensions of approximately (L xW x H) 38 x 38 x 5 cm was used for containing the residual aggregate afterignition. A steel wire brush was used to remove residual aggregate from thesteel basket assembly after AC burn off.6
4.0 PROCEDURE4. 1 Sources of AggregateSix aggregate sources were selected from various geographical areas whichrepresented some of the varying aggregate types found within Colorado.7
Table 1. Aggregate Source, Absorption, Mineralogy, Specific Gravity G% ranciscotti0.9, N/ASandstone2.66, 2.59ShaleRalston0.72, 1.03QuartzWalsenburg2.77, 2.75Denver2.62, 2.61Colo.DioriteVal co/Rocky0.9, 0.8Mtn.lCasIrwin Windsor-DecomposedGranite0.8, 0.4FeldsparSprings2.61, 2.66StuteFortCollinsMonk0.8, N/AGranite2.64, N/ALimonPagosa Trout2.1, 1.7N/A2.54, 2.51PagosaSpringsLakes8
4.2 Aggregate Set UpSix different (10000 gram) aggregate sources of grading CX, 12.5 mm (1/2inch) nominal maximum, were set up together using six different aggregateblend formulas.4.3 Separating and Splitting AggregateIn a attempt to reduce segregation, the 10K gram samples were separated intothree different sieve sizes, 9.5 mm ( 3\8), 4.75 mm ( No.4) and - 2.36 mm(- No.4) using three 304.8 mm (12 inch) diameter sieves. The three differentsizes of aggregate were split individually three times using a riffle samplesplitter. The aggregate from each of the three sieve sizes were combinedwhich resulted in eight specimens of approximately 1250 grams each. Thismethod was used to increase the probability for an even split when the largeraggregate sizes were dropped through the riffle sample splitter. To furtherreduce the margin of error between specimens, the four Control and fourExperimental specimens were collected from alternate sides of the samplesplitter.4.4 Combining with Hydrated Lime and Water9
All eight (approximately 1250 gram) aggregate specimens from each of the sixaggregate sources were mixed with one percent hydrated lime andapproximately four percent water, oven dried inside a 121 5 C (250 F) ovenfor 6 1 hours and then cooled to room temperature. Removing the moisturewas important since aggregates that have high absorption values may retainmoisture which may cause the aggregate to "pop" (break apart changing thegradation) inside the NCAT Asphalt Content Tester.4.5 Treatment of Control SpecimensThe Control specimens were stored on a shelf at room ambient temperatureand humidity until gradations could be performed as described in Section 4.74.6 Rational for Mixing the Experimental Specimens with ACMixing the aggregate specimens with asphalt cement was thought to be animportant factor since these specimens would be exposed to highertemperatures (greater than 538 C (1000 F» inside the ignition oven(compared to aggregate only specimens) as the asphalt cement bums.Aggregate mixed with asphalt typically burns in the oven at 600 C (1112 F)to 700 C (1292 F). These higher temperatures may increase the probabilitythat the aggregate degrades. In addition, the aggregate which will be10
evaluated for gradation during the life of construction projects will also bemixed with asphalt cement when determining asphalt cement content.4.6.1 Treatment of Experimental SpecimensThe four Experimental specimens were re-heated again inside a 148 /- 50 C(300 0 F) oven for 3 1 hours and mixed with approximately five percent AC,(Conoco AC-10).The bituminous mixture specimens were placed inside the NCAT AsphaltContent Tester (at a set point temperature of 538 0 C (1000 0 F» immediatelyafter the mixing process and tested per CPL-5120, see Appendix E. The AC inthe bituminous mixture was ignited and burned away leaving the residualaggregate. The residual aggregate was cooled for approximately one-halfhour inside the basket assembly and then collected in a steel pan. TheExperimental specimens were stored on a shelf (less than 24 hours) untilgradations could be performed per Section 4.74.7 GradationsGradations following AASHTO T 27 (Sieve Analysis of Fine and CoarseAggregates) and T 11 (Amount of Material Finer Than 0.075 mm Sieve inAggregate) were performed on each of the eight specimens from each of the11
six aggregate sources. A ROTAP mechanical sieve shaker was used asdescribed in Section 3.1, to separate the aggregate into different sizefractions.Table 2. Number of Gradations Perfonned per Sieve SizeSieve SizeEach of thenine sievesizesNo. ofControlSpecimensPerAggregateSource4No. of Exp.SpecimensPerAggregateSource4No. ofAggregateSourcesTotal No. ofGrad. PerSieve Size6484.8 Methods of AnalysisThere were two methods used to analyze the gradation results after using theignition oven.4.8.1 First Method of Analysis (Comparison of the Mean of the Experimentaland Control Specimens)12
The first method of analysis compared the mean of the gradations betweenthe four Experimental and four Control specimens. The "mean difference" forthe percent passing each sieve size for each aggregate source was calculatedby subtracting the average (mean of the four Control specimens) of theoriginal design gradation from the average (mean of the four Experimentalspecimens) of the residual aggregate specimens after using the NCAT AsphaltContent Tester.In addition, Confidence Interval and Frequency graphs were generated. TheStudent's t-Test for a paired two sample comparison was also used todetermine if the gradation results from the Control and Experimentalspecimens were statistically from the same population set. A 95 % confidencelevel was used. The t-test data was also used to generate the ConfidenceInterval figures (1).4.8.2 Second Method of Analysis (One-to-One Comparison betweenExperimental and Control Specimens)The second method compared the gradation results between the Experimentaland Control specimens on a one-to-one basis. All possible combinations ofthe Experimental and Control specimens were paired per sieve size and theirpercent differences were calculated. The sample standard deviations were13
calculated for each of the nine sieve sizes. The standard deviationscalculated from each of the sieve sizes were compared to the single standarddeviations found in the precision statement of AASHTO T 27.14
5.0 GRADATION RESULTS AND DISCUSSION5.1 Analysis Method One (Aggregate Gradation Results)In Sections 5.1.1 - 5.1.6 and 6.1.1 - 6.1.4 the "mean difference" refers to theaverage of the percent passing the four Experimental specimens minus theaverage of the percent passing the four Control specimens calculated for eachof the sieve sizes.15
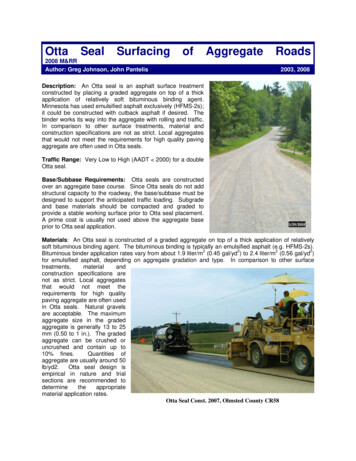
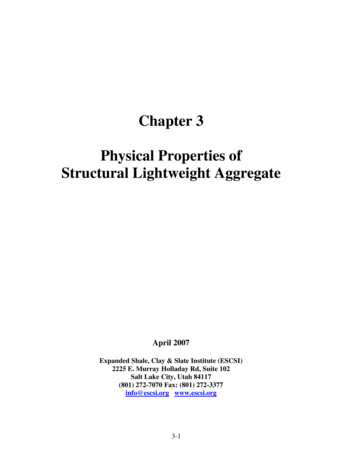
5.1.1 Mean Differences Between the Control and Experimental SpecimensIllustrated for the Franciscotti Aggregate SourceFigure 1. represents the mean differences calculated for each sieve size forthe Franciscotti aggregate source. The analysis, data and figures for all of theaggregate sources can be found in Appendix A.16
Figure 1. Mean Differences Illustrated For Each of the Nine Sieve SizesRepresenting The Franciscotti Aggregate SourceMEAN DIFFERENCE (PERCENT PASSING)EXPERIMENTAL - CONTROL2.00 % ----,1.50 % ---- ---l------l---t----t---- ---l------l------i1.00 010 ----t-- EXP. FINERE 0.500/0Q)e ---\-O.OOv/t r- Q)a. -0.50% - -- --- --- --- --- -- -- -- ---- ---!-------If------- ---- ---- ---!-------lf-------\-1.00% ---- - - ------ - EXP. ----- ------ ---- ----l COARSER-1 .50 % -t---I-------l ----t--- ------l---l.-----.----.------/--- ------l-----1-2.000/0 ----t---l------l---t----t------t--- n size17#50 #100 #200IA-l
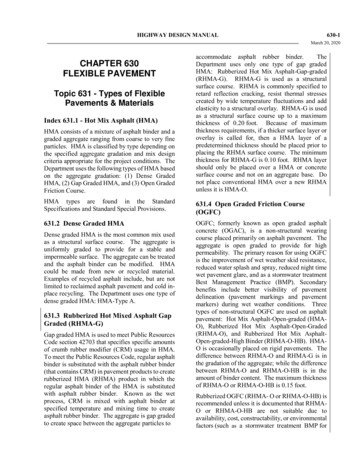
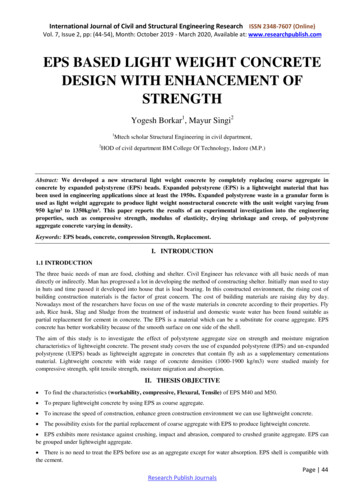
After the mean differences for the percent passing each sieve size werecalculated for the six aggregate sources, 45 out of the 54 sieves had morematerial passing each sieve, (the Experimental specimens were finer than theControl specimens).The mean differences for the percent passing each sieve size were greaterthan 1.0 percent, but less than 1.75 percent for only three out of the 54 sievestests (nine sieve sizes times six aggregate sources). The 9.5 mm (3/8 inch)sieve sizes from the Monk and Ralston aggregate source, and the 4.5 mm(No.4) sieve size from the Franciscotti aggregate source were the only sievesin which there were mean differences that were greater than 1.0 percent. Theremaining 51 sieve test mean differences were all less than 1.0 percent.5.1.2 Confidence Interval Figure Displaying the Upper and Lower Limits for theFranciscotti Aggregate SourceFigure 2. is a graphical representation illustrating the upper and lowerconfidence intervals for the Franciscotti aggregate source. The remainingillustrations representing the other aggregate sources may be found inAppendix B. The data used to calculate the confidence interval limits weregenerated by applying the Student's t-test for paired samples. The data usedto generate the figures may also be found in Appendix B.18
Figure 2. Confidence Intervals Representing the Upper and Lower Limits ForTbe Franciscotti Aggregate SourceMEAN DIFFERENCEExperimental - Control80/0 ---- -- ---- '---- '-----' E rr o r B s ------' ---- ----- ------ ------1 ----- --1--- --)-----1 95 % Confidence 50/0:::;: 40/0/eC.30//0' ? -"',.///Exp. finer Upper &' ' clIi .--1-L- :1i - -1It./.19IFf'"I Lower limits/c 20/0./-7- . "'"':.---- ·Wm 1% .-: / . . . .Ii/l"IL/E 00/0 " -- ::t :: t;;. - . c 10/0 ---- ill- -- ./e L -- -- ---- -.,.v -:.111.- - 0/".lIIk"Jlk- - .-CI) - 2 /0.""'r-O:: "- iII.-.--- ----- ---- --l - - -------".,.'------""'I"""--.,.-- g -30/0 -- ----- --- ---- --- -- .,. ---- --- ---- - e -40/0 --- ---- -- ---- ---t-- Mean differences -50/0 r- ----r- - - ,--- ,---- .---- -- .- -60/0 ---- ----- ----I EC -70/01xp.coarser:-80/0 - ----- ---- i---- ,---- i-----r----r---- ---- - 1/2IFranciscotti3/8#4#8#16 #30 #50 #100 #200Screen size (ASTM)Ir--'E'--r-ro-r-B-a-r-G-r-a-ph----.,19
5.1.3 Frequency Distribution Illustrating the Mean Differences for the 9.5 mm(3/8) Sieve SizeFigure 3 represents the range between the mean differences for each of thesix aggregate sources for the 9.5 mm (3/8) sieve size. The remainder of thefigures representing the other sieve sizes used in this study may be found inAppendix C. The figures demonstrate that the range between the lowest andhighest mean differences were normally less than 1.0 percent. Occurrenceswhich deviated further away from the concentrated group of the meandifferences may have been due to the splitting or mechanical mixing process,or the aggregate may have degraded during ignition process.20
Figure 3. Frequency Distribution Displaying Tbe Mean DifferencesRepresenting Tbe 1.18 mm (# 16) Sieve1.18 MM (# 16) SIEVEFREQ. DISTR. (MEAN DIFF.S)26/6 MEAN DIFFERENCESWERE WITHIN THIS RANGE\til1\\W(.JZ W G1-- -- f--- ------ I--1- - ------ f-- ----1-- ----- t - -tI--l----,(.Jou.o It-o -0.45%I--I-- -0.35% -0.25% -0.15% -0.05% 0.05% 0.15% 0.25%0.35% 0.45% 0.55%MEAN DIFFERENCE (PERCENT PASSING)210.65% 0.75%
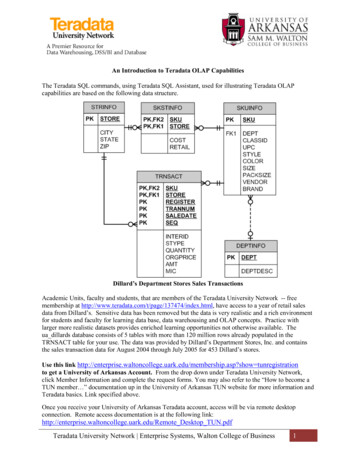
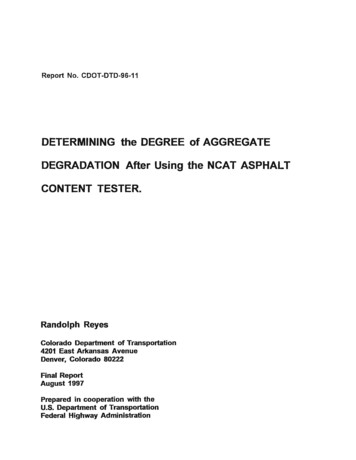
5.1.4 Frequency Distribution for the 54 Sieve TestsFigure 4 represents the frequency distribution of the mean differences for the54 sieve tests.The mean calculated for the "mean differences" as defined inSection 4.8 for all of the 54 sieve tests was 0.32 percent.22
Figure 4. Frequency Distribution Of The Mean Differences For 54 Sieve TestsFREQUENCY DISTRIBUTION54 SIEVE SCREENSIExperimental Mean - Control Mean Mean ------.-----,----.------,tnWffi 15 ---- ----- --- -------I--/ I\-i\ 10oo 5o 1:1:OMean (of all the MeanDiff.s) 0.32% -/'e/.; ----I---I\\-- ------I EXPERIMENTALEXPERIMENTAL COARSERr---I-------iFINER/\L.---.--/'"-,r - - - . . - - - - Jl.,/ c( --- --- -- -- -- - -- -- ---- /./ ' " " 1J lJl -)t\ /',.All""- -a ."'i:;'1i - -- , 'j -- -- -- - --- --- -- .I .-1.00%-0.50%0.00%0.50%1.00%PERCENT DIFF. (All Screens)II Std. Dev. 0.47%I231.50%
Table 3. Data used to generate Figure 4.NCAT OVEN GRADATION STUDYFREQUENCY 318318318.tI4ftftfiftftft#16#16#16#16#16#16 O#30 100tI200#200#200#200#200#200STCSMEANDATAVALUES SCREENmean .754.750.47%0.32%SCAlEX-AXISTIMES OCCUREDPERCENT. 0.0750.0750.0750.07524
5.1.5 Experimental Specimens that Appeared Coarser after Using the NCA TAsphalt Content TesterIn some cases, when the mean differences were calculated for each sieve sizeafter using the NCAT Asphalt Content Tester, the Experimental specimensappeared to be coarser.The 12.5 mm (1/2 inch) sieve from the Ralstonaggregate source and the 12.5 mm (1/2 inch) and the 9.5 mm (3/8) sieve sizefrom the Valco/Rocky Mountain aggregate source are examples of this. SeeSection 6.1.2 for an explanation of cases like these.5.1.6 Summary of Results Using Analysis Method OneThe results showing the ranges of the mean differences for the six differentaggregate sources are shown in Figure 5.25
Figure 5. Summary of the Gradation Results (Mean Differences, AnalysisMethod One)GRADATION RESULTSMEAN DIFFERENCES6 0.50 PERCENT6 --.--.---.-- -- --.--.---.-- 0.50 1.00 PERCENT --.--.---.-- --.---.--,---.-- CIJw 5 - --- ----t--- ---f--- --- ----t--- -----i(.)Z :::J(J(J4 --- --1-- 3 - --- ----t---- o2oz01 - --- -oSIEVE SIZES6 1.0 1.50 PERCENT.---.--,---.---.--.---.--.---.-- ffl 5 - --- ----t---- --- ---- --- ------i---- ----i(.)ffis(JZz::: 4 ---t----- --- --- -- --- ----1--- ----18 3 - --- ----t---- --- ---- --- ------i---- -----ioo 48o 3 2 2 ---t----- --- --- -- --- --1--- -- 1.18MM 1.5 2.00 PERCENT6o01zoO.3MMSIEVE SI
Technology (NCAT) Asphalt Content Tester and was used to generate the data in this paper. The ignition oven and the NCAT Asphalt Content Tester refer to the same equipment in this document. 1.1 Background In June of 1995, the Colorado Department of Transportation purchased and received six NCAT Asphalt Content Testers manufactured by