Transcription
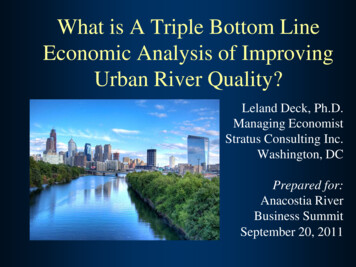
What is A Triple Bottom LineEconomic Analysis of ImprovingUrban River Quality?Leland Deck, Ph.D.Managing EconomistStratus Consulting Inc.Washington, DCPrepared for:Anacostia RiverBusiness SummitSeptember 20, 2011
The Triple Bottom Line (TBL):Economics of SustainabilityTBL a comprehensive benefit-cost analysis– Identifying and portraying all benefits & costs– Internal and external, market and nonmarket goodsThree bottom lines– Financial results– Social outcomes– Environmental benefits
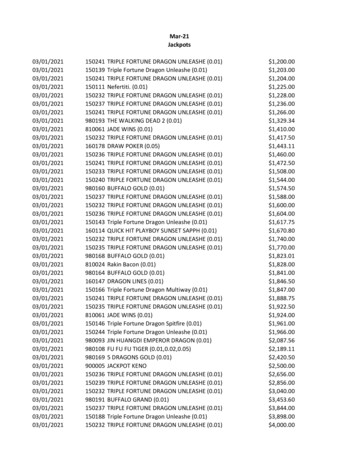
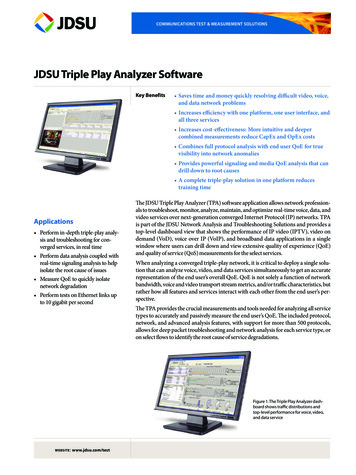
Choosing the Least Cost Option May Not Deliver Socialand Environmental Values to the CommunitySocial1EnvironmentalFinancial
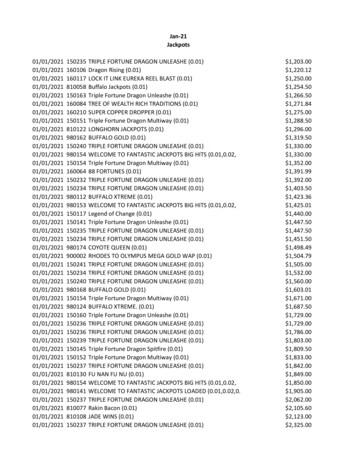
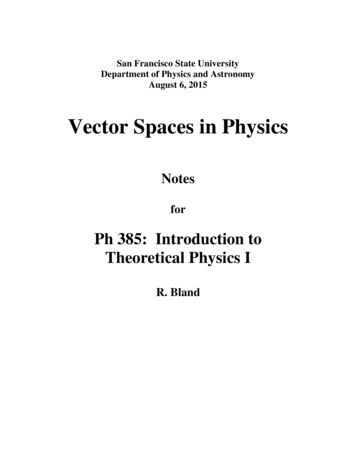
Options that Meet Broader Goals May IncreaseFinancial Costs to a Utility, but Yield Larger NetBenefits to the CommunitySocial21EnvironmentalFinancial
Case Study: Philadelphia Water Department’sCSO Control Program Alternatives– 2009 Study for PWD– Engineering by Camp, Dresser & McKee– Green approaches LID with stream & wetland restoration– Grey approaches Tunneling Transmission, Plant Expansion and Treatment Transmission and Satellite Treatment– 17 options
Green Infrastructure/LIDProgram ComponentsFour GI/LID alternatives(25%, 50%, 75% and 100%)–––––––TreesGreen StreetsGreen roofsBioretention areasStream restorationGreen space, urban parksWetlands(created and restored)
Going to Look At One Alternative:50% LID vrs 30’ Tunnel Same reduction in # of combined seweroverflow events Same present value of costs ofimplementation– Initial installation costs– 40 year O&M costs
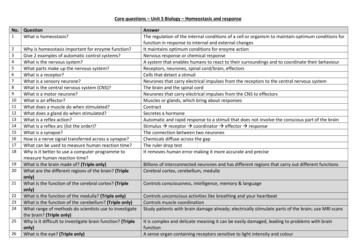
Scale of Implementation50% LID30’ Tunnel 637,483 trees402 acres green roofs5,011 acres vegetated area351,415 Heavy vehicle trips149,768 Light vehicle trips26,801 kW-hr of energy193 acres of wetlands579,837 heavy vehicle trips289,919 concrete truck trips2.0 million kW-hr of energy36.3 million cu ft concrete11.2 million kW-hr of energyfor pumping/treatment peryear
Methods and Assumptions– Mapping program components to specificoutcomes– External costs and benefits– Standard physical & economic approaches “Benefits transfer”––––Present values over 40-year timeframePresent both physical and monetary unitsOmissions, biases, and uncertaintiesSensitivity analyses
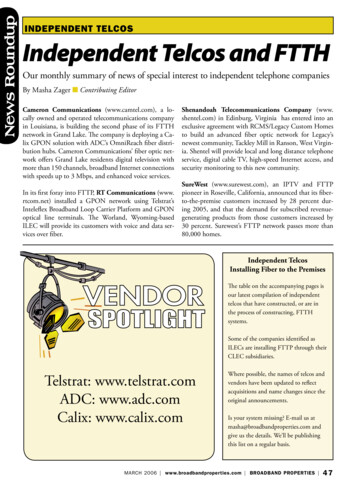
TBL Benefit/Cost CategoriesSocial Recreation ImprovedAesthetics and communitylivability Increased property value Energy use/savings Green jobs Public health/reduced heatstress Traffic flowFinancial Green GreyEnvironmental Water qualityand aquatic habitat Wetlands Carbon footprint Air quality
Public Health/UrbanHeat Stress Reduction– Increased vegetation mitigates“urban heat island effect” LID options result in reductions of 0.5 – 2 degrees Fannual average temperature– Avoided 196 deaths from Excessive Heat Events– EPA Value of Statistical Life ( 8 million per “life saved”)HEAT STRESS REDUCTION BENEFITS 1,058 million
Aesthetic/Property Value Benefits– 2 - 5% increase in value applied to median 2007home sale prices Only included residential property– # affected properties corresponds to proportion ofgreened area– Assumes 50% of PV due solely to aestheticsPROPERTY VALUE BENEFITS 575 million
Increased Recreation– Stream & wetland restoration attractsmore recreational users– Benefits are additional recreational trips(“user days”), and “direct use value”derived from each trip– 102 million new non-Creekside user days– 248 million new Creekside user daysRECREACTIONAL BENEFITS 525 million
Water Quality andEcological Habitat Benefits– Value based on meta-analysis of “willingness topay” (WTP)– Scaled values for households outside of City– WTP 9.70 to 15.54 per year per householdWATER QUALITY BENEFITS 336 million
Air Quality Health Benefits:Trees Reduce Air Pollution– Based on U.S. Forest Service research on ozoneand smog– Tree planting schedule and assumptions abouttree growth (time to maturity)– EPA models used to estimate projected healthimpacts & dollar value– Per year: 1-2 deaths, 1 heart attack, 3 hospitaladmissions, 250 work loss daysHEALTH BENEFITS FROM TREE/AIRQUALITY IMROVEMENT 131 million
Poverty Reduction fromLocal Green Jobs– Grey and green infrastructure generate differenttypes of jobs– Green generates more low skilled jobs– Average annual cost of social services inPhiladelphia 10,000 per unemployed worker– 15,266 work years (380 jobs per year)GREEN JOB BENEFITS 125 million
Energy: Up during Construction,Then Savings Due to Cooling Effectof Trees Energy used for excavation, O&M, and fuelwasted in traffic delays Energy saved due to cooling effects Over 40-year period:– 490,000 gallons of fuel used– 600,000 kBtu natural gas saved– 370 million kWh of electricity savedVALUE OF ENERGY SAVINGS 34 million
Air Pollutant Emissions Benefits Net reduction in emissions– Cement making and transportation– 1,530 MT SOx– 38 MT NOx Reduces air pollution (soot and smog) EPA valuation methods applied to value healthbenefit ( per ton)EMISSION REDUCTION BENEFITS 46 million
CO2 Emission Reduction Benefits Construction and O&M increase CO2 Reduced energy use and absorption by treesdecrease CO2 1.1 million MT net reduction Internationally recognized valuation approachesapplied ( /ton)CARBON FOOTPRINT REDUCTION 21 million
Construction-related Disruption Additional fuel use and emissions due toadded time and distances Time lost due to longer travel times Total delay under 50% LID 346,883 hrsCOSTS OF CONSTRUCTIONDISRUPTION 6 million
Wetland Benefits– Benefits include Improved water qualityGroundwater rechargeShoreline anchoringFlood controlHabitat– Per-acre value applied based on economicliterature– 193 acres of wetlands created or restoredWETLAND BENEFITS 2 million
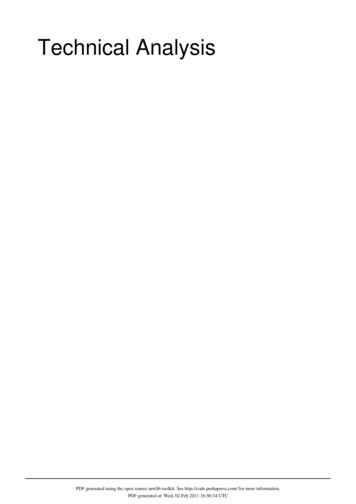
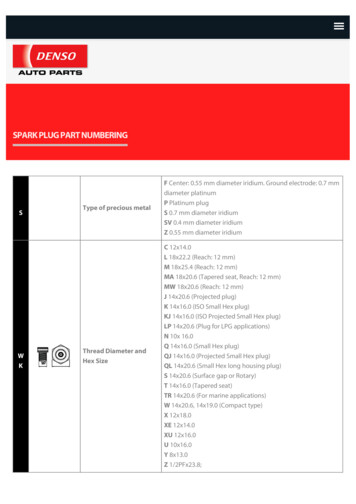
Overview of TBL ResultsSOCIAL ( 2.3B) ENVIRONMENTAL ( 400M)FINANCIAL
Full report available at:www.StratusConsulting.com
Case Study: Philadelphia Water Department’s CSO Control Program Alternatives – 2009 Study for PWD – Engineering by Camp, Dresser & McKee – Green approaches LID with stream & wetland restoration – Grey approaches Tunneling Transmission, Plant Expansion and Treatment Transmiss