Transcription
Sheri R. Colberg, PhD, FACSMProfessor Emerita, Exercise ScienceOld Dominion University
Issues for Discussion Optimal macronutrient distribution in diet Role of carbohydrates Role of protein Role of fat Glycemic effects of foods Role of macronutrients in exercise
Goals of MNT for Diabetes Promote healthful eating patterns, emphasizing a varietyof nutrient-dense foods in appropriate portions toimprove overall health and specifically to: Achieve and maintain body weight goals Attain glycemic, blood pressure, and lipid goals Delay or prevent complications of diabetes Address individual nutrition needs based on personaland cultural preferences, health literacy and numeracy,access to healthful foods, willingness and ability to makebehavioral changes, and barriers to changeAm Diabetes Assoc. Diab. Care, 40(1):S33-S43, 2017
Goals of MNT for Diabetes Maintain the pleasure of eating by providingnonjudgmental messages about food choices Provide practical tools for healthy eating rather thanfocus on individual macronutrients, micronutrients, orsingle foodsAm Diabetes Assoc. Diab. Care, 40(1):S33-S43, 2017
Macronutrient Distribution
Eating Patterns No single ideal dietary distribution of calories amongcarbohydrates, fat, and protein for people with diabetes Macronutrient distribution should be individualized A variety of eating patterns acceptable for themanagement of type 2 diabetes and prediabetesincluding Mediterranean, DASH, and plant-based dietsAm Diabetes Assoc. Diab. Care, 40(1):S33-S43, 2017
Macronutrient Distribution Macronutrients distribution should be based onindividual assessment of current eating patterns,preferences, and metabolic goals
From One Extreme to the Other
MyPlate Recommendations
Healthy Eating Plate Recs
Diabetes Meal /planning-meals/create-your-plate
AMDR (% of Total Daily Diet)
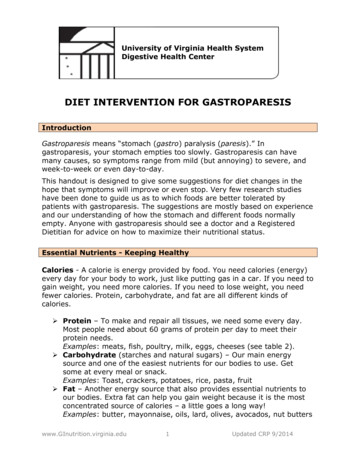
Macronutrient Ranges (AMDR) Carbohydrates: Fat: Protein:All % *ADA does not take a definitive stance on macronutrientdistribution ranges for adults with diabeteshttp://www.nationalacademies.org
Calorie Equivalents
Macronutrient Servings
Role of Carbohydrates16
Types of Dietary Carbohydrates
Fates of Blood Glucose
What Is Fiber? Dietary fiber (intact foods) Water soluble and water insoluble Functional fiber (isolated, extracted, or synthetic) Pectin, gums, resistant starch Total fiber Sum of all types Recommended total: (gm per day) Adults 50 years: 38 g M, 25 g F Adults 50: 30 g M, 21 g F
ADA Carbohydrate Recs Emphasize carbs in whole grains, vegetables, fruits,legumes, and dairy products Emphasis on foods higher in fiber and lower in glycemicload advised, especially over those with sugars Avoid sugar-sweetened beverages to control weight andreduce risk for CVD and fatty liver Minimize consumption of foods with added sugar thatdisplace healthier, more nutrient-dense food choicesAm Diabetes Assoc. Diab. Care, 40(1):S33-S43, 2017
ADA Stance on Carb Counting Individuals with T1D or T2D taking insulin for mealsshould be educated on counting carbs Modify insulin dosing from meal to meal based on carbintake to improve glycemic controlAm Diabetes Assoc. Diab. Care, 40(1):S33-S43, 2017
Nonnutritive Sweeteners Nonnutritive sweeteners may reduce overall calorie andcarbohydrate intake If substituted for caloric ones and without compensatingwith calories from other sources Generally safe to use within acceptable daily intake levelsAm Diabetes Assoc. Diab. Care, 40(1):S33-S43, 2017
Role of Protein
Animal vs. Plant Proteins Animal proteins generally regarded as “better” sincecomplete (all essential amino acids) High quality plant proteins, but only soy complete
* BCAAs; **Conditionally essential
ADA Protein Recs Lowering daily protein intake (from 1–1.5 g/kg or 15–20%total calories) does not necessarily improve health Ideal amount of dietary protein to optimize eitherglycemic control or CVD risk unknown Higher protein may increase satietyAm Diabetes Assoc. Diab. Care, 40(1):S33-S43, 2017
ADA Protein Recs In T2D, ingested protein increases insulin responsewithout increasing blood glucose More insulin released to cover protein In T1D, higher protein intake may raise mealtime insulinneeds to cover delayed postprandial rise in blood glucose More insulin needed to cover protein Carbohydrate sources high in protein should not be usedto treat or prevent hypoglycemiaAm Diabetes Assoc. Diab. Care, 40(1):S33-S43, 2017
Protein and Kidney Disease Dietary protein should be at recommended dailyallowance of 0.8 g/kg body weight/day, but not lower Lower protein intake does not alter glycemic measures,CVD risk, or rate of decline of glomerular filtration rateAm Diabetes Assoc. Diab. Care, 40(1):S33-S43, 2017
Role of Fat
ADA Fat Recs Ideal total dietary fat content for PWD not identified Mediterranean-style diet (rich in monounsaturated fats)may improve glucose metabolism and lower CVD risk Effective alternative to a diet low in total fat but relativelyhigh in carbohydrates Eating foods rich in ω-3 fatty acids, such as fatty fish (EPAand DHA) and nuts and seeds (ALA), recommended toprevent or treat CVD (but not ω-3 dietary supplements)Am Diabetes Assoc. Diab. Care, 40(1):S33-S43, 2017
Type of Fats vs. Total Fat Type of fats consumed more important than total amountof fat when looking at metabolic goals and CVD riskAm Diabetes Assoc. Diab. Care, 40(1):S33-S43, 2017
Delayed Effects of Fats Higher fat intake may require mealtime insulin doseadjustments to compensate for delayed postprandialglycemic excursions
Glycemic Effects of Foods34
Glycemic Effects of Carbs Affected by relative carbohydrate, protein, and fat Foods with little or no carbohydrate do not have muchof an immediate impact on the rise in blood glucose(i.e., they have a low or no effect) Examples: meat, fish, eggs, avocado, wine, beer,spirits, most non-starchy vegetables Harder to test the effects of mixed meals and foods Also, test subjects do not have diabetes Intersubject and intrasubject variability
What Is Glycemic Index? Relative to the effect of 50 grams of a specificcarbohydrate on the rate of rise in blood glucose 50 grams of glucose ranked at 100 GI rating scale: 70 or more – High 56 to 69 – Medium 55 or less – Lowwww.glycemicindex.com
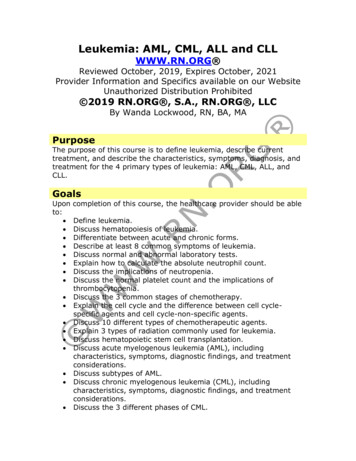
Typical Glycemic Index ValuesSearch database at www.glycemicindex.com
Disagree with chips, some ice cream,some processed foodDisagree with rice, some bread
GI Affected By Ripeness/storage of foods (green vs. ripe bananas) Processing of foods (highly processed vs. natural) Cooking method (al dente pasta) Type or variety (converted long-grain vs. short-grain rice) Acidity of foods (vinegar) Individual differences in response Eaten alone or part of mixed meal Amount eaten (total carbs, GL)
Glycemic Load Incorporates both GI and portion sizeSubtracts out grams of fiber
Typical Glycemic Load ValuesSearch database at www.glycemicindex.com
GI/GL of Select Hawaiian Foods Dasheen (Jap. taro, boiled)—57 g carbs, 1 cup mashed GI 75 (high); GL 43 (high) Mochi (glutinous rice ball)—28 g carbs, 4 1-in cubes GI 48 (low); GL 13 (medium) Breadfruit (‘ulu, raw)—27 g carbs (1/2 cup) GI 68 (medium); GL 18 (medium)
GI/GL of Select Hawaiian Foods Papaya (paw paw)—30 g carbs, 1 medium Ripe: GI 55 (low); GL 17 (medium) Raw: GI 60 (medium); GL 9 (low)—only 15 g carbs Bananas— 25 g carbs, 1 large (8-9”) Under ripe: GI 30 (low); GL 6 (low) Almost ripe: GI 42 (low); GL 11 (medium) Ripe: GI 51 (low); GL 13 (medium) Over ripe: GI 48 (low); GL 12 (medium) All trials: GI 46-62 (low to medium); GL 11-16 (medium)
Use of GI/GL in Diabetes Low-GI foods and meals produce lower glycemicresponses (studies in T1D) Risk of mild hypoglycemia is greater with low-GI thanwith high-GI foods Low-GI foods more likely to cause early hypoglycemia Correlation between GI and time to hypoglycemia Each unit increase in GI delaying hypoglycemia by 1 minBell et al. Diab. Care, 38(6):1008-1015, 2015
Use of Food Insulin Index (FII) FII is based on insulin demand evoked by 1,000-kJ foodportions (calories) in healthy subjects Accounts for all nutritional and metabolic factorsaffecting insulin demand, not just macronutrients Improves glycemia in the 3-h postprandial period, butrelatively short postprandial monitoring may not havedetected delayed impact of fat and proteinBell et al. Eur J Clin Nutr, 68:1055–1059, 2014
Impact of Mixed Meals Systematic review of 21 studies on glycemic effect of fat(n 7), protein (n 7), and GI (n 7) Fat, protein, and GI all modify postprandial glycemia Late postprandial hyperglycemia the predominant effectof dietary fat In some with high fat intake, glucose reduced in the first2–3 h, possibly due to delayed gastric emptyingBell et al. Diab. Care, 38(6):1008-1015, 2015
Impact of Mixed Meals 10 studies on insulin bolus dose and delivery patternsrequired for high-fat and/or high-protein meals Results inconsistent regarding optimal bolus deliverypattern (due to study design differences), but High-fat/protein meals require more insulin than lower-fat/protein meals with identical carbohydrate content Marked interindividual differences in fat sensitivityBell et al. Diab. Care, 38(6):1008-1015, 2015
Protein with Carbohydrate Protein affects postprandial glycemia, but effects differwhen consumed with and without carbohydrates Addition of 35 g protein to 30 g carbohydrates increasedblood glucose by 2.6 mmol/L (47 mg/dL) at 5 hours Effect of fat and protein additive, with blood glucoseconcentrations increasing by 5.4 mmol/L at 5 hours Sum of individual incremental increases for protein and fatBell et al. Diab. Care, 38(6):1008-1015, 2015
Protein without Carbohydrate Effect of protein only (with no carbs and fat) less Addition of 12.5–50 g protein with no effect 75 and 100 g protein increases glucose Reached peak at the conclusion of the 5-hour study Increase in similar to that of 20 g carbs without insulinBell et al. Diab. Care, 38(6):1008-1015, 2015
Unanswered Questions (T1D) How much fat does there need to be in a meal before aclinically significant glycemic effect becomes apparent? Is there a threshold and/or dose response (i.e., more fatrequires more insulin)? Do all types of fat and protein have similar effects?Bell et al. Diab. Care, 38(6):1008-1015, 2015
Unanswered Questions (T1D) Are there phenotypic characteristics that can be used asmarkers to identify individuals with diabetes who aremore nutrient sensitive and will require more insulin tocover higher-fat/protein meals? What are the optimal insulin dose adjustments neededfor common meals with varying fat and protein content?Bell et al. Diab. Care, 38(6):1008-1015, 2015
Role of Macronutrients in Exercise52
Exercise Fuels ATP-PCr System (Phosphagens) Stored ATP, PCr only (10 seconds) Lactic Acid System (Glycolysis) Muscle glycogen exclusively (2 min) Oxygen System (Aerobic) Use of all fuels possible (over 2 min)
Exercise Fuel Use by Intensity Carb use more “fuel efficient” (more kcals/L oxygen) Fat is major energy source for low-intensity ex Blood glucose and fat (FFA) use greater during mildexercise (done at 50% maximal) Muscle glycogen and TG used during higher intensity Training ability to use both fuels
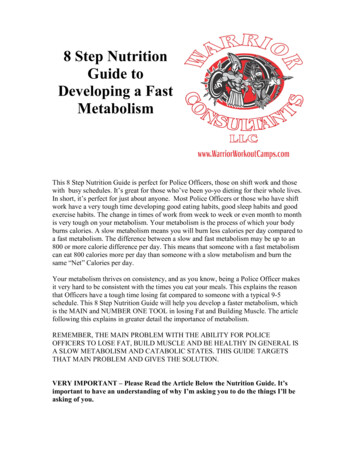
Carbs Used Most for Exercise For most exercise (moderate or higher), carbs are main fuel Muscle glycogen ( 80%), blood glucose (20%)Romijn JA et al., JAP, 88(5): 1707-1714, 2000
Limited Carbohydrate Stores
Glucose Use with Exercise BG uptake into muscles occurs 2 ways:(1) Insulin Rest Exercise(2) Contractions Exercise Separate, but additive mechanisms
FFA Use During Exercise
Protein Use for Exercise ( 5%)
Protein Intake for Athletes Athletes need at least the RDA for protein (0.8-1.0 gm/kgbody weight), but likely more At 12% of calories, protein intake averages 1.5-1.7 g/kg,so most athletes already consume this Increasing calorie intake decreases need for protein
Final Conclusions No single ideal dietary distribution of carbohydrates, fats,and proteins for PWD (but carbs matter) Focus on fiber, plant proteins, and type of fat for health GI and GL may better predict blood glucose responses Protein and fat have delayed effects on glycemia, but howto factors in these effects for all PWD is less clear Exercise is primarily fueled by carbs and fat, with carb usegreatest during moderate or higher intensity61
Resourceswww.DiabetesMotion.com
ADA Fat Recs Ideal total dietary fat content for PWD not identified Mediterranean-style diet (rich in monounsaturated fats) may improve glucose metabolism and lower CVD risk Effective alternative to a diet low in total fat but relatively high in carbohydrates Eating foods rich in ω-3 fatty acids, such as fatty fi