Transcription
The GlobalPublishing Industryin 2018
The GlobalPublishing Industryin 2018
The user is allowed to reproduce, distribute, adapt, translateand publicly perform this publication, including for commercial purposes, without explicit permission, provided that thecontent is accompanied by an acknowledgement that WIPOis the source and that it is clearly indicated if changes weremade to the original content.Suggested citation: WIPO (2020). The Global Publishing Industryin 2018. Geneva: World Intellectual Property Organization.Adaptation/translation/derivatives should not carry any official emblem or logo, unless they have been approved andvalidated by WIPO. Please contact us via the WIPO websiteto obtain permission.For any derivative work, please include the following disclaimer: “The Secretariat of WIPO assumes no liability orresponsibility with regard to the transformation or translationof the original content.”When content published by WIPO, such as images, graphics,trademarks or logos, is attributed to a third-party, the userof such content is solely responsible for clearing the rightswith the right holder(s).To view a copy of this license, please go/The designations employed and the presentation of materialthroughout this publication do not imply the expression of anyopinion whatsoever on the part of WIPO concerning the legalstatus of any country, territory or area or of its authorities,or concerning the delimitation of its frontiers or boundaries. WIPO, 2020World Intellectual Property Organization34, chemin des ColombettesP.O. Box 18CH-1211 Geneva 20SwitzerlandISBN: 978-92-805-3148-0This publication is not intended to reflect the views of theMember States or the WIPO Secretariat.The mention of specific companies or products of manufacturers does not imply that they are endorsed or recommended by WIPO in preference to others of a similar naturethat are not mentioned.Attribution 3.0 IGO(CC BY 3.0 IGO)Photo credits: Getty Images / ktsimagePrinted in Switzerland
Table of contentsAcknowledgments41. Introduction52. M ain findings basedon the IPA–WIPO survey83. Legal deposits survey184. Nielsen BookScan data235. International ISBNAgency data246. P ublishing by theSTM sector267. What do different datasources tell us?308. Future direction33Annexes343
THE GLOBAL PUBLISHING INDUSTRY IN 2018AcknowledgmentsThis report was prepared under the direction of Francis Gurry (Director General) and supervised by Carsten Fink (Chief Economist). The report was authored by Anastasiya Letnikavawith inputs from Mosahid Khan, both from the Economics and Statistics Division.We are grateful to the copyright offices, national legal depositories, national publishers associations, Centro Regional para al Fomento del Libro en América Latina y el Caribe (CERLALC),the Federation of European Publishers (FEP), the International ISBN Agency and the NielsenCompany for sharing their publishing industry data with WIPO. Their invaluable cooperationhas made The Global Publishing Industry in 2018 report possible.Thanks go to the following experts who have provided guidance on the questionnaire design,reviewed the compiled data and provided comments and suggestions on the draft: JoséBorghino, Andre Breedt, Stella Griffiths, José Diego González Mendoza, James Taylor, EnricoTurrin, Reeta Windsor and Rüdiger Wischenbart.Samiah Do Carmo Figueiredo and Cécile Roure provided administrative support. Gratitudeis also due to the Publications Division for the editing and design and to staff in the PrintingPlant for their services.4
THE GLOBAL PUBLISHING INDUSTRY IN 20181. IntroductionTo improve the availability of statistical datafor the creative economy, the InternationalPublishers Association (IPA) and the WorldIntellectual Property Organization (WIPO)conducted a pilot survey to compile publishingstatistics in 2017. In all, 35 national publishersassociations (NPAs) and copyright authoritiesshared their 2016 data covering the publishingindustry. Results from the piloted survey werepublished in The Global Publishing Industryin 2016 report. The following year in 2018, 53countries/territories responded to the surveyand shared their 2017 data with WIPO.To improve survey response rate and dataquality, WIPO organized a technical workshopin April 2019 that brought together a selectednumber of experts to review the questionnaireand the data collection process (see annexA1 for a list of the expert contributors to theworkshop). Based on this expert input, themethodological guidance attached to thequestionnaire was refined and the questionnaire simplified.This report presents the latest publishingstatistics compiled from the following sources: (a) the IPA–WIPO publishing survey, (b) theCentro Regional para al Fomento del Libroen América Latina y el Caribe (CERLALC), (c)WIPO’s legal deposits survey, (d) the NielsenCompany, (e) the International ISBN Agency,and (f) the Web of Science database.Publishing industry data are not unified undera single authority. For this reason, the reportpresents data from additional sources toprovide a broad picture of the publishing industry. One drawback to this approach is that datafrom these sources may provide conflictinginformation about market size and the evolution of activity within the publishing industrydue to differences in methodology and marketcoverage. That said, compiling data from additional sources does enable users to validateand/or supplement the data compiled throughthe IPA–WIPO questionnaire.5
THE GLOBAL PUBLISHING INDUSTRY IN 2018Data sourcesThe pilot survey launched in 2017 covered three sectors: trade, educational, and scientific,technical and medical (STM). A number of respondents indicated that data for the STM sectorwas not available. Furthermore, STM sector publishing is dominated by multinational firmslocated around the world, making it extremely difficult to track the requested data. For thisreason, the STM sector is no longer covered by the IPA–WIPO publishing survey. Our aiminstead is to exploit other data sources to capture STM sector publishing activity (see section 6).To validate and complement IPA–WIPO survey data, data from additional sources have beencompiled; for example, data from legal deposits, ISBNs, private entities, etc.Cooperation with the Federation of European Publishers (FEP) and CERLALC was strengthened to reduce the burden on respondents and increase the geographical coverage of thereport. We are grateful to the FEP and CERLALC for their willingness to share data. TheInternational ISBN Agency shared aggregate data for around 20 countries that serves as abenchmark for the number of titles published in a given country.1 WIPO is also appreciativeof the cooperation given it by the Nielsen Company in sharing aggregate sales and revenuedata for 10 countries.The scope of the IPA–WIPO survey is limited to published materials (i.e., books, monographs,etc.) issued with an ISBN, a Digital Object Identifier (DOI) or any other book identifier. Dataavailability in terms of breakdown is available in annexes A2, A3 and A4. Caution shouldbe exercised when interpreting the IPA–WIPO survey data, as it is incomplete and partial.Moreover, the share of the total publishing industry represented by national publishersassociations (NPAs) varies between countries and methodological differences mean thatcomparisons between countries are difficult to make.1.6Although, an ISBN is not the sole book identifier for some countries, it is nonethelessthe largest standardized identification system in most countries.
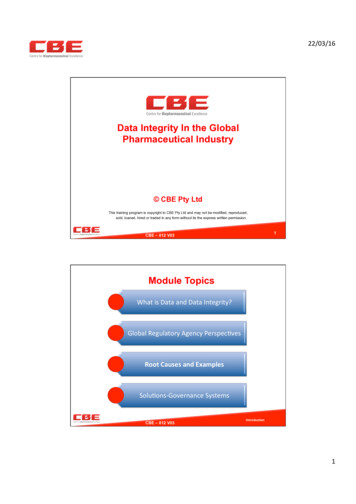
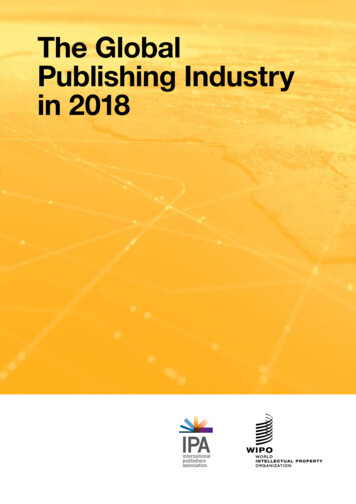
THE GLOBAL PUBLISHING INDUSTRY IN 2018Map 1. Participation in the IPA–WIPO publishing survey2018 data2017 data2016 dataNo data availableNote: a total of 63 countries/territories are covered by the survey, including 56 for 2018 alone.In total, 56 NPAs and copyright authoritiesshared their 2018 data, while seven associations/authorities shared data for 2016/2017(which are the latest available). This brings thetotal number of countries/territories covered bythe survey to 63 (figure 1). Moreover, a numberof respondents indicated a willingness toshare their 2018 data when they becomeavailable. For details on respondents, referto annex A5.7
THE GLOBAL PUBLISHING INDUSTRY IN 20182. M ain findings basedon the IPA–WIPO surveyWhat is the revenue for thetrade and educational sectors?The 2018 total sales and licensing revenuefor the trade and the educational sectors isavailable for 19 countries. In addition, a furtherfour countries provided 2017 data. Those19 countries together generated revenue ofUSD 50.3 billion in 2018. The United Statesof America (U.S.) (USD 23.3 billion) reportedthe largest net revenue, followed by Germany(USD 6.1 billion), the United Kingdom (U.K.)(USD 5.4 billion), the Republic of Korea(USD 5 billion) and France (USD 3 billion)(table 1). Trade sector revenue accounted for50% or more of total revenue in 14 countries –ranging from 56.6% in Finland to 93.3% in theCzech Republic. Educational sector revenueaccounted for over half of total revenue inSouth Africa (68.7%), the Republic of Korea(65.2%), Brazil (62.4%) and Turkey (50.5%)(table 1).Revenue generated by the trade sector in 2018is available for 20 countries/territories. In addition, a further four countries provided 2017data. The U.S., with USD 16.2 billion, reported the largest revenue, followed by Japan(USD 8.4 billion), the U.K. (USD 3.2 billion)and France (USD 2.1 billion) (table 1). Twelvecountries provided 2018 trade sector revenuebroken down by format: printed, digital andother format categories. For each of thesetwelve countries, print editions generatedmore than three-quarters of trade sectorrevenue. Japan (24.5%), Sweden (23.2%),the Republic of Korea (22.5%) and the U.S.(19.4%) had the largest shares of digitaleditions in total trade sector revenue (figure 1).The 2018 trade sector revenue broken downby destination market is available for 12 countries/territories. Domestic sales accountedfor the bulk of total revenue for all observedcountries, ranging from 60.6% in Belgium to99.9% in Japan. The share of revenue fromforeign sales and licensing represents a relatively high proportion of the total in Belgium(39.4%) and the U.K. (33%) (figure 2).8The online sales channel generated more thanhalf of total trade sector revenue in the U.K.The U.S. (41.6%), Brazil (25.5%), Italy (24%)and Sweden (23.5%) likewise each had a largeproportion of its total trade sector revenuegenerated by this channel. However, the brickand mortar channel continues to generate thelargest share of total trade sector revenue forall reported countries, except for Slovenia, theU.K. and the U.S. (figure 3).Revenue generated by the educational sectorin 2018 is available for 16 countries. The U.S.with USD 7.1 billion reported the largest totalrevenue, followed by the Republic of Korea(2.6 billion), the U.K. (USD 2.3 billion) and Italy(USD 0.9 billion) (table 1). For all 16 of thereported countries, print editions accountedfor the bulk of revenue, ranging from 67.4% inDenmark to 98% in Estonia. Digital editionsaccounted for 32.6% of revenue in Denmark,28.8% in Norway and 19.6% in the U.K.(figure 4).A breakdown of total educational sector revenue by domestic or foreign market showsthat the U.K. (55.9%) and Belgium (24.9%)each had the largest share of total revenuegenerated overseas. The domestic marketaccounted for almost the entire educationalsector revenue in Denmark, Finland, Norway,South Africa and the U.S. (figure 5).
THE GLOBAL PUBLISHING INDUSTRY IN 2018Number of titles publishedby the trade and educationalsectors in 2018Number of copies sold bythe trade and educationalsectors in 2018Data on the total number of titles published in2018 covering both the trade and the educational sectors are available for 47 countries. Inaddition, a further five countries shared their2017 data. The U.K. reported a combined totalof 188,000 published titles in 2018, followedby Italy (130,376), the Russian Federation(116,915) and France (106,799) (table 2). Thetrade sector accounted for more than half ofall titles published in those countries able toprovide a by-sector breakdown – ranging fromjust over half (50.5%) in Belarus to 97.7% inEstonia (table 2).Eleven countries were able to report data onthe total number of copies sold covering thetwo sectors. The U.S. sold 2,597 million copiesin 2018, followed by the U.K. (652 million),France (419 million) and Turkey (400 million)(table 3). The trade sector accounted for morethan 80% of total copies sold for France,Norway and the U.S. The educational sectorhad a high share of total copies sold inUzbekistan (80.8%), Brazil (55.2%) and Turkey(53.8%) (table 3).Data on the number of titles published bythe trade sector in 2018 are available for 32countries/territories. In addition, a further fivecountries shared their 2017 data. Italy had byfar the highest number of titles published in2018 (126,196), followed by Spain (81,228),France (77,221), Japan (71,661), the Republicof Korea (63,476) and Turkey (56,991) (table 2).In all, 14 countries were able to disaggregatethe number of trade sector titles publishedbetween print editions, digital editions andother formats. Print editions accounted formore than half of all titles published by thetrade sector in most of these countries. Thelargest share of digital editions was reportedby Sweden (48.7%), followed by Norway(43.5%), Italy (40.8%), Estonia (30.7%) andEcuador (25.4%) (figure 6).Data on the number of titles published bythe educational sector are available for 28countries. Of these, Turkey had by far thehighest number of titles published (21,628),followed by Brazil (10,726) and France (9,934)(table 2). The bulk of titles were publishedin print format for all reported countries.Spain (36.6%) reported the largest share ofdigital educational titles, followed by Austria(32.6%), Finland (31.6%) and Guatemala(29.5%) (figure 7).Data on the numbe
Publishers Association (IPA) and the World Intellectual Property Organization (WIPO) conducted a pilot survey to compile publishing statistics in 2017. In all, 35