Transcription
2018 Global aerospace and defense industry financialperformance studyCommercial aerospace sector performance decelerates,while defense sector continues to expand
ContentsExecutive summary1Scope of the study3Global aerospace and defense (A&D) industry: Performance overview52017 global A&D industry performance: A detailed analysis9Global defense sector compared with commercial aerospace sector19Comparison of US and European A&D industry performance20Comparison of US and European defense sector performance23Segment performance21Study methodology26Authors29Contacts30Endnotes31
2018 Global aerospace and defense industry financial performance study Executive summaryGlobal aerospace and defense industry recuperated asrevenue growth increased in 2017; however, the industrylagged compared to global gross domestic product (GDP).Global aerospace and defense (A&D) industry revenues grew2.7 percent or US 18.3 billion in 2017 to reach US 685.6 billion.The overall industry growth rate increased from 2.4 percent in2016, yet was slower than the 2017 estimated GDP growth of 3.1percent1 as the commercial aerospace sector growth slowed to1.2 percent in 2017.Global commercial aerospace revenue growth furtherdecelerated to 1.2 percent in 2017 from a growth of 2.7 percentin 2016. The sector added US 4.0 billion in revenues to reachUS 323.1 billion in 2017. The decline in growth was largely dueto a slowdown in twin-aisle aircraft deliveries in the US. Thecommercial aerospace sector growth in the US remained soft,up marginally by 1.3 percent in 2017, whereas the Europeancommercial aerospace sector experienced strong growth of3.7 percent as the region experienced higher aircraft deliveriesduring the year.Global defense sector revenues recorded a 3.9 percentincrease as defense spending continues to rise across theglobe. After posting moderate growth in 2016, global defenserevenue experienced robust growth of 3.9 percent in 2017 toreach US 361.5 billion. This was largely driven by the US, wherethe defense sector revenues were up 4.5 percent, owing tohigher funding from the US Department of Defense (DoD), thesector’s major customer. The European defense sector revenuesgrew 2.6 percent in 2017, compared to a mere 0.6 percent in2016. One of the factors driving growth in the defense sector inEurope is the increasing pressure from the US administration onNATO members to increase military expenditure to 2 percent ofGDP.2US A&D industry revenue growth outperformed itsEuropean counterparts, led by robust performance of theUS defense sector. In 2017, the US A&D industry experienced a3.4 percent year-on-year (YoY) growth, marginally outpacing the3.2 percent growth recorded by the European A&D industry. Thistrend reversed after two straight years of European companiesoutperforming the US companies (in 2015 and 2016).Original equipment manufacturers (OEMs) and companiesin the electronics segment drove overall revenue growth.OEMs and companies in the electronics segment added US 5.6billion and US 4.7 billion in revenues, respectively. While growthfor OEMs was primarily led by a revenue increase at LockheedMartin, which contributed US 3.8 billion in revenues in 2017,Rockwell Collins and Raytheon were the leading contributors to theelectronics segment revenue.Global A&D industry core operating margins improved in2017, primarily led by the US, with stable margins for theEuropean A&D industry. Operating margins for the industryexpanded to 10.8 percent, up from 10.2 percent in 2016. Themargin improvement was mainly led by the US A&D industry, whichrecorded healthy margins of 12.7 percent in 2017, increasing from11.6 percent in the previous year. Higher industry margins canbe attributed primarily to strong core operating earnings growth(up 64.2 percent) at The Boeing Company (Boeing). In contrast,the European A&D industry recorded an operating margin of 8.5percent, largely flat as compared to 8.6 percent in 2016.Propulsion segment recorded the highest operatingmargins, followed by tier 2 suppliers. Although operatingmargins for the propulsion segment were mostly flat in 2017 at17.4 percent, they were the highest amongst all segments. This wasfollowed by tier 2 suppliers, which continue to earn margins higherthan tier 1 suppliers, recording an operating margin of 16.5 percentin 2017, up from 16.0 percent in 2016. Tier 1 suppliers’ marginsremained stable at about 10.0 percent in 2017.Productivity improvement in the industry accelerates asoverall profitability rises, primarily in the US. The A&Dindustry productivity continued to improve, up by a solid 8.6percent in 2017. Productivity per employee among global A&Dcompanies increased to US 38,543, as the employee baseremained flat, whereas operating profit experienced healthygrowth in 2017. While the European A&D industry recordedmoderate productivity growth of 1.9 percent, productivity peremployee for the US companies rose 12.3 percent in 2017.There continues to remain a gap between productivity levels peremployee for the US and European companies, which stood atUS 48,658 and US 29,477, respectively.1
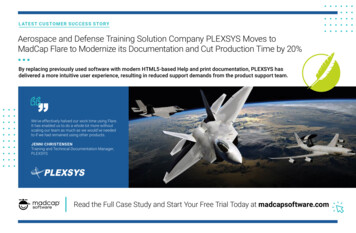
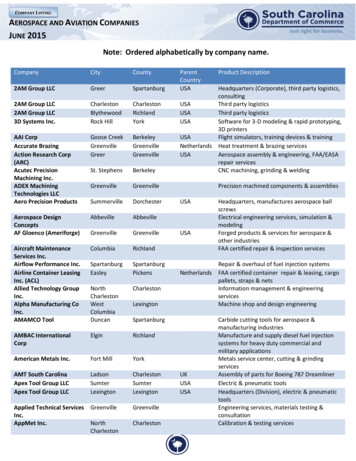
2018 Global aerospace and defense industry financial performance study Figure 1. Key drivers of 2017 global aerospace and defense industry revenue 20 18 18.3 1.3Other*Total growth 1.8 16Revenue growth (US billion) 0.9 0.7 3.2 14 12 4.7 10 8 6 5.6 4 2 gmentTier 2segmentTier 1segment*For revenue, ‘other’ includes revenue growth from aerostructure and the tier 3 segment.Source: Deloitte Global analysis of the 100 major global aerospace and defense companies using public company filings and press releases. See the methodologysection for further information and definitions of financial metrics, as well as company name, reports, and dates. Note that all figures are in US .Figure 2. Key drivers of 2017 global aerospace and defense industry core operating profitCore operating profit growth (US billion) 8 7 1.9 0.5 0.1( 0.8) 6.2 6 5 4.6 4 3 2 1 0US CommercialAerospace sectorUS DefensesectorEuropeanCommercialAerospace sectorEuropeanDefense sectorOther*Total growth*For core operating earnings, ‘other’ includes some companies from outside the US and Europe, such as Brazil, Canada, Israel, Japan, Singapore, China, South Korea,Australia, Taiwan, India, and Turkey. Companies from these regions are not included in the “US” and the “European” region totals, but have been included in “other”.Source: Deloitte Global analysis of the 100 major global aerospace and defense companies using public company filings and press releases. See the methodologysection for further information and definitions of financial metrics, as well as company name, reports, and dates. Note that all figures are in US .2
2018 Global aerospace and defense industry financial performance study Scope of the studyThe 2018 Global aerospace and defense industry financialperformance study analyzes the top 100 global A&Dcompanies or those units of industrial conglomerates withA&D businesses that reported revenues of more thanUS 500 million in 2017. Figure 3 lists the 100 companiesand divisions included in the analysis. The study does notinclude A&D organizations such as government-controlledentities, private companies that do not release public filings, orpublic companies that do not report A&D business segmentinformation. In addition, certain companies from the last year’sstudy were excluded if they did not fulfill the inclusion criteria,that is, companies with 2017 revenues of less than US 500million, companies that have been subsequently bought byothers, and companies that have become (or will become)private, were not included in the 2017 analysis. Please refer tothe methodology section for more details.Financial performance metrics at the company level arecited throughout this study, especially for the top performingcompanies and, selectively, for the lower performers. However,metrics for a given company should not be viewed in isolation,as there are typically unique transactions for individual metricsby company, e.g., prior year acquisitions, special circumstances,etc. The combined metrics for a given company are more likelyto form the basis for an overall assessment of the financialperformance of both the global A&D industry and individualcompanies.The study was conducted by assessing performance basedon calculating 19 key financial metrics. These include metricssuch as revenue, operating earnings, operating margin,return on assets (ROA), free cash flow (FCF), free cash margin(FCM), book-to-bill (BTB) ratio, and employee productivity. Allfinancial metrics in the study are based on a constant currencyconversion (using US ) method to eliminate the impactof foreign exchange fluctuations on company or industryperformance. However, please note that we have not restatedthe effects of currency hedging policies. Where metrics werecompared to previous years, we restated the previous year’snumbers to be consistent.3
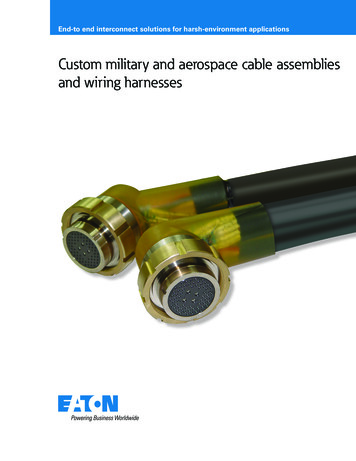
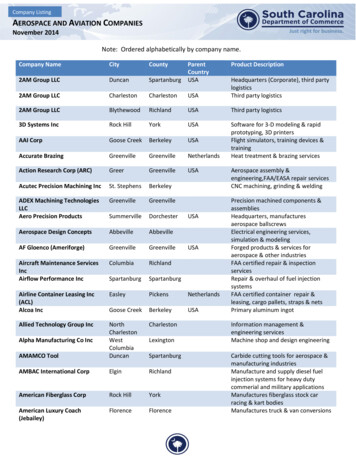
2018 Global aerospace and defense industry financial performance study Figure 3: Global aerospace and defense companies included in the analysisGlobal aerospace and defense companies or divisions included in this study ranked by 2017 revenue1. Boeing35. SAIC69. HEICO Corporation*2. Airbus Group36. IHI Aero Engine & Space*70. Curtiss-Wright*3. Lockheed Martin37. Saab71. BWX Technologies*4. General Dynamics38. Rheinmetall Defence*72. Subaru Aerospace*5. United Technologies Corporation*39. Transdigm Group*73. Serco Defence*6. GE Aviation*40. Elbit Systems74. Fluor Corp*7. Northrop Grumman41. Triumph Group75. LISI Aerospace*8. Raytheon42. Hindustan Aeronautics Ltd76. Vectrus Inc.9. BAE Systems43. CACI*77. Austal Ltd.10. Safran44. Cobham78. Ball Aerospace*11. THALES*45. Hanwha Techwin*79. Amphenol*12. Rolls-Royce*46. Jacobs Engineering Group*80. Senior Aerospace*13. Leonardo47. Meggitt*81. OHB Technology14. Honeywell Aerospace*48. Parker Hannifin Aerospace82. QinetiQ*15. Textron49. CAE Inc.83. Cubic Corp.*16. L3 Technologies50. thyssenkrupp Marine Systems GmbH*84. Aerospace Industrial Development17. Bombardier Aerospace*51. Engility18. Huntington Ingalls Industries52. Aerojet Rocketdyne Holdings*85. Smiths Detection*19. Spirit Aerosystems53. Korea Aerospace Industries86. Constellium*20. Rockwell Collins54. Oshkosh Defense*87. FACC21. Mitsubishi Heavy Industries Aerospace*55. Avicopter88. Ultra Electronics*22. Harris Corp56. AAR Corp.89. Kongsberg Defence Systems23. Embraer57. Hexcel Corp.*90. Kratos Defense & Security Solutions24. Zodiac58. Eaton Aerospace*91. Magellan Aerospace25. MTU Aero Engines59. MOOG*92. Latécoère SA26. Arconic*60. Allegheny Technologies*93. SKF*27. Dassault Aviation61. ManTech Int’l Corp.94. Kaman Aerospace*28. Kawasaki Aerospace and Gas*62. Maxar Technologies95. Chemring29. Leidos Holdings63. Aselsan A.S.96. JAMCO Corp.30. AviChina Industry & Tech.64. Wesco Aircraft97. Indra Sistemas*31. Singapore Technologies Engineering Ltd.65. KLX Inc.*98. Teledyne Tech*32. Orbital ATK66. Solvay Group*99. Astronics Corp*33. GKN Aerospace*67. Esterline Technologies*100. Ducommun*34. Babcock International*68. Woodward Aerospace*Corp. (AIDC)*Partial company results based on aerospace and defense (A&D) activity, identified by A&D specific business segment where possible. Ranking is based on A&Dindustry-related revenues of the company.Source: Deloitte Global analysis of the 100 major global A&D companies using public company filings and press releases. See the methodology section for furtherinformation and definitions of financial metrics, as well as company name, reports, and dates.4
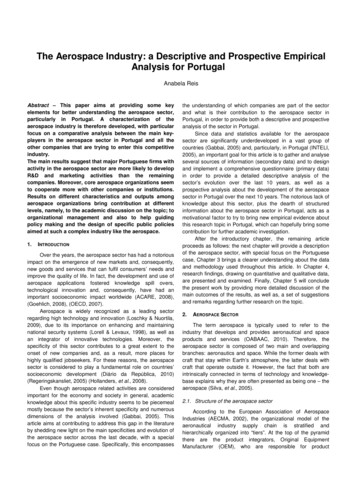
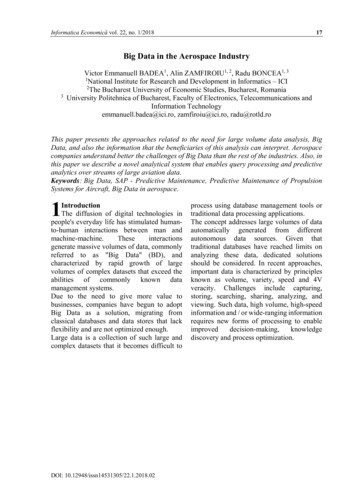
2018 Global aerospace and defense industry financial performance study Global A&D industry:Performance overviewThe revenues of the top 20 global A&D companies accounted for nearly 73.6 percent or US 504.6 billion of the overall A&D industryrevenues in 2017, in line with the 73.8 percent in 2016, which indicates that the industry continues to be concentrated.Figure 4 illustrates revenue, operating profit, and margin performance of the global A&D industry from 2012 to 2017.Figure 4: Global aerospace and defense industry revenue and operating margin: 2012 to 2017 685.6 B2 .73. 82015CAGR2.8%%% 667.3 B2 .4%3. 21.9%2014201620179.1%%0. 8%3. 53%%201312.0 651.7 B- 0.(Profit margin)2012Core operating profit 627.8 B% 616.1 BRevenues 597.0 BCAGR4.9% 58.4 B 65.4 B 67.7 B 67.5 B 68.1 B 74.2 B(9.8%)(10.6%)(10.8%)(10.4%)(10.2%)(10.8%)Note: A&D industry revenue and operating earnings calculations will differ from previous years’ Deloitte Global A&D industry financial performance studies, as the setof companies included in this study is not directly comparable across the years. Also, 2016 and 2017 numbers are based on constant currency basis and 2012 to 2015numbers have been re-calculated using the growth rates for the respective period with 2016 revenues as the base.Source: Deloitte Global analysis of the 100 major global A&D companies using public company filings and press releases. See the methodology section for furtherinformation and definitions of financial metrics, as well as company name, reports, and dates.5
2018 Global aerospace and defense industry financial performance study Figure 5 summarizes the key performance metrics of the global A&D industry. Each performance metric is discussed in detail in thesubsequent sections of this study.Figure 5: Global aerospace and defense industry performance in 2017, as compared to 2016MetricRevenues (US billion)Core operating earnings (US billion)Core operating margin (percent)Return on assets (percent)Free cash flow (FCF) (US billion)FCF margin (percent)Book-to-bill ratioAerospace and defense (A&D) revenue/employee (US )A&D core operating earnings/employee (US )Number of A&D employees20162017Change(2017 versus 2016)US 667.3US 685.62.7%US 68.1US 74.29.1%10.2%10.8%6.2%4.5%5.2%15.9%US 40.7US 51.326.2%6.1%7.5%22.8%1.190.95(20.0%)US 347,817US 355,9972.4%US 35,475US 38,5438.6%1,918,
companies. The 2018 Global aerospace and defense industry financial performance study analyzes the top 100 global A&D companies or those units of industrial conglomerates with A&D businesses that reported revenues of more than US 500 million in 2017. Figure 3 lists the 100 companies and divisions included in the analysis. The study does not