Transcription
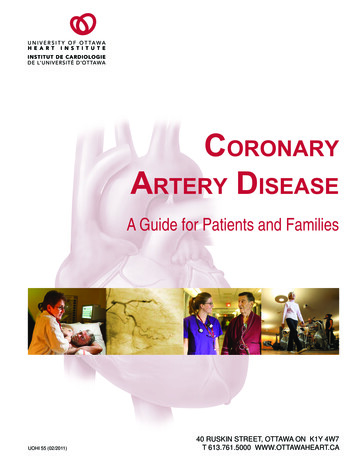
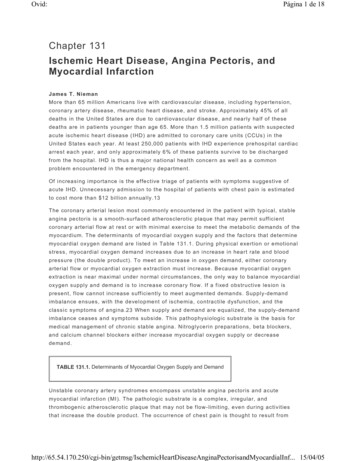
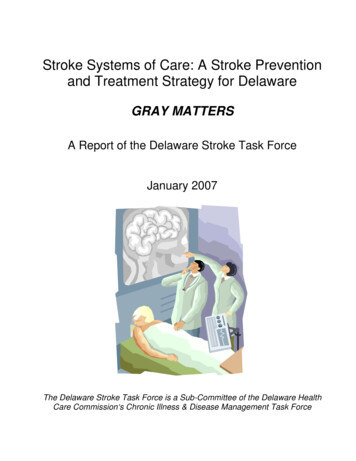
Epi Data Brief, No. 95Page 1November 2017, No. 95Premature Heart Disease and Stroke Deaths among Adults inNew York CityIn 2015, heart disease and stroke together accounted for 24% of all premature deaths (death before age 65)among New York City adults. A person’s risk of dying early from heart disease or stroke is linked to theircumulative lifetime exposure to certain social, economic, and physical environments that dictate access toresources, influence individual behavior, and in some cases, directly increase risk. High blood pressure, highcholesterol, diabetes, and obesity increase the risk of these two conditions as do smoking, an unhealthy diet,high sodium consumption, physical inactivity, and excessive alcohol intake.1,2 The purpose of this report is tohighlight disparities in who is dying early from heart disease and stroke.One in six deaths due to heart disease and stroke occurs among adults before the age of 65 In 2011-2015, 17% of deaths from heart disease occurred among adultsyounger than 65 years of age (13,228 of 79,417 deaths).ο This varied by demographic characteristics with the highest proportionsseen in men (24%), Black adults (26%), adults living in very high povertyneighborhoods (28%), and adults living in the Bronx (22%).In 2011-2015, 21% of deaths from stroke occurred among adults youngerthan 65 years of age (1,696 of 8,112 deaths).ο The proportion of premature deaths from stroke was highest amongmen (30%), Black adults (32%), adults living in very high povertyneighborhoods (30%), and adults living in the Bronx (27%).Race/ethnicity: For the purpose ofthis publication, Latino includespersons of Hispanic origin based onancestry reported on the deathcertificate, regardless of reportedrace; Latino excludes reportedancestry from non-Spanish speakingCentral/South American countries,and non-Spanish speakingCaribbean islands. Black, White,Asian, and Other race categories donot include persons of Latino origin.Racial and ethnic disparities in premature heart disease death rates are greater amongwomen than men OverallPremature death due to heart disease among New York Cityadults, by race and sex, 2011-2015Women In 2011-2015, Black adults had apremature death rate due to heartdisease (77.6 per 100,000) that was 1.8times that of White (42.2 per 100,000),2.1 times that of Latino (36.1 per100,000), and 3.8 times that ofAsian/Pacific Islander adults (20.2 per100,000).Among Black women the rate was 2.4times the rate of White women (51.9vs. 21.8 per 100,000) and 5.6 timesthe rate of Asian/Pacific Islanderwomen (51.9 vs. 9.3 per 100,000).The rate of premature death due to heartdisease in adult men was 2.4 times thatof women (67.3 vs. 27.5 per 100,000).The greatest difference betweenmen and women was seen amongAsian/Pacific Islanders where therate in men was 3.5 times the rate inwomen (32.1 vs. 9.3 per 100,000).Men Overall (N 13,228)White (N 4,033)Black (N 5,309)Latino (N 2,699)Asian/Pacific Islander (N 861)Overall (N 4,168)White (N 1,044)Black (N 2,006)Latino (N 824)Asian/Pacific Islander (N 206)Overall (N 9,060)White (N 2,989)Black (N 3,303)Latino (N 1,875)Asian/Pacific Islander (N 732.105054.1100110.8150Age-adjusted premature death rateper 100,000 adultsAsian/Pacific Islander, Black, and White races exclude Latino ethnicity. Latino includesHispanic or Latino of any race. Race/ethnicity estimates are age-adjusted to the 2000U.S. standard population.Source: Bureau of Vital Statistics, 2011-2015
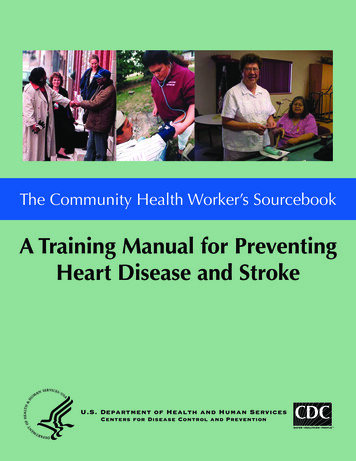
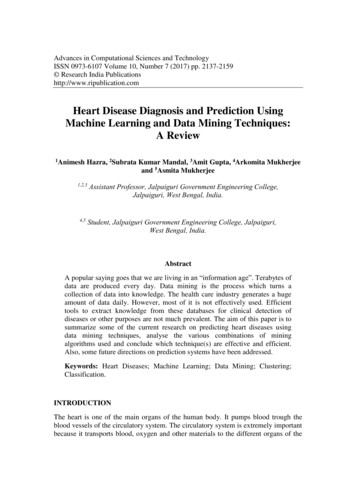
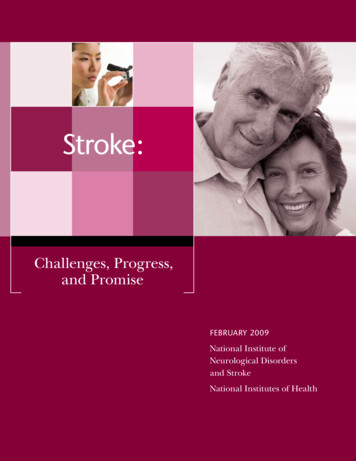
Epi Data Brief, No. 95Page 2The premature death rate due to heart disease is twice as high in very high poverty than lowpoverty neighborhoods In 2011-2015,among adults livingin very high povertyneighborhoods, therate of prematuredeath due to heartdisease was 2.4times that of adultsliving in low poverty(wealthiest)neighborhoods(66.8 vs. 27.9 per100,000).The fiveneighborhoods withthe highest cruderates of prematuredeath due to heartdisease were:Rockaways, BedfordStuyvesant/CrownHeights, East NewYork/New Lots, HighBridge/Morrisania,and Central Bronx.Premature heart disease death rates among adults, byneighborhood, New York City, 2011-2015Heart disease – premature death(rate per 100,000)12.3 - 25.8 25.8 - 39.7 39.7 - 67.1 67.1 - 120.9Airport/ParkVery high poverty areaStatenIslandBronxQueensBrooklynThe United Hospital Fund (UHF) classifies New York City into 42neighborhoods, comprised of contiguous ZIP codes.Very high poverty neighborhoods have 30% of the population living belowthe federal poverty line based on American Community Survey 2011-2015.Rates are not age-adjusted and do not account for neighborhood differencesin age distribution.Source: Bureau of Vital Statistics, 2011-2015Definitions:Neighborhood poverty(based on ZIP code) isdefined as the percentage ofthe population living belowthe Federal Poverty Line (FPL)based on the AmericanCommunity Survey 20112015. Neighborhoods arecategorized into four groupsas follows: “Low poverty”neighborhoods are thosewith 10% of the populationliving below the FPL;“Medium poverty”neighborhoods have 10- 20%of the population below FPL;“High Poverty”neighborhoods have 20- 30%of the population living belowthe FPL; “Very high poverty”neighborhoods have 30% ofthe population living belowthe FPL.Neighborhood: The UnitedHospital Fund classified NewYork City into 42neighborhoods comprised ofcontiguous zip codes.Adults: ages 18 and olderWhile premature heart disease death rates have decreased overall since 2001, the disparitybetween Whites and Blacks has persisted Rates of premature deathHeart disease premature mortality rates, New York City adults, 2001-2015due to heart diseasedecreased by 24% fromWhiteBlackLatinoAsian/1202001 to 2015 (61.0 to 46.4Pacific Islander91.8per 100,000) among NYC10080.4adults, with a higher8058.9reduction in women than60men (31% vs. 21%).41.140From 2001 to 2015, the45.636.2percent decline in premature2028.2heart disease death rates was19.5031%, 30%, 21%, and 12% forAsian/Pacific Islander, White,Asian/Pacific Islander, Black, and White races exclude Latino ethnicity. Latino includes Hispanic or LatinoLatino, and Black adults,of any race. Race/ethnicity estimates are age-adjusted to the 2000 U.S. standard population.respectively.Source: Bureau of Vital Statistics, 2001-2015Between 2006 and 2015, adults living in very high poverty neighborhoods had a smaller decrease inpremature mortality from heart disease compared with adults living in low poverty neighborhoods (18% vs.29%).Age-adjusted premature deathrate per 100,000 adults
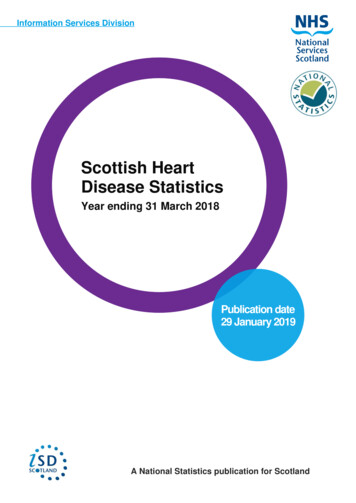
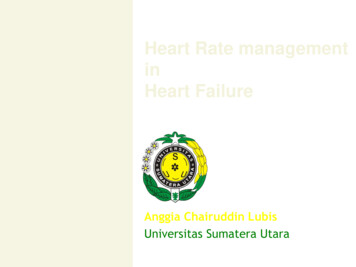
Epi Data Brief, No. 95Page 3Black adults have more than three times the premature death rate due to stroke thanWhites, a finding more pronounced in Black women OverallPremature death due to stroke among New York City adults, by raceand sex, 2011-2015WomenAmong Black adults, the rate ofpremature death due to stroke (10.5per 100,000) was 3.2 times that ofWhite (3.3 per 100,000), 1.8 timesthat of Latino (6.0 per 100,000), and2.4 times that of Asian/PacificIslander adults (4.4 per 100,000).ο Among Black women, the ratewas 3.5 times the rate of Whitewomen (8.8 vs. 2.5 per 100,000)and 2.8 times the rate ofAsian/Pacific Islander women(8.8 vs. 3.2 per 100,000).The premature death rate due tostroke in men was 1.6 times that ofwomen (7.3 vs. 4.7 per 100,000).ο Latino men had 1.9 times thepremature death rate due tostroke of Latino women (8.1vs. 4.2 per 100,000).Men Overall (N 1,696)White (N 315)Black (N 713)Latino (N 450)Asian/Pacific Islander (N 186)Overall (N 715)White (N 121)Black (N 339)Latino (N 167)Asian/Pacific Islander (N 72)Overall (N 981)White (N 194)Black (N 374)Latino (N 283)Asian/Pacific Islander (N 012.6Age-adjusted premature death rateper 100,000 adults15Asian/Pacific Islander, Black, and White races exclude Latino ethnicity. Latino includes Hispanic orLatino of any race. Race/ethnicity estimates are age-adjusted to the 2000 U.S. standard population.Source: Bureau of Vital Statistics, 2011-2015The rate of premature death due to stroke in very high poverty neighborhoods is over threetimes that of low poverty neighborhoods Among adults living invery high povertyneighborhoods, the rateof premature death dueto stroke was 3.4 timesthat of adults living inlow povertyneighborhoods (9.1 vs.2.7 per 100,000).In 2011-2015, the fiveneighborhoods with thehighest crude prematurestroke death rates were:East Harlem, East NewYork/New Lots, CentralBronx, BedfordStuyvesant/CrownHeights, and Flatbush.Premature stroke death rates among adults, by neighborhood, New York City,2011-2015Stroke – premature death(rate per 100,000)Bronx0.6 - 3.0 3.0 - 5.2 5.2 - 8.4 8.4 - 11.3Airport/ParkVery high poverty areaQueensBrooklynStatenIslandThe United Hospital Fund (UHF) classifies New York City into 42 neighborhoods, comprised of contiguousZIP codes.Very high poverty neighborhoods have 30% of the population living below the federal poverty line basedon American Community Survey 2011-2015.Rates are not age-adjusted and do not account for neighborhood differences in age distribution.Source: Bureau of Vital Statistics, 2011-2015
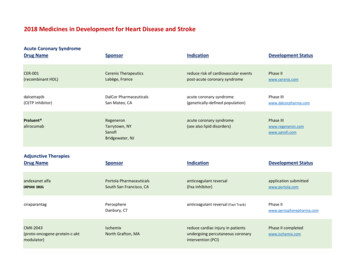
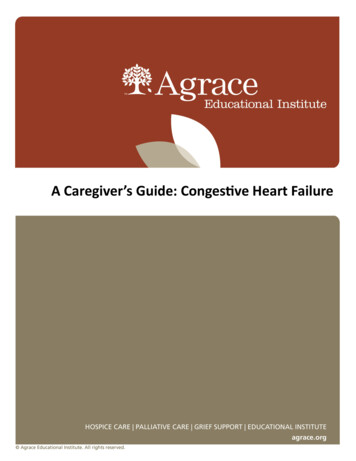
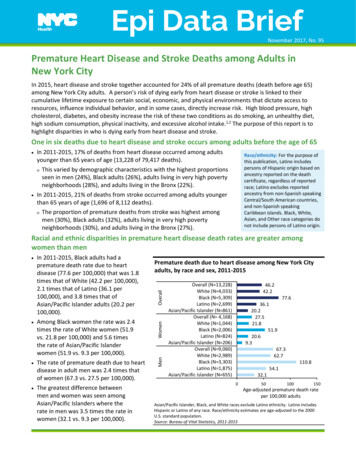
Epi Data Brief, No. 95Page 4The disparity in premature stroke death rates between Whites and Blacks has remainedunchanged over the past 15 yearsAge-adjusted premature deathrate per 100,000 adultsPremature stroke death rates among adults, by race/ethnicity, New York City adults, 2001-2015White20BlackLatinoAsian/Pacific Islander14.4MORE NewYork City Health Data and Publications at nyc.gov/health/data15Visit EpiQuery – the Health Department’s interactive health data system at nyc.gov/health/EpiQuery10.07.710City Department of Health and Mental HygieneNew 0082009201020112012201320142015Asian/Pacific Islander, Black, and White races exclude Latino ethnicity. Latino includes Hispanic or Latino of any race. Race/ethnicity estimates are ageadjusted to the 2000 U.S. standard population.Source: Bureau of Vital Statistics, 2001-2015 Since 2001, rates of premature death due to stroke among White, Black, and Latino adults have decreasedsubstantially (30%, 31%, and 24%, respectively).The decrease in premature death rate among women was more than double that among men (34% vs. 16%).Between 2006 and 2015, adults living in very high poverty neighborhoods had a smaller decrease in the rate ofpremature death from stroke compared with adults living in low poverty neighborhoods (18% vs. 35%).Data Sources:NYC DOHMH Bureau of Vital Statistics 2001-2015: Mortality data on cause of death are defined by the International Classification ofDiseases, Tenth Revision for Heart Disease (ICD10 I00-I09, I11, I13, I20-I51) and for Stroke (ICD10 I60-69).NYC Department of Health and Mental Hygiene Population Estimates modified from US Census Bureau intercensal populationestimates 2000-2015, updated June 2016, were used for denominators in rate calculations.Authors: Victoria Gresia, Melecia Wright, Wenhui Li, John Jasek, Ying Sun, Steve Di Lonardo, Shadi ChamanyAcknowledgements: Sophia Greer, Kinjia HinterlandReferences:1. Centers for Disease Control and Prevention. Heart Disease Risk Factors. Updated August 10, 2015. Last accessed July 31, 2017.https://www.cdc.gov/heartdisease/risk factors.htm2. Centers for Disease Control and Prevention. Heart Disease Risk Factors. Updated January 17, 2015. Last accessed July 31, 2017.https://www.cdc.gov/stroke/risk factors.htmSuggested citation: Gresia V, Wright M, Li W, Jasek J, Sun Y, Di Lonardo S, Chamany S. Premature Heart Disease and Stroke Deaths inNew York City. New York City Department of Health and Mental Hygiene: Epi Data Brief (95); November 2017.MORE New York City Health Data and Publications at nyc.gov/health/dataVisit EpiQuery – the Health Department’s interactive health data system at nyc.gov/health/EpiQueryNew York City Department of Health and Mental Hygiene
Epi Data TablesNovember 2017, No. 95Premature Heart Disease and Stroke Deaths among Adults in NewYork CityData TablesTable 1.Top premature and overall causes of death, New York City adults, 2015Table 2.Overall and premature deaths due to heart disease and stroke, New York City adults, 2011-2015Table 3.Overall and premature deaths due to heart disease and stroke, by sex and race/ethnicity, New York Cityadults, 2011-2015Table 4.Premature deaths due to heart disease, by sex and United Hospital Fund neighborhood, New York Cityadults, 2011-2015Table 5.Premature deaths due to heart disease, overall and by sex, New York City adults, 2001-2015Table 6.Premature deaths due to heart disease, by race, New York City adults, 2001-2015Table 7.Premature deaths due to heart disease, by neighborhood poverty, New York City adults, 2001-2015Table 8.Premature deaths due to Stroke, by sex and United Hospital Fund neighborhood, New York City adults,2011-2015Table 9.Premature deaths due to stroke, overall and by sex, New York City adults, 2001-2015Table 10.Premature deaths due to stroke, by race/ethnicity, New York City adults, 2001-2015Table 11.Premature deaths due to stroke, by neighborhood poverty, New York City adults, 2001-2015Table 12.Deaths due to heart disease, by age group, New York City adults, 2001-2015Table 13.Deaths due to stroke, by age group, New York City adults, 2001-2015Data SourcesNYC Department of Health and Mental Hygiene Bureau of Vital Statistics: Mortality data on cause of death are classified forHeart Disease using Primary diagnosis ICD10 I00-I09, I11, I13, I20-I51 and for Stroke using Primary diagnosis ICD10 I60-69NYC DOHMH Population Estimates: modified from US Census Bureau interpolated intercensal population estimates 2000-2015,updated August 2016, were used for denominators in rate calculations.
DefinitionsRace/ethnicity: For the purpose of this publication, Latino includes persons of Hispanic origin based on ancestry reported onthe death certificate, regardless of reported race; Latino excludes reported ancestry from non-Spanish speaking Central/SouthAmerican countries, and non-Spanish speaking Caribbean islands. Black, White, Asian, and Other race categories do not includepersons of Latino origin.Neighborhood poverty (based on ZIP code) is defined as the percentage of the population living below the Federal Poverty Line(FPL) based on the American Community Survey 2011-2015. Neighborhoods are categorized into four groups as follows: “Lowpoverty” neighborhoods are those with 10% of the population living below the FPL; “Medium poverty” neighborhoods have 10 20% of the population below FPL; “High Poverty” neighborhoods have 20- 30% of the population living below the FPL; “Veryhigh poverty” neighborhoods have 30% of the population living below the FPL.United Hospital Fund neighborhood: The United Hospital Fund (UHF) classifies New York City into 42 neighborhoods,comprised of contiguous ZIP codes. For more information /ah/zipcodetable.pdf.
Epi Data Tables, No. 95New York City Department of Health and Mental HygienePage 2Table 1. Top premature and overall causes of death, New York City adults, 2015Source: Bureau of Vital Statistics 2015primary diagnosis ICD10 I00-I09, I11, I13, I20-I51Data are restricted to NYC residents.Premature deaths, ages 18-64CauseOverall deaths, ages 18 % ofprematuredeathsN1. Malignant neoplasms (Cancer)3,5232. Diseases of heart2,7013. Use of or poisoning by psychoactive substance8804. Diabetes mellitus5005. Accidents except drug poisoning4206. Intentional Self-Harm (Suicide)3857. Human immunodeficiency virus3638. Cerebrovascular disease (Stroke)3329. Chronic liver disease and cirrhosis32710. Assault (Homicide)All Other CausesTotal3032,74812,48228.2Cause% of overalldeathsN1. Diseases of heart16,17032.92. Malignant neoplasms (Cancer)11,69523.87.13. Influenza and pneumonia1,9714.04.02.921.64. Diabetes mellitus1,7653.63.45. Cerebrovascular disease (Stroke)1,7003.53.16. Chronic lower respiratory diseases1,6653.47. Essential hypertension and renal diseases1,0472.12.78. Alzheimer's disease1,0452.12.69. Use of or poisoning by psychoactive substance9341.92.422.0100.010. Accidents except drug doisoningAll Other CausesTotal8971.810,23920.849,128100.0
Epi Data Tables, No. 95New York City Department of Health and Mental HygienePage 3Table 2. Overall and premature deaths due to heart disease and stroke, New York City adults, 2011-2015Source: Bureau of Vital Statistics 2011-2015primary diagnosis ICD10 I00-I09, I11, I13, I20-I51Data are age-adjusted to the US 2000 Standard Population where indicated.Data are resticted to NYC residents.Overall deaths(ages 18 years)Ageadjusteddeath rateNAllHeart diseasePremature deaths(ages 18-64 years)% of overalldeathsNStrokeAgeadjusteddeath rateOverall deaths(ages 18 years)Ageadjusteddeath rateNPremature deaths(ages 18-64 years)% of overalldeathsNAgeadjusteddeath 7.61,04010.627.991219.310011.02.7Asian/Pacific IslanderNeighborhood 21.26.4Very 65.16,405324.488413.850.043522.07918.24.5Staten IslandRates are per 100,000 population.1For the purpose of this publication, Latino includes persons of Hispanic origin based on ancestry reported on the death certificate, regardless of reported race; Latino excludes reported ancestry from non-Spanishspeaking Central/South American countries, and non-Spanish speaking Caribbean islands. Black, White, Asian, and Other race categories do not include persons of Latino origin.2Neighborhood poverty (based on ZIP code) is defined as the percentage of the population living below the Federal Poverty Line (FPL) based on the American Community Survey 2011-2015. Neighborhoods arecategorized into four groups as follows: “Low poverty” neighborhoods are those with 10% of the population living below the FPL; “Medium poverty” neighborhoods have 10- 20% of the population below FPL;“High Poverty” neighborhoods have 20- 30% of the population living below the FPL; “Very high poverty” neighborhoods have 30% of the population living below the FPL.
Epi Data Tables, No. 95New York City Department of Health and Mental HygienePage 4Table 3. Premature deaths due to heart disease and stroke, by sex and race/ethnicity, New York City adults, 2011-2015Source: Bureau of Vital Statistics 2011-2015primary diagnosis ICD10 I00-I09, I11, I13, I20-I51Data are age-adjusted to the US 2000 Standard Population where indicated.Data are resticted to NYC residents.Premature deaths due to heart disease and stroke (ages 18-64 years)Heart diseaseStrokeMenAgeCrude death adjustedratedeath rateNRace/ethnicityWomenMenAgeCrude death adjusteddeath raterateNWomenAgeCrude death adjusteddeath raterateNAgeCrude death adjusteddeath an/Pacific IslanderRates are per 100,000 population1For the purpose of this publication, Latino includes persons of Hispanic origin based on ancestry reported on the death certificate, regardless of reported race; Latino excludes reported ancestry from non-Spanish speaking Central/SouthAmerican countries, and non-Spanish speaking Caribbean islands. Black, White, Asian, and Other race categories do not include persons of Latino origin.
Epi Data Tables, No. 95New York City Department of Health and Mental HygienePage 5Table 4. Premature deaths due to heart disease, by sex and United Hospital Fund neighborhood, New York City adults, 2011-2015Source: Bureau of Vital Statistics 2011-2015primary diagnosis ICD10 I00-I09, I11, I13, I20-I51Data are age-adjusted to the US 2000 Standard Population where indicated.Data are restricted to NYC residents.Premature deaths due to heart disease (ages 18-64 years)MenOverallUHF neighborhoodNeighborhood poverty levelAgeCrude death adjusteddeath raterateNWomenAgeCrude death adjusteddeath raterateNAgeCrude death adjusteddeath raterateNBronxKingsbridge/Riverdale (101)Medium poverty14350.344.89774.667.74629.926.5The Northeast Bronx (102)Medium onx Park (103)Very high ogs Neck (104)High poverty57158.755.640087.085.317133.330.5Very high 07.7110.715743.042.5Crotona/Tremont (105)Highbridge/Morrisania (106)Very high poverty49572.9Hunts Point/Mott Haven (107)Very high poverty28965.970.218287.896.910746.347.7High poverty15531.645.212349.571.13213.219.3Medium 1252.953.0BrooklynGreenpoint (201)Downtown Brooklyn/Heights/Slope (202)High poverty84179.5529113.2East New York/New Lots (204)Very high poverty44575.174.1278103.6104.116751.550.1Sunset Park (205)Very high poverty14832.536.311247.154.33616.518.0Bedford Stuyvesant/Crown Heights (203)High poverty35734.634.526952.152.68817.116.8Flatbush (207)Borough Park (206)Medium poverty55556.952.336784.380.818834.830.8Canarsie and Flatlands (208)Medium poverty35656.648.124889.578.210830.726.0Bay Ridge/Bensonhurst (209)Medium poverty28339.736.520959.355.67420.518.5High poverty53857.649.137884.273.716032.927.4Very high poverty41459.568.527981.9100.213538.041.5Coney Island (210)Williamsburg/Bushwick (211)ManhattanHigh poverty33838.639.124456.360.29421.320.5Central Harlem (302)Washington Heights/Inwood (301)Very high poverty39970.075.524693.1101.115350.053.6East Harlem (303)Very high poverty24966.869.715485.893.39549.249.4Medium poverty19725.824.014440.936.65312.912.4Upper East Side (305)Upper West Side (304)Low ton (306)Medium poverty14723.627.012237.239.4258.510.5Gramercy Park/Murray Hill (307)Low poverty8817.020.47029.233.3186.58.3Greenwich Village/SoHo (308)Low poverty4012.313.82817.118.2127.48.9High poverty24132.435.516345.549.67820.222.2Medium poverty3214.321.21917.224.21311.418.0Lower East Side (309)Lower Manhattan (310)QueensLong Island City/Astoria (401)Medium poverty25331.536.317944.151.07418.621.5West Queens (402)Medium learview (403)Medium tle Neck (404)Ridgewood/Forest Hills (405)Low poverty8228.721.95540.230.92718.113.7Medium poverty30938.134.122657.852.58319.817.4Fresh Meadows (406)Medium poverty11335.831.48355.248.83018.116.2Southwest Queens (407)Medium poverty45650.846.035078.971.810623.421.0Jamaica (408)Medium poverty52354.449.734475.570.817935.431.7Southeast Queens (409)The Rockaways (410)Low poverty24938.833.117658.650.57321.418.2Medium poverty418120.9106.4276171.1149.514276.968.5High poverty14263.158.69486.181.24841.438.1Medium poverty28871.662.818393.683.110550.743.8Staten IslandPort Richmond (501)Stapleton/St. George (502)Willowbrook (503)Low poverty13850.441.89571.861.44330.424.2South Beach (504)Low poverty31652.743.021874.162.49832.124.9Rates are per 100,000 population.Neighborhood poverty (based on ZIP code) is defined as the percentage of the population living below the Federal Poverty Line (FPL) based on the American Community Survey 2011-2015. Neighborhoods are categorized into four groups as follows:“Low poverty” neighborhoods are those with 10% of the population living below the FPL; “Medium poverty” neighborhoods have 10- 20% of the population below FPL; “High Poverty” neighborhoods have 20- 30% of the population living below theFPL; “Very high poverty” neighborhoods have 30% of the population living below the FPL.
Epi Data Tables, No. 95New York City Department of Health and Mental HygienePage 6Table 5. Premature deaths due to heart disease, overall and by sex, New York City adults, 2001-2015Source: Bureau of Vital Statistics, 2001-2015primary diagnosis ICD10 I00-I09, I11, I13, I20-I51Data are age‐adjusted to the US 2000 Standard Population where indicated.Data are restricted to NYC residents.Premature deaths due to heart disease (ages 18-64 years)OverallYearNCrude death rateAge-adjusteddeath rateMenNCrude death rateAge-adjusteddeath rateWomenNCrude death rateAge-adjusteddeath 2,70148.046.41,83967.966.886229.528.1Rates are per 100,000 population
Epi Data Tables, No. 95New York City Department of Health and Mental HygienePage 7Table 6. Premature deaths due to heart disease, by race, New York City adults, 2001-2015Source: Bureau of Vital Statistics, 2001-2015primary diagnosis ICD10 I00-I09, I11, I13, I20-I51Data are age‐adjusted to the US 2000 Standard Population where indicated.Data are restricted to NYC residents.Premature deaths due to heart disease (ages 18-64 years)White, non-LatinoYearAgeCrude death adjustedratedeath rateNBlack, non-LatinoNAgeCrude death adjustedratedeath rateLatinoAgeCrude death adjustedratedeath rateNAsian/Pacific IslanderAgeCrude death adjustedratedeath .456134.836.217620.219.5Rates are per 100,000 population
Epi Data Tables, No. 95New York City Department of Health and Mental HygienePage 8Table 7. Premature deaths due to heart disease, by neighborhood poverty, New York City adults, 2001-2015Source: Bureau of Vital Statistics 2001-2015primary diagnosis ICD10 I00-I09, I11, I13, I20-I51Data are age‐adjusted to the US 2000 Standard Population where indicated.Data are restricted to NYC residents.Premature deaths due to heart disease (ages 18-64 years)Low povertyYearAgeCrude death adjusteddeath raterateNMedium povertyAgeCrude death adjustedratedeath rateNHigh povertyAgeCrude death adjusteddeath raterateNVery high povertyCrude death Age-adjustedratedeath 766.3Rates are per 100,000 popualationNeighborhood poverty (based on ZIP code) is the percentage of residents with incomes below 100% of federal poverty level (FPL), per American Community Survey 2010-14. Categories: Low ( 10% FPL), Medium(10-19% FPL), High (20-29% FPL), Very high ( 30% FPL).
Epi Data Tables, No. 95New York City Department of Health and Mental HygienePage 9Table 8. Premature deaths due to stroke, by sex and United Hospital Fund neighborhood, New York City adults, 2011-2015Source: Bureau of Vital Statistics, 2011-2015primary diagnosis ICD10 I60-69Data are age‐adjusted to the US 2000 Standard Population where indicated.Data are resticted to NYC residents.Premature deaths due to stroke (ages 18-64 years)OverallUHFBronxKingsbridge/Riverdale (101)The Northeast Bronx (102)Fordham/Bronx Park (103)Pelham/Throgs Neck (104)Crotona-Tremont (105)Highbridge/Morrisania (106)Hunts Point/Mott Haven (107)BrooklynGreenpoint (201)Downtown Brooklyn/Heights/Slope (202)Bedford Stuyvesant/Crown Heights (203)East New York/New Lots (204)Sunset Park (205)Borough Park (206)Flatbush (207)Canarsie and Flatlands (208)Bay Ridge/Bensonhurst (209)Coney Island (210)Williamsburg/Bushwick (211)ManhattanWashington Heights/Inwood (301)Central Harlem (302)East Harlem (303)Upper West Side (304)Upper East Side (305)Chelsea/Clinton (306)Gramercy Park/Murray Hill (307)Greenwich Village/SoHo (308)Lower East Side (309)Lower Manhattan (310)QueensLong Island City/Astoria (401)West Queens (402)Flushing/Clearview (403)Bayside/Little Neck (404)Ridgewood/Forest Hills (405)Fresh Meadows (406)Southwest Queens (407)Jamaica (408)Southeast Queens (409)The Rockaways (410)Staten IslandPort Richmond (501)Stapleton/St. George (502)Willowbrook (503)South Beach (504)Neighborhood poverty levelAgeCrude death adjustedratedeath rateNMenAgeCrude death adjustedratedeath rateNWomenAgeCrude death adjustedratedeath ra
heart disease death rates was 31%, 30%, 21%, and 12% for Asian/Pacific Islander, White, Latino, and Black adults, respectively. Between 2006 and 2015, adults living in very high poverty neighborhoods had a smaller decrease in premature mortality from heart disease compared with adults living in low poverty neighborhoods (18% vs. 29%). 58.9 .