Transcription
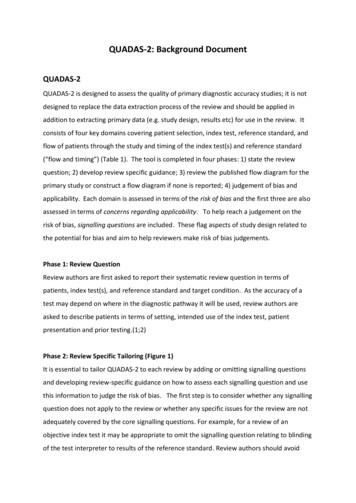
QUADAS-2: Background DocumentQUADAS-2QUADAS-2 is designed to assess the quality of primary diagnostic accuracy studies; it is notdesigned to replace the data extraction process of the review and should be applied inaddition to extracting primary data (e.g. study design, results etc) for use in the review. Itconsists of four key domains covering patient selection, index test, reference standard, andflow of patients through the study and timing of the index test(s) and reference standard(“flow and timing”) (Table 1). The tool is completed in four phases: 1) state the reviewquestion; 2) develop review specific guidance; 3) review the published flow diagram for theprimary study or construct a flow diagram if none is reported; 4) judgement of bias andapplicability. Each domain is assessed in terms of the risk of bias and the first three are alsoassessed in terms of concerns regarding applicability. To help reach a judgement on therisk of bias, signalling questions are included. These flag aspects of study design related tothe potential for bias and aim to help reviewers make risk of bias judgements.Phase 1: Review QuestionReview authors are first asked to report their systematic review question in terms ofpatients, index test(s), and reference standard and target condition. As the accuracy of atest may depend on where in the diagnostic pathway it will be used, review authors areasked to describe patients in terms of setting, intended use of the index test, patientpresentation and prior testing.(1;2)Phase 2: Review Specific Tailoring (Figure 1)It is essential to tailor QUADAS-2 to each review by adding or omitting signalling questionsand developing review-specific guidance on how to assess each signalling question and usethis information to judge the risk of bias. The first step is to consider whether any signallingquestion does not apply to the review or whether any specific issues for the review are notadequately covered by the core signalling questions. For example, for a review of anobjective index test it may be appropriate to omit the signalling question relating to blindingof the test interpreter to results of the reference standard. Review authors should avoid
complicating the tool by adding too many signalling questions. Once tool content has beenagreed, review-specific rating guidance should be developed. The tool should be pilotedindependently by at least two people. If agreement is good, the tool can be used to rate allincluded studies. If agreement is poor, further refinement may be needed.Figure 1: Process for tailoring QUADAS-2 to your systematic reviewPhase 3: Flow DiagramThe next stage is to review the published flow diagram for the primary study or to draw oneif none is reported or the published diagram is not adequate. The flow diagram will facilitatejudgments of risk of bias, and should provide information about the method of recruitmentof patients (e.g. based on a consecutive series of patients with specific symptoms suspectedof having the target condition, or of cases and controls), the order of test execution, and thenumber of patients undergoing the index test and the reference standard. A hand drawndiagram is sufficient as this step does not need to be reported as part of the QUADAS-2assessment. Figure 2 shows an example based on a primary study of B type natriureticpeptide for the diagnosis of heart failure.
Figure 2: Flowchart based on diagnostic cohort study of BNP for diagnosing heart failurePhase 4: Judgments on bias and applicabilityRisk of biasThe first part of each domain concerns bias and comprises three sections: 1) informationused to support the risk of bias judgment, 2) signalling questions, and 3) judgment of risk ofbias. By recording the information used to reach the judgment (“support for judgment”), weaim to make the rating transparent and facilitate discussion between review authorscompleting assessments independently.(3) The additional signalling questions are included
to assist judgments. They are answered as “yes”, “no”, or “unclear”, and are phrased suchthat “yes” indicates low risk of bias.Risk of bias is judged as “low”, “high”, or “unclear”. If all signalling questions for a domainare answered “yes” then risk of bias can be judged “low”. If any signalling question isanswered “no” this flags the potential for bias. Review authors then need to use theguidelines developed in phase 2 to judge risk of bias. The “unclear” category should be usedonly when insufficient data are reported to permit a judgment.ApplicabilityApplicability sections are structured in a similar way to the bias sections, but do not includesignalling questions. Review authors are asked to record the information on which thejudgment of applicability is made and then to rate their concern that the study does notmatch the review question. Concerns regarding applicability are rated as “low”, “high” or“unclear”. Applicability judgments should refer to the first phase, where the review questionwas recorded. Again, the “unclear” category should only be used when insufficient data arereported.The following sections provide brief explanations of the signalling questions and risk ofbias/concerns regarding applicability questions for each domain.DOMAIN 1: PATIENT SELECTIONRisk of bias: Could the selection of patients have introduced bias?Signalling question 1: Was a consecutive or random sample of patients enrolled?Signalling question 2: Was a case-control design avoided?Signalling question 3: Did the study avoid inappropriate exclusions?A study should ideally enrol all consecutive, or a random sample of, eligible patients withsuspected disease – otherwise there is potential for bias. Studies that make inappropriateexclusions, e.g. excluding “difficult to diagnose” patients, may result in overoptimisticestimates of diagnostic accuracy. In a review of anti-CCP antibodies for the diagnosis ofrheumatoid arthritis, we found that some studies enrolled consecutive patients who hadconfirmed diagnoses. These studies showed greater sensitivity of the anti-CCP test than
studies that included patients with suspected disease but in whom the diagnosis had notbeen confirmed – “difficult to diagnose” patients.(4) Similarly, studies enrolling patientswith known disease and a control group without the condition may exaggerate diagnosticaccuracy.(5;6) Exclusion of patients with “red flags” for the target condition, who may beeasier to diagnose, may lead to underestimation of diagnostic accuracy.Applicability: Are there concerns that the included patients and setting do not match thereview question?There may be concerns regarding applicability if patients included in the study differ,compared to those targeted by the review question, in terms of severity of the targetcondition, demographic features, presence of differential diagnosis or co-morbidity, settingof the study and previous testing protocols. For example, larger tumours are more easilyseen with imaging tests than smaller ones, and larger myocardial infarctions lead to higherlevels of cardiac enzymes than small infarctions making them easier to detect and soincreasing estimates of sensitivity.(7)DOMAIN 2: INDEX TESTRisk of Bias: Could the conduct or interpretation of the index test have introduced bias?Signalling question 1: Were the index test results interpreted without knowledge of theresults of the reference standard?This item is similar to “blinding” in intervention studies. Interpretation of index test resultsmay be influenced by knowledge of the reference standard.(6) The potential for bias isrelated to the subjectivity of index test interpretation and the order of testing. If the indextest is always conducted and interpreted prior to the reference standard,this item can berated “yes”.Signalling question 2: If a threshold was used, was it pre-specified?Selecting the test threshold to optimise sensitivity and/or specificity may lead tooveroptimistic estimates of test performance, which is likely to be poorer in an independentsample of patients in whom the same threshold is used.(8)Applicability: Are there concerns that the index test, its conduct, or interpretation differfrom the review question?
Variations in test technology, execution, or interpretation may affect estimates of itsdiagnostic accuracy. If index tests methods vary from those specified in the review questionthere may be concerns regarding applicability. For example, a higher ultrasound transducerfrequency has been shown to improve sensitivity for the evaluation of patients withabdominal trauma.(9)DOMAIN 3: REFERENCE STANDARDRisk of Bias: Could the reference standard, its conduct, or its interpretation haveintroduced bias?Signalling question 1: Is the reference standard likely to correctly classify the targetcondition?Estimates of test accuracy are based on the assumption that the reference standard is 100%sensitive and specific disagreements between the reference standard and index test areassumed to result from incorrect classification by the index test.(10;11)Signalling question 2: Were the reference standard results interpreted without knowledge ofthe results of the index test?This item is similar to the signalling question related to interpretation of the index test.Potential for bias is related to the potential influence of prior knowledge on theinterpretation of the reference standard.(6)Applicability: Are there concerns that the target condition as defined by the referencestandard does not match the question?The reference standard may be free of bias but the target condition that it defines maydiffer from the target condition specified in the review question. For example, whendefining urinary tract infection the reference standard is generally based on specimenculture but the threshold above which a result is considered positive may vary.(12)DOMAIN 4: FLOW AND TIMINGRisk of Bias: Could the patient flow have introduced bias?Signalling question 1: Was there an appropriate interval between index test and referencestandard?
Ideally results of the index test and reference standard are collected on the same patients atthe same time. If there is a delay or if treatment is started between index test and referencestandard, misclassification may occur due to recovery or deterioration of the condition. Thelength of interval leading to a high risk of bias will vary between conditions. A delay of a fewdays may not be a problem for chronic conditions, while for acute infectious diseases ashort delay may be important. Conversely, when the reference standard involves follow-upa minimum follow-up period may be required to assess the presence or absence of thetarget condition. For example, for the evaluation of magnetic resonance imaging for theearly diagnosis of multiple sclerosis, a minimum follow-up period of around 10 years isrequired to be confident that all patients who will go on to fulfil diagnostic criteria formultiple sclerosis will have done so.(13)Signalling question 2: Did all patients receive the same reference standard?Verification bias occurs when not all of the study group receive confirmation of thediagnosis by the same reference standard. If the results of the index test influence thedecision on whether to perform the reference standard or which reference standard is used,estimated diagnostic accuracy may be biased.(5;14) For example, a study evaluating theaccuracy of the D-dimer test for the diagnosis of pulmonary embolism carried outventilation perfusion scans (reference standard 1) in those testing positive and used clinicalfollow-up to determine whether or not those testing negative had a pulmonary embolism(reference standard 2). This may result in misclassifying some of the false negatives as truenegatives as some patients who had a pulmonary embolism but were index test negativemay be missed by clinical follow-up and so be classified as not having a pulmonaryembolism. This misclassification will overestimate sensitivity and specificity.Signalling question 3: Were all patients included in the analysis?All patients who were recruited into the study should be included in the analysis.(15) Thereis a potential for bias if the number of patients enrolled differs from the number of patientsincluded in the 2x2 table of results, for example because patients lost to follow-up differsystematically from those who remain.
Incorporating QUADAS-2 assessments in diagnostic accuracy reviewsWe emphasise that QUADAS-2 should not be used to generate a summary “quality score”,because of the well-known problems associated with such scores.(16;17) If a study isjudged as “low” on all domains relating to bias or applicability then it is appropriate to havean overall judgment of “low risk of bias” or “low concern regarding applicability” for thatstudy. If a study is judged "high" or "unclear" on one or more domains then it may be judged“at risk of bias” or as having “concerns regarding applicability”.At minimum, reviews should present a summary of the results of the QUADAS-2 assessmentfor all included studies. This could include summarising the number of studies that foundlow, high or unclear risk of bias/concerns regarding applicability for each domain. If studiesare found to consistently rate well or poorly on particular signalling questions thenreviewers may choose to highlight these. Tabular (Table) and graphical (Figure 3) displaysare helpful to summarise QUADAS-2 assessments.Table: Suggested tabular presentation for QUADAS-2 resultsStudyPATIENTSELECTIONStudy 1Study 2Study 3Study 4Study 5Study 6Study 7Study 8Study 9Study 10Study 11 Low RiskRISK OF BIASINDEX TEST REFERENCESTANDARD ? High RiskFLOW ANDTIMING ? Unclear Risk APPLICABILITY CONCERNSPATIENTINDEX TEST REFERENCESELECTIONSTANDARD ? ?
Figure 3: Suggested Graphical Display for QUADAS-2 resultsReview authors may choose to restrict the primary analysis so that only studies at low risk ofbias and/or low concern regarding applicability for all or specified domains are included. Itmay be appropriate to restrict inclusion to the review based on similar criteria, but it is oftenpreferable to review all relevant evidence and then investigate possible reasons forheterogeneity.(13;18) Subgroup and or sensitivity analysis can be conducted byinvestigating how estimates of accuracy of the index test vary between studies rated ashigh, low, or unclear on all or selected domains. Domains or signalling questions can beincluded as items in meta-regression analyses, to investigate their association withestimated accuracy.WebsiteThe QUADAS website (www.quadas.org) contains QUADAS-2, information on training, abank of additional signalling questions, more detailed guidance for each domain, examplesof completed QUADAS-2 assessments, and downloadable resources including a MicrosoftAccess database for data extraction, an Excel spreadsheet to produce graphical displaysof results, and templates for Word tables to summarise results.
References(1) Bossuyt PM, Leeflang MMG. Chapter 6: Developing Criteria for Including Studies. In:Deeks JJ, Bossuyt PM, Gatsonis C, editors. Cochrane Handbook for SystematicReviews of Diagnostic Test Accuracy Version 1.0.0. The Cochrane Collaboration;2009.(2) Leeflang MM, Deeks JJ, Gatsonis C, Bossuyt PM. Systematic reviews of diagnostic testaccuracy. Ann Intern Med 2008; 149(12):889-897.(3) Higgins JPT, Altman DG, Gotzsche PC, Juni P, Moher D, Oxman AD et al. TheCochrane Collaboration's tool for assessing risk of bias in randomized trials. BMJ. Inpress 2011.(4) Whiting PF, Smidt N, Sterne JA, Harbord R, Burton A, Burke M et al. Systematicreview: accuracy of anti-citrullinated Peptide antibodies for diagnosing rheumatoidarthritis. Ann Intern Med 2010; 152(7):456-464.(5) Lijmer JG, Mol BW, Heisterkamp S, Bonsel GJ, Prins MH, van der Meulen JH et al.Empirical evidence of design-related bias in studies of diagnostic tests. JAMA 1999;282(11):1061-1066.(6) Whiting P, Rutjes AW, Reitsma JB, Glas AS, Bossuyt PM, Kleijnen J. Sources ofvariation and bias in studies of diagnostic accuracy: a systematic review. Ann InternMed 2004; 140(3):189-202.(7) Reitsma J, Rutjes A, WP, Vlassov V, Leeflang M, Deeks J. Chapter 9: Assessingmethodological quality. In: Deeks JJ, Bossuyt PM, Gatsonis C, editors. CochraneHandbook for Systematic Reviews of Diagnostic Test Accuracy Version 1.0.0. TheCochrane Collaboration; 2009.(8) Leeflang MM, Moons KG, Reitsma JB, Zwinderman AH. Bias in sensitivity andspecificity caused by data-driven selection of optimal cutoff values: mechanisms,magnitude, and solutions. Clinical Chemistry 2008; 54(4):729-737.(9) Stengel D, Bauwens K, Rademacher G, Mutze S, Ekkernkamp A. Association betweencompliance with methodological standards of diagnostic research and reported testaccuracy: meta-analysis of focused assessment of US for trauma. Radiology 2005;236(1):102-111.(10) Biesheuvel C, Irwig L, Bossuyt P. Observed differences in diagnostic test accuracybetween patient subgroups: is it real or due to reference standard misclassification?Clin Chem 2007; 53(10):1725-1729.(11) van Rijkom HM, Verdonschot EH. Factors involved in validity measurements ofdiagnostic tests for approximal caries--a meta-analysis. Caries Research 1995;29(5)):364-70.
(12) Whiting P, Westwood M, Bojke L, Palmer S, Richardson G, Cooper J et al. Clinicaleffectiveness and cost-effectiveness of tests for the diagnosis and investigation ofurinary tract infection in children: a systematic review and economic model. HealthTechnol Assess 2006; 10(36):iii-xiii, 1.(13) Whiting P, Harbord R, Main C, Deeks JJ, Filippini G, Egger M et al. Accuracy ofmagnetic resonance imaging for the diagnosis of multiple sclerosis: systematicreview. BMJ 2006; 332(7546):875-884.(14) Rutjes A, Reitsma J, Di NM, Smidt N, Zwinderman A, Van RJ et al. Bias in estimates ofdiagnostic accuracy due to shortcomings in design and conduct: empirical evidence[abstract]. XI Cochrane Colloquium: Evidence, Health Care and Culture; 2003 Oct 2631; Barcelona, Spain 2003;45.(15) Macaskill P, Gatsonis C, Deeks JJ, Harbord R, Takwoingi Y. Chapter 10: Analysing andpresenting results. In: Deeks JJ, Bossuyt PM, Gatsonis C, editors. CochraneHandbook for Systematic Reviews of Diagnostic Test Accuracy Version 1.0.0. TheCochrane Collaboration; 20010.(16) Juni P, Witschi A, Bloch R, Egger M. The hazards of scoring the quality of clinical trialsfor meta-analysis. JAMA 1999; 282(11):1054-1060.(17) Whiting P, Harbord R, Kleijnen J. No role for quality scores in systematic reviews ofdiagnostic accuracy studies. BMC Med Res Methodol 2005; 5:19.(18) Whiting PF, Weswood ME, Rutjes AW, Reitsma JB, Bossuyt PN, Kleijnen J et al.Evaluation of QUADAS, a tool for the quality assessment of diagnostic accuracystudies. BMC Medical Research Methodology 2006; 6:9.
addition to extracting primary data (e.g. study design, results etc) for use in the review. It consists of four key domains covering patient selection, index test, reference standard, and flow of patients through the study and timing of the index test(s) and reference standard ("flow and timing") (Table 1).
