Transcription
Maker/taker pricing andhigh frequency tradingEconomic Impact Assessment EIA12Foresight, Government Office for Science
Maker/taker pricing and high frequency tradingContents1.2.3.Objective . 3Background . 3Existing make/take fee structure . 53.1. European (MiFID) vs. U.S. (Reg-NMS) Securities Regulation . 53.2. Theoretical research on maker/taker pricing . 63.3. Empirical evidence on the impact of maker/taker pricing . 74. Risk assessment . 155. Options. 166. Costs, risks, and benefits . 166.1. Dynamic maker/taker fees . 176.2. Periodic call auctions . 176.3. Cum fee pricing . 176.4. New order protection/best execution rules . 187. Future. 188. Summary and recommendation . 19References . 201
Maker/taker pricing and high frequency tradingMaker/taker pricing and high frequencytradingRyan Riordan(Karlsruhe Institute of Technology)Andreas Park(University of Toronto)14 February 2012This review has been commissioned as part of the UK Government’s ForesightProject, The Future of Computer Trading in Financial Markets. The viewsexpressed do not represent the policy of any Government or organisation.2
Maker/taker pricing and high frequency trading1. ObjectiveWhat are the costs, benefits and risks of implementing maker-taker fees in the presence ofhigh frequency traders? We present a view on the interaction of maker/taker fees and highfrequency trading on financial markets. High frequency traders engaging in both market makingand active trading strategies are increasingly driving trading volume in financial markets.Trading platforms, in turn, are offering innovative fee structures to attract high frequency andother trading volume. The most common new fee structures employ maker/taker fees thatcharge asymmetric fees to participants who demand and supply liquidity. Typically, marketsoffer a rebate to those participants’ who supply liquidity and charge a fee to those who demandliquidity. These new fee structures have lead to a concern that high frequency traders are theprime beneficiaries of these fee rebates due to their ability to (almost) always place their ordersat the top of the queue.2. BackgroundOver the last decade, the equity trading landscape has changed fundamentally. Stocks thatcould once be traded only on a national, primary listing exchange, can now be traded onseveral international exchanges as well as on a variety of new, upstart alternative tradingvenues. As trading becomes fragmented across different markets, trading platforms must findways to compete in order to attract volume. One of the key areas of competition has been thefees that venues charge traders for executing transactions on their platform.Today, public trading is almost exclusively organized via so-called electronic limit order books.The underlying trading mechanism collects the passive limit orders that cannot executeimmediately and sorts them by price and then by time. These orders form the order book andgive other traders the opportunity to initiate a transaction in the sense that traders can send an“active”, marketable order to be executed against orders in the book. The passive ordersprovide liquidity to the market, active orders remove liquidity from the market. One importantdifference between trading in a limit order book and old-fashioned human-touch market makingis that electronic limit order books rely on the voluntary provision of liquidity. In competing forvolume, trading venues must entice traders to supply liquidity on their platforms. To attractliquidity, many trading platforms, in particular the new, upstart alternative trading systems, nowdirectly subsidize the provision of liquidity by paying passive orders, that are hit by activeorders, a fee rebate (and subsequently charging the active order a positive fee). Since theliquidity providing passive trader is a maker of liquidity and the active trader is a taker ofliquidity, this practice of charging asymmetric fees is commonly referred to as maker/takerpricing.The structural move of trading away from human interaction to electronic trading facilitatedanother major change: with electronic limit order books, traders can implement their tradingstrategies using computer algorithms. Computerized trading now vastly dominates trading onpublic venues and makes up close to 50% of dollar trading volume on public equity exchanges(Securities and Exchange Commission, January 14, 2010).At first sight, algorithmic trading and maker/taker pricing appear to be separate issues. The twoare, however, linked, conditional on other factors, because maker rebates have helped toestablish a new business model, by which computer algorithms act as de facto market makersby posting limit orders on both sides of the market at very high frequency with the dominantpurpose of capturing maker rebates. For instance, in its concept release on market structurethe SEC writes3
Maker/taker pricing and high frequency trading“Highly automated exchange systems and liquidity rebates have helped establish abusiness model for a new type of professional liquidity provider that is distinct from themore traditional exchange specialist and over-the-counter (“OTC”) market maker.” (S.E.C.“Concept Release on Equity Market Structure”, Release No. 34-61358; File No. S7-0210.)Some trading venues have, in fact, designed their fee schedules specifically to attract highfrequency market-making traders (e.g. the Toronto Stock Exchange has a special rebateprogram for “electronic liquidity providers”).Modern securities markets are now often organized as electronic limit order markets. In limitorder markets executions occurs when submitted orders “cross” (active) the price of an ordersitting passively in the book. The submitted order that crosses is typically referred to as amarket, or a marketable order, and is thought to consume the liquidity provided by the passiveorder resting in the book. The market order is the market taker and the passive limit order isreferred to as the market maker. Markets typically enforce price-time priority, however, timepriority has lost importance in fragmented markets.The dominance of computerized and, in particular, high frequency trading and market making(henceforth HF trading and HF market making) is a hotly debated issue among professionaltraders, regulators, academics, and the general public. As maker/taker pricing is seen as amajor facilitating factor to the emergence of high frequency trading, trading fees have becomean integral part of the debate.There are two main concerns that are commonly voiced with regard to high frequency marketmaking. First, “HFTs crowd out traditional traders and harm aggregate welfare”. Morespecifically, the concern is the following. HFTs are systematically faster at posting limit ordersin the book, especially when it is beneficial to do so. Slow, traditional investors then find itdifficult to obtain executions through passive limit orders. Further, when they obtain anexecution these executions are on economically unfavorable terms (loosely, they execute onlywhen HFTs disappear, indicating that trading at that point is particularly costly, for instance,because of an upcoming information event). To obtain executions, slow investors may thus beforced to trade with active (market) orders for which they have to pay (a) the bid-ask spreadand (b) the taker fee. Another way to put this concern is to say that high frequency traders“squeeze themselves between” two “natural” traders to establish themselves as (unwanted)intermediaries. While the advent of the high frequency market making business model mayhave created some losers, the aggregate welfare implications of this development are notnecessarily negative. More generally, economists usually don’t worry if a party establisheditself in a market and, by superior technology, is able to benefit from less nimble parties.However, if the slow investors choose to stay out of a market, possible gains from trade are nolonger realized and these foregone gains from trade lead to a loss in aggregate welfare. Thecomplaint with regard to maker/taker fees in this context is that without the fee rebates,passive, liquidity providing HF strategies would not be profitable so that, allegedly, theexistence of fee rebates has lead to lowered welfare.The second concern raised with regard to high frequency market making is that “HFTs supplyliquidity only in calm markets when it is cheap, that they disappear during periods of marketstress, and that, by disappearing suddenly, they exacerbate market turbulences (or they mayeven create artificial market crashes”. Arguably, if, in markets that rely heavily on HF liquidity4
Maker/taker pricing and high frequency tradingprovision, too many HFTs reduce their intermediation activities simultaneously, large-scaleprice movements are possible. Even though HF activities are not solely to blame,1 the May 6,2010 “Flash Crash” marks one example where liquidity providers disappeared suddenly and inlarge numbers. The concern is thus that if the continuous provision of liquidity cannot beguaranteed, we may see many more mini (flash) price crashes or jumps that are related purelyto sudden changes in the demand and supply of liquidity and not to fundamental information.The question that arises is whether maker/taker fees may play a positive role in this context.In the following we will synthesize the existing, though sparse evidence on the impact ofmaker/taker pricing on trading in general and on high frequency trading in particular.3. Existing make/take fee structureIn general, trading platforms earn revenues by charging investors a fee to trade on theirplatform. Markets are interested in maximizing revenues and thus seek to attract volume totheir platform. There are two ways to organize fee structures. Fees can be:1. Symmetric in the sense that the maker and taker pay the same fee per transaction2. Asymmetric in the sense that the maker and taker pay different fees.The London Stock Exchange and TMX Select (the Toronto Stock Exchange’s own AlternativeTrading System) are examples of platforms that charges symmetric fees. Asymmetric fees arecharged on most public U.S. and European alternative trading systems, e.g., NASDAQ, Chi-X,BATS, etc. The most common format charges takers a positive fee and gives makers a rebate.There are also “inverse” schemes under which makers are charged a positive fee and takersreceive a rebate (e.g., Chi-X Canada employs such pricing for TSX Venture securities).In addition to the fee structure market operators price transactions based on1. the number of shares traded in the transaction, or2. the dollar value of the transaction.Some market operators provide further rebates or reduced rates based on the total value orvolume traded. Finally, some platforms have special programs for computerized trading;examples are Deutsche Börse’s Automated Trader Program, NYSE Euronext’s Pack Epsilon,or the Toronto Stock Exchange’s Electronic Liquidity Provider Program.3.1. European (MiFID) vs. U.S. (Reg-NMS) Securities RegulationThe current regulatory environments in U.S. and Europe are different with respect to orderprotection and best-execution rules, both of which are important when studying maker takerfees. Order-protection and best execution rules go hand in hand. The U.S. regulatory systemprovides “top of book” protection. Orders that are not explicitly routed are routed to the marketwith the best available price, regardless of the number of shares and number of sharesavailable at that price. In the U.S. algorithms take this into account when routing their orders1SEC-CFTC findings regarding the market events of May 6th, 2010 released September 10th, 2010 available athttp://www.sec.gov/news/studies/2010/ marketevents-report.pdf.5
Maker/taker pricing and high frequency tradingand optimally split their orders to reduce their execution costs. Retail investors are for the mostpart left to their own devices.Under MiFID brokers are under the obligations to enforce a best-execution policy on overallbasis. Brokers are required to produce and publish a set of rules by which they abide whenrouting client orders. Best-execution is not enforced on an order-by-order basis, as in the U.S.under Reg-NMS but is evaluated yearly. Another key difference between Reg-NMS and MiFIDis that in the U.S. exchanges are responsible for ensuring order-protection and therefore bestexecution. In Europe brokers are responsible for ensuring that orders are routed to the bestvenues. This leads to the third key differentiating factors, under Reg-NMS best execution isone-dimensional; price. Under MiFID best execution is multi-dimensional and includes price,speed of execution, reliability and other qualitative factors. These differences make comparisondifficult with respect to the impact of maker/taker fees on the various stakeholders.3.2. Theoretical research on maker/taker pricingTheoretically, it is not clear why the breakdown of the total exchange fee between makers andtakers of liquidity should have real economic consequences. Instead one can make anargument that the breakdown should be irrelevant. Imagine that an exchange, which used tocharge a symmetric fee, switches to provide makers with a rebate, but holds constant the totalfee (taker fee minus maker rebate). One key feature of a limit order book is that traders candecide whether they want to post a limit order (and thus supply liquidity) or whether they wantto trade with a market order (and thus demand liquidity). Ceteris paribus, limit orders becomecheaper and some traders will switch from market to limit orders. Yet, this lowers the executionprobability of limit orders and thus traders will post better prices to attract a market order. Ifthere are no frictions, so that the price can adjust infinitely finely, liquidity providing traders willimprove prices to the point where the benefit from the rebates is exactly consumed by thenarrowed bid-ask spread. In other words, absent frictions, the introduction of an asymmetric feeshould leave the true economic costs of a market order unaffected. Moreover, there should beno effect on trader behavior or on liquidity provider entry, assuming that the total exchange fee,i.e. the difference between the taker fee and the maker rebate, remains unchanged. This pointwas also made in a survey by, Harris, and Spatt (2010).Colliard and Foucault (2011) provide a theoretical model that builds on this argument. Theystudy a limit order market in which investors can be buyers or sellers and choose either limitorders (liquidity supply) or market orders (liquidity demand) to execute their trading strategies.Traders meet on a trading platform that charges a fee per transaction, split asymmetricallybetween makers and takers. The platform selects the total fee and its maker/taker breakdownto maximize its expected profit. In their analysis, Colliard and Foucault carefully distinguishbetween the raw bid-ask spread and cum fee bid-ask spreads. The raw bid-ask spread is thedifference between the lowest posted ask price and the highest posted bid price. The cum feebid-ask spread adjusts the raw spread by the taker fees. Practitioners sometimes refer to thecum-fee spread as the “economic” spread as it reflects the true transaction cost of an activetrader. Assuming a zero tick size, Colliard and Foucault develop a number of empiricalpredictions; the key one relating to this survey is that the fee breakdown does not affecttraders’ ex ante welfare in the sense that the breakdown does not affect the cum fee bid-askspread (as long at the total fee stays constant), even though it does affect the raw spread.Colliard and Foucault thus prove an irrelevance result with regards to the impact of maker/takerpricing on cum-fee bid ask spreads. Importantly for the analysis of fragmented markets, theyalso show that their irrelevance result extends when investors can choose between multipletrading platforms, because investors would always route their orders to the venue with the6
Maker/taker pricing and high frequency tradingtightest cum-fee spreads. Moreover, as long as they charge the same total fee, platforms withdifferent make/take breakdowns can coexist.Foucault, Kadan and Kandel (2010), henceforth FKK, provide further theoretical insights, forinstance when there is a minimum tick size. In their framework, makers and takers of liquidityassume fixed roles but differ by the intensity with which they monitor the market. FKK showthat trading platforms can use maker/taker fees to increase the rate at which buyers and sellersmeet in the market. As trades involve realizations of gains from trade, FKK’s results thus implythat maker/taker fees, when used appropriately, can lead to an increase in aggregate welfare.The minimum tick size, in fact, plays an important role, as FKK show that, when the tick sizevanishes, the same irrelevance result as in Colliard and Foucault applies. FKK thus deliver twoimportant insights for regulation: first, make/take fees can increase welfare, and, second,abolishing minimum tick sizes may prevent the positive impact of make/take fees.The intuition for FKK results is as follows. They interpret the liquidity supplying side asproprietary-trading firms specialized in high frequency market making and the liquiditydemanding side as brokers using smart routers to execute market orders when the bid-askspread is narrow. In their model the liquidity makers and takers react at different frequencies tochanges in the limit order book. These differences can lead to an imbalance in the supply anddemand for liquidity, in that the speed at which transient decreases in liquidity are replenishedand the speed at which liquidity takers hit competitive quotes. These imbalances cause gainsfrom trade to be unrealized. FKK then show that maker/taker fees can be used to generatemore trades. For instance, if the level of competition among makers is low compared to thatamong takers or if makers have higher monitoring costs than takers, then a maker rebate canmotivate makers to be more vigilant in their market monitoring activities. With a rebate, theywould replenish the order book faster after liquidity was removed, and with improved liquidity inthe book, the trading rate increases.Colliard and Foucault’s (2011) findings provide an important theoretical benchmark. Yet realmarkets have a number of frictions. For instance, many markets have a minimum tick size sothat the traders may not be able to adjust the cum-fee spread to exactly offset changes in themake/take fee breakdown (as long as the tick size isn’t always binding, one could imagine thattheir model may be extended to allow traders to generated a non-discrete tick-size across timeby varying the bid-ask spread). Furthermore, there may be differences in how the brokers, whopay the trading platform in the first place, pass on the fees to their customers. Brokers mayalso receive payments for specific order flows, which may affect the choice of venue wherethey route an order. Finally, current market regulations create frictions by how they affect orderrouting. So-called order protection rules (as in place in the U.S. or in Canada) require thatorders are routed to the venue that displays the best prices – but these best prices are raw,and not cum fee.Overall, these two theoretical papers provide important positive and normative benchmarksthat need to be explored empirically.3.3. Empirical evidence on the impact of maker/taker pricingMalinova and Park (2011) provide empirical evidence on impact of maker/taker fees, and theirdetailed dataset allows them to examine a number of questions and contentious issues inpolicy debates. Namely, they study how the introduction of maker rebates affected marketquality, the level of competition among liquidity providers, the trading costs of retail traders, andthe degree of intermediation. They further address whether after the introduction of make/takefees, some parties trade on the active side more often.7
Maker/taker pricing and high frequency tradingMalinova and Park study the introduction of liquidity rebates on the Toronto Stock Exchange in2005. At the time, only a subset of the listed securities switched to a fee structure that gavemakers of a liquidity a rebate of 2.75 for a 1,000 share trade and that charged the taker a feeof 4 for a 1,000 share trade. The majority of stocks remained at the old regime (though therewas a minor decline in fees), according to which only the taker was charged of 1/55% of thevalue of the transaction and the maker paid no fee. The 2005 (partial) introduction is thus aclean experiment that allows Malinova and Park to employ a difference-in-differences eventstudy analysis.Overall they find that the introduction of liquidity rebates led to decreased raw spreads,increased depth, increased volume, and an increase in the competition for liquidity supply.Moreover, identifying a subset of stocks for which the total fee is (almost) constant they showthat, consistent with Colliard and Foucault, the cum-fee spreads did not change even thoughthe make/take fee breakdown changed strongly. On the other hand, they also observe that thebenefit to liquidity providers, measured by the realized spread increased, caused by thecombination of the maker rebate and a reduced price impact. Thus even though the breakdowndid not affect the cum fee spread, it does have an impact on other important tradingparameters.Regulators are particularly concerned about retail investors. Malinova and Park’s data detailstrades to the level of trading desks, and they thus identify traders that manage retail flow bytrading characteristics. Malinova and Park show that while the group of retail traders is on theactive (taker) side of the market more often after the fee change, they experienced no changein their net costs of trading. These net costs were computed as the active cum fee spread costsminus passive cum rebate benefits. Finally, identifying those traders who provide sufficientliquidity so that they can be counted as intermediaries, they show that there is evidence for anincrease in intermediation.Although there was computerized trading in Canada in 2005, naturally there was much lesssuch trading compared to today’s markets. Still, it is arguably possible that market participantsprogrammed some algorithms to take advantage of the new passive fee rebates. And whileMalinova and Park’s analysis shows that, at the time, the introduction of fee rebates led to animprovement of many aspects of market quality, the increased active to passive ratio for retailtraders and the increase in intermediation raise some concerns and indicate that there may besome developments that require monitoring in future research.2Battalio, Shkilko, and Van Ness (2011) (hereafter BSVN) study maker/taker pricing in the U.S.options markets. They compare trading costs for two different market structures. One, in whichmaker/taker fees are used to finance liquidity provision, and another, in which liquidity issupplied by market makers who make profits by skimming retail orders via a practice known as“Payment for Order Flow” (PFOF). BSVN find that raw trading costs are about 80 basis pointshigher in the PFOF structure. Nonetheless, cum-fee costs are actually higher in the markertaker structure, by about 74 basis points. When BSVN account for the amount of payment fororder flow (that brokers likely disburse to their customers), trading costs under PFOF appear2Biais, Foucault and Moinas (2011) provide a theoretical framework to formalize some of these concerns. Theyprovide a model with slow non-HF and fast HF traders, and they study the decision of market participants tobecome HF. In equilibrium, there is overinvestment in HF technology, and for a non-negligible portion of theparameter set, non-HF traders abstain from trading. These traders would generally benefit from trading, and there isthus a loss of welfare.8
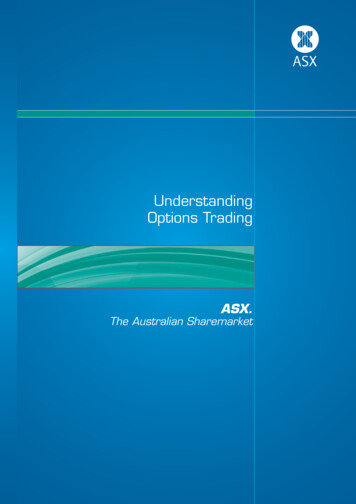
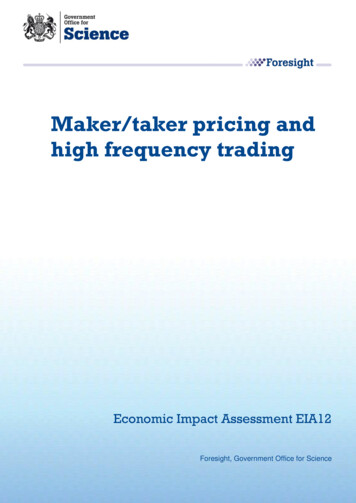
Maker/taker pricing and high frequency tradinglower by 249 basis points. BSVN findings thus highlight the importance of assessing executionquality including all fees. BSVN however caution that the lower cum-fee liquidity costs in thePFOF structure should not be taken as direct evidence of the superiority of this structure overthe maker/taker structure. Rather the lower cum-fee costs are likely the result of creamskimming of retail orders by the PFOF market makers. It is important to note that HFT is not aspervasive in the options markets as it is in the equity markets (Chapman, 2011). Therefore,BSVN results may be more attributable to the effects of the market structure and less so to theeffects of HFT.There are concerns that asymmetric maker/takers fees, particularly rebates, are of particularbenefit to HFT and not benefitting the market overall in terms of more and better liquidity.Menkveld (2011) describes the activities of one HF market maker that operates as a marketmaker on Chi-X and the Euronext. Euronext uses a standard symmetric pricing scheme,whereas Chi-X uses an asymmetric maker/taker fee structure. In both markets the HFToperates primarily as a market maker: roughly 78% of their trades are passive in both markets.The gross spreads earned by the HFT are 2.09 on the Euronext and 2.52 on Chi-X. Theaverage Chi-X rebate for passive trades is 0.31 and the average Euronext passive charge is 0.68. The fee difference is 0.99 and is quite large considering the size of the gross spread,suggesting that fees are of first-order importance for market makers. When one includes theclearing and settlement fees differences between Euronext and Chi-X, the cost/benefitdifference becomes even larger.9
Maker/taker pricing and high frequency tradingTable 4: Net spread decompositionThis table decomposes the high-frequency trader’s net spread result (reported in Table 2) along three dimensions: (i) incumbent market (Euronext) versus entrant market (Chi-X), (ii) side of the trade, passiveliquidity-producingthe HFT is(2011).the limitThisordertablein the bookthat gets executed)or spreadaggressiveforliquidityTable1. Taken from(i.e.,Menkvelddecomposesthe neta highconsuming,frequency(iii) (gross) spreadperontradevs.Euronext,fee per trade.Chi-XFor eachsizeongroup,it reportsthe variable averagetradertheandbothmarkets.and in brackets the cross-sectional range, i.e., the group’s minimum and maximum value.variablelarge stocks small stockspanel A: high-frequency trader in both marketsentrant market (Chi-X) trade share (%)49.856.5(43.7, 62.8)net spread per trade (e )#trades per day1.68(0.76, 2.15)0.80(0.25, 1.64)panel B: high-frequency trader in incumbent market (Euronext)770180(216, 1189)fraction of passive trades (%)79.5(70.5, 82.5)net spread per trade (e )0.72(0.09, 1.27)net spread per trade, passive orders (e )1.26(0.31, 2.03)gross spread per trade, passive orders (e )exchange fee per trade, passive orders (e )clearing fee per trade, passive orders (e )2.25(1.25, 2.99) 0.68( 0.71, 0.65) 0.30( 0.32, 0.29) 1.35net spread per trade, aggressive orders (e )( 2.21, 0.80)gross spread per trade, aggressive trades (e )exchange fee per trade, aggressive orders (e )clearing fee per trade, aggressive orders (e )#trades per day(51.6, 63.6) 0.39( 1.28, 0.17) 0.67( 0.70, 0.63) 0.29( 0.30, 0.26)(48, 276)70.0(58.7, 81.6) 0.07( 0.44, 1.01)0.23(0.05, 1.50)1.17(0.97, 2.44) 0.64( 0.66, 0.62) 0.30( 0.31, 0.29) 0.75( 1.12, 0.23)0.16( 0.23, 0.66) 0.63( 0.64, 0.62) 0.28( 0.29, 0.27)panel C: high-frequency trader in entrant market (Chi-X)812135(128, 1269)fraction of passive trades (%)77.1(71.4, 81.8)net spread per trade (e )2.63(1.88, 3.17)net spread per trade, passive orders (e )2.63(1.97, 3.15)gross spread per trade, passive orders (e )exchange fee per trade, passive orders (e )clearing fee per trade, passive orders (e )net spread per trade, aggressive orders (e )2.46(1.97, 3.05)0.34(0.18, 0.45) 0.16( 0.18, 0.14)2.61(1.51, 3.36)gross spread per trade, aggressive trades (e )exchange fee per trade, aggressive orders (e )clearing fee per trade, aggressive orders (e )3.30(1.91, 4.11) 0.48( 0.61, 0.18) 0.21( 0.22, 0.19)(45, 183)83.3(79.0, 90.7)1.92(1.46, 3.05)1.87(1.46, 3.14)1.90(1.49, 3.17)0.16(0.11, 0.21) 0.19( 0.22, 0.17)2.21
strategies using computer algorithms. Computerized trading now vastly dominates trading on public venues and makes up close to 50% of dollar trading volume on public equity exchanges (Securities and Exchange Commission, January 14, 2010). At first sight, algorithmic trading and maker/taker pricing appear to be separate issues. The two