Transcription
Open Access OriginalArticleDOI: 10.7759/cureus.13499Proteomic Analysis of Cardioembolic and LargeArtery Atherosclerotic Clots Using Reverse PhaseProtein Array Technology Reveals Key CellularInteractions Within Clot MicroenvironmentsMehdi Abbasi 1 , Sean Fitzgerald 2 , Jennifer Ayers-Ringler 1 , Virginia Espina 3 , Claudius Mueller 3 , SallyRucker 3 , Ramanathan Kadirvel 1 , David Kallmes 1 , Waleed Brinjikji 41. Radiology, Mayo Clinic, Rochester, USA 2. Physiology, National University of Ireland Galway, Galway, IRL 3. Centerfor Applied Proteomics and Molecular Medicine, George Mason University, Manassas, USA 4. Neuroradiology, MayoClinic, Rochester, USACorresponding author: Mehdi Abbasi, abbasi.mehdi@mayo.eduAbstractThrombus characteristics are dependent on clot composition, but identification of the etiology based onhistological analysis has proved inconclusive. Identification of proteomic signatures may help todifferentiate between clots of different etiologies such as cardioembolic, large artery atherosclerotic, andother known etiologies, information that could enhance an individualized medicine approach to secondarystroke prevention. In this study, total protein extracts from cardioembolic (n 25) and large arteryatherosclerotic (n 23) thrombus specimens were arrayed in quadruplicate on nitrocellulose slides andimmunostained for 31 proteins using a Dako Autostainer (Agilent Technologies, Inc., Santa Clara, USA). Wequantified 31 proteins involved in platelet and/or endothelial function, inflammation, oxidative stress, andmetabolism. Pathway analysis showed more heterogeneity and protein network interactions in thecardioembolic clots but no specific correlations with clot etiology. Reverse-phase protein arrays are apowerful tool for assessing cellular interactions within the clot microenvironment and may enhanceunderstanding of clot formation and origination. This tool could be further explored to help in identifyingstroke etiology in large vessel occlusion patients with embolic stroke of an undetermined source.Categories: Neurology, PathologyKeywords: endocannabinoid, inflammation, phosphoprotein, proteomics, thrombus, stroke, thrombectomyIntroductionReview began 11/11/2020Review ended 02/08/2021Published 02/22/2021 Copyright 2021Abbasi et al. This is an open accessarticle distributed under the terms of theCreative Commons Attribution LicenseCC-BY 4.0., which permits unrestricteduse, distribution, and reproduction in anymedium, provided the original author andsource are credited.Ischemic stroke is caused by a thromboembolic occlusion of cerebral arteries. Treatment is focused on fastand efficient removal of the occluding clot with either intravenous thrombolysis or with endovascularthrombectomy. Although the occluding clot is the primary target of treatment, little is known about itsinternal organization and inflammatory or cytokines that are involved in the formation or evolution of clots.Also, cellular pathways and cells governing the structure of clots has become a hot topic in the medicalliterature. A recent subgroup analysis from the Multicenter Randomized Clinical Trial of EndovascularTreatment for Acute Ischemic Stroke in the Netherlands (MR CLEAN) Registry has confirmed that thrombuscomputed tomography characteristics of cardioembolic (CE) stroke are distinct from those of non-CE stroke.Non-CE strokes were associated with the presence of hyperdense artery sign, a higher clot burden, a shifttowards a more proximal thrombus location, and longer thrombi compared with a CE cause [1]. Thedifferences in imaging characteristics between stroke etiologies are likely a result of differences in thecomposition of the occlusive thrombus resulting from dissimilarities in the clotting mechanisms.Histological analysis can reveal microscopic clot composition, but studies relating etiology to clotcomposition have thus far proved inconclusive [2]. Identification of proteomic signatures of thrombi fromdifferent stroke etiologies may prove invaluable in identifying the true etiology of the roughly 40% ofischemic stroke patients that have no known cause, which complicates effective secondary strokeprevention in these patients [3]. This study sought to investigate the proteomic signature of CE and largeartery atherosclerotic (LAA) clots.Materials And MethodsPatientsAll patients underwent comprehensive neurovascular imaging for evaluation of the presence of carotidatherosclerotic disease, including CT angiography from the aorta to the intracranial arterial vasculature. Allpatients also underwent a standard cardiac evaluation, including a transthoracic echocardiogram(TTE)/transesophageal echocardiogram (TEE), electrocardiogram (EKG). In cases in which no abnormalitywas found on the initial cardiac workup, prolonged cardiac monitoring was performed using either a Holtermonitor or implantable cardiac monitoring device. Patients were categorized according to Toast criteria [4].The study was approved by the Mayo Clinic Institutional Review Board, and a waiver of consent was granted.How to cite this articleAbbasi M, Fitzgerald S, Ayers-Ringler J, et al. (February 22, 2021) Proteomic Analysis of Cardioembolic and Large Artery Atherosclerotic ClotsUsing Reverse Phase Protein Array Technology Reveals Key Cellular Interactions Within Clot Microenvironments. Cureus 13(2): e13499. DOI10.7759/cureus.13499
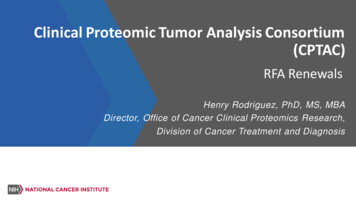
SpecimensThrombus specimens were collected from patients undergoing mechanical thrombectomy at Mayo Clinicbetween October 2016 and July 2019 (Table 1). The CE (n 25) and LAA (n 23) thrombus specimens werefixed in 10% neutral buffered formalin for up to 24 hours and processed into paraffin blocks (FFPE).Two representative slides from each clot (3µm-thick sections, two-section on each slide) were stainedwith Martius Scarlett Blue stain. After regular histological staining, three 50μm sections were cut fromeach FFPE block, placed into a microcentrifuge tube, and stored at 4 C. Two tissue sections from eachspecimen were deparaffinized in the tube using two exchanges of xylene (three minutes at 50 C). Thetissue sections were rehydrated in graded ethanol (100%, 95%, 70%, water with protease inhibitors(Roche cOmplete Mini), and lysed in protein lysis buffer (450μL tissue protein extraction reagent(Pierce T-PER ), 450μL tris-glycine 2X sodium dodecyl sulfate (SDS) sample buffer (Invitrogen ), and100μL tris(2-carboxyethyl)phosphine (Pierce TCEP Solution, neutral pH, Bond-Breaker ). Tissuelysates were heated at 95 C for eight minutes and stored at -80 C.LAA group, n (N 23)Cardioembolic group, n (N 25)Age (years), mean ( SD)68 ( 11)69 ( 13)Gender (male)1512NIHSS at admission, mean ( SD)17 ( 6)17 ( g14ICA57ICA PA tion55No of passes, mean ( SD)2.2 ( 1.3)2 ( 1)Final TICI score (2b or higher)2123Occlusion locationTABLE 1: Baseline characteristics of patientsNIHSS - National Institutes of Health Stroke Scale; ICA - internal carotid artery; rTPA - recombinant tissue plasminogen activator; LAA - large arteryatherosclerotic; TICI - thrombolysis in cerebral infarctionReverse phase protein arrays (RPPA)Thrombus lysates were printed in technical quadruplicates onto nitrocellulose coated glass slides(ONCYTE Avid, Grace Bio-Labs, Bend, USA), in serial 2-fold dilution curves, using a Quanterix 2470arrayer (Billerica, USA) equipped with 350μm solid pins (Figure 1). EB1 (BD 611546, Burkitt’s lymphoma),2021 Abbasi et al. Cureus 13(2): e13499. DOI 10.7759/cureus.134992 of 11
MOLT-4 (Santa Cruz Biotechnology sc-2233, acute lymphoblastic leukemia), normal umbilical vein tissue(Abcam ab29585), and Jurkat Calyculin (Santa Cruz Biotechnology sc-2277, human acute T cell leukemiainduced with Calyculin A cell lysates) were printed on each array as quality control samples. Bovine serumalbumin (BSA) was printed in an 8 point, 2-fold dilution series, starting at 1.0 mg/mL as a calibration curvefor total protein [5, 6]. The total protein within each array spot was determined using SYPRO Ruby proteinblot stain /Invitrogen Molecular Probes ) per manufacturer’s directions and scanned using a Cy3 laser(PowerScanner , Tecan Group Ltd., Männedorf, Switzerland). Immunostaining for 31 proteins wasperformed on a Dako Autostainer per the manufacturer’s instructions (CSA kit, Dako, Agilent Technologies,Inc., Santa Clara, USA). Each slide was incubated with a single primary antibody at room temperature for 30minutes (Table 2). Antibody specificity was confirmed by Western blotting as previously described [7]. Thenegative control slide was incubated with antibody diluent only. The secondary antibody was goat antirabbit immunoglobulin G (IgG) H L (1:10,000; Vector Labs, Burlingame, USA). Signal detection wasamplified via horseradish peroxidase mediated biotinyl tyramide deposition with chromogenic detection(diaminobenzidine) per manufacturer’s instructions (Dako, Agilent Technologies, Inc., Santa Clara, USA).Arrays were scanned at 600dpi on a flatbed scanner (PowerLook, UMAX , Dallas, USA). Spot (pixel) intensitywas analyzed using ImageQuant ver. 5.2 (GE Healthcare, Chicago, USA), with mean local area backgroundsubtraction. Signal intensity for each spot was calculated using the freely available data reduction algorithm(RAS ver. 16) [5]. Spot intensities were normalized to total protein/spot.RPPA proteinFull nameCompanyCatalog#DilutionAcCoA Ser79Acetyl-CoA carboxylase phospho Ser79Cell SignalingTechnology36611:1000Androgen receptorAndrogen receptorCell ll SignalingTechnology98191:100Biliverdin reductaseBiliverdin reductaseAssay Designs0SA-4001:750CD234/DARCDuffy antigen chemokine 000CD45Protein tyrosine phosphatase receptor type CBD6102651:200CD79aB-cell antigen receptor complex-associated protein alphachainCell SignalingTechnology133331:100Cannabinoid receptor I(CNR1, CB1)Cannabinoid receptor 1PiercePA1-7451:50Cannabinoid receptor II(CNR2, CB2)Cannabinoid receptor 2PiercePA1746A1:100Collagen ICollagen ISanta CruzBiotechnologysc-807601:50Collagen IVCollagen IVDakoM07851:50DAG-lipase betaDiacylglycerol-lipase betaCell SignalingTechnology125741:100eNOS Ser177Endothelial nitric oxide synthase phospho Ser177Cell l SignalingTechnology879851:300G-protein coupled receptor kinase 2/ β-adrenergicCell Signalingreceptor kinase 1 IL-10Interleukin-10Abcamab529091:2000GRK22021 Abbasi et al. Cureus 13(2): e13499. DOI 10.7759/cureus.134993 of 11
IL-11Interleukin-11Santa CruzBiotechnologysc-79241:500Neutrophil elastaseNeutrophil t protein kinase 1 phosphoCell SignalingSer241Technology30611:200PKC alpha Ser657Protein kinase C α phospho Ser657Upstate06-8221:1000PKC alpha/betaThr638/641Protein kinase C α/β phospho Thr638-641Cell SignalingTechnology93751:200PLC gamma Y783Phosphoinositide-specific phospholipase C phosphoTyr783Cell SignalingTechnology28211:100PP2AProtein phosphatase 2A20391:1000PPARgammaPeroxisome proliferator-activated receptor-gammaCell SignalingTechnology24351:50SerotoninSerotonin (5-hydroxytryptophan, 5-HT)SigmaS55451:1000Syk Y525/526Spleen tyrosine kinase phospho525/52627111:50TGF-βTransforming growth factor βCell SignalingTechnology37091:2000vWFvon Willebrand factorCell SignalingTechnology657071:100PDK-1 Ser241Cell SignalingTechnologyCell SignalingTechnologyTABLE 2: Protein names and antibody information for reverse phase protein arraysRPPA - reverse phase protein arrays2021 Abbasi et al. Cureus 13(2): e13499. DOI 10.7759/cureus.134994 of 11
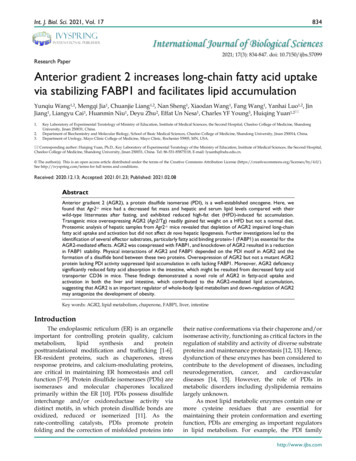
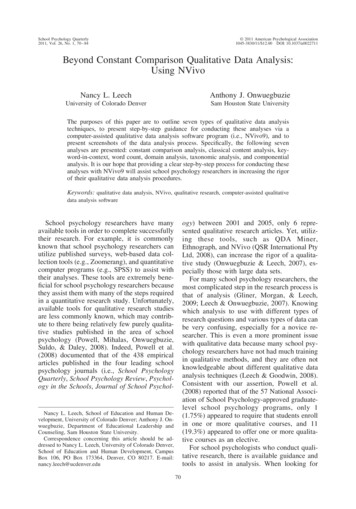
FIGURE 1: Proteomic workflow using formalin-fixed, paraffin-embedded(FFPE) thrombus specimensProteins were extracted from FFPE clot specimens, arrayed on nitrocellulose-coated glass slides using aQuanterix 2470 arrayer, and immunostained, or stained for total protein on a Dako Autostainer.Statistical methodsNormality was assessed using the Shapiro-Wilk test. Wilcoxon signed-rank sum pairwise comparisons wereused for non-normally distributed data with p 0.05 considered significant. Data was standardized (z-score)for each protein. Two-way, hierarchical cluster analysis (Euclidean distance, Ward method), correlograms,and Spearman’s rho non-parametric correlations were performed in R (R Foundation for StatisticalComputing, Vienna, Austria). Spearman’s rho non-parametric correlations were used to compare pairs ofprotein endpoints (rho 0.85 and p 0.001 were considered significant). Network diagrams were created inCytoscape ver. 3.8.0 [8].ResultsHistological composition of LAA and cardioembolic clotsThe Martius scarlet blue (MSB) histological analysis revealed that there were slight differences in thehistological clot composition between the LAA and cardioembolic clots (Figure 2). Cardioembolic clots had ahigher proportion of red blood cells (RBCs; 47.67% vs. 42.58%) and white blood cells (WBCs; 4.22% vs.3.12%) compared to LAA clots. On the other hand, LAA clots had a slightly larger proportion of fibrin(31.31% vs. 29.19%) and platelets/other (20.81% vs. 18.21%). Collagen (0.10% vs. 0.59%) and calcification(0.61% vs. 1.59%) are minor components of both cardioembolic and LAA clots respectively.2021 Abbasi et al. Cureus 13(2): e13499. DOI 10.7759/cureus.134995 of 11
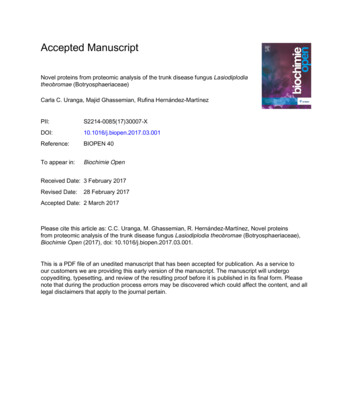
FIGURE 2: Histological clot composition of cardioembolic and LAA clotsThe mean histological clot composition (%) of clot component, as determined by MSB staining representedas the percentage of the total.MSB - Martius scarlet blue; LAA - large artery atheroscleroticProteomic heterogeneity exists within classes of thrombus specimens.Data for two specimens in the LAA group were not used for hierarchical clustering and network analyses dueto missing data (poor precision between technical replicates) for CD63, CD45, and collagen IV. Unsupervisedtwo-way hierarchical clustering revealed two primary clusters of specimens; however, each cluster showedheterogeneity in relation to the etiology of the clot (Figure 3). The protein levels for the 31 proteins in ourstudy could not clearly discriminate CE and LAA thrombus types.FIGURE 3: Proteomic heterogeneity exists within cardioembolic andlarge artery atherosclerotic thrombus specimensUnsupervised hierarchical two-way clustering of the entire cohort of thrombus specimens revealed twoheterogeneous clusters of specimens (columns) that contained both CE and LAA thrombus specimens (n 25CE, n 21 LAA, Euclidean distance, Ward method). The 'variables' dendrogram on the y-axis indicates the2021 Abbasi et al. Cureus 13(2): e13499. DOI 10.7759/cureus.134996 of 11
relationships between the expressions of all variables (rows) for all thrombus specimens. The 'variables'concentrations are depicted using a color scale from red (high), to white, to blue (low).LAA - large artery atherosclerotic; CE - cardioembolicCardioembolic clots possess diverse protein signaling interactionsA pairwise protein linkage analysis was conducted using Spearman's rho non-parametric correlation to mapinter-related signaling kinases. Fifty strong protein linkages were noted for the CE (rho 0.85, p 0.001),while only 18 strong linkages were noted for the LAA group (Table 3). No significant negative proteininteractions were noted for either group.CE proteinCE proteinSpearman rho CELAA proteinLAA proteinSpearman rho LAAvariable 1variable 2(p 0.001)variable 1variable 2(p e-1IL-110.86Cannabinoid Rec1PKCaß Thr638/6410.90Cannabinoid Rec1CD234 (DARC)0.87Cannabinoid RecCannabinoid RecCannabinoid RecCannabinoid Rec2121Cannabinoid Rec2Serotonin0.88Cannabinoid Rec2PKCaß Thr638/6410.85CD63Cannabinoid Rec10.95CD63Cannabinoid Rec20.90eNOS Ser177DAG Lipase d Rec10.97IL-6CD630.96IL-6CD630.89IL-6Cannabinoid Rec20.95IL-6PKCaß Thr638/6410.88IL-6CD234 (DARC)0.88IL-8PKCa Ser6570.96IL-8PKCa taseIL-60.94NeutrophilCannabinoid RecNeutrophilCannabinoid RecElastase1Elastase1NeutrophilElastaseCannabinoid Rec2NeutrophilElastaseCannabinoid Rec20.940.970.962021 Abbasi et al. Cureus 13(2): e13499. DOI 10.7759/cureus.134990.930.890.887 of 11
NeutrophilCD630.94NeutrophilElastaseCD234 (DARC)0.90NeutrophilElastasePKCaß Thr638/6410.87PDK1 Ser241PKCa Ser6570.98PDK1 Ser241PKCa Ser6570.99PDK1 Ser241IL-80.95PDK1 Ser241IL-80.98PLCgammaPKCaß ammaIL-60.89PPARgammaCannabinoid Rec10.98PPARgammaCannabinoid Rec10.95PPARgammaSyk Tyr525/5260.97PPARgammaSyk inoid Rec20.94Cannabinoid PKCaß Thr638/6410.89PPARgammaCD234 (DARC)0.88PPARgammaArginase-10.85Syk Tyr525/526Cannabinoid Rec10.97Syk Tyr525/526Cannabinoid Rec10.91Syk Tyr525/526IL-60.96Syk Tyr525/526IL-60.92Syk Tyr525/526NeutrophilElastase0.95Syk Tyr525/526NeutrophilElastase0.96Syk Tyr525/526Cannabinoid Rec20.91Syk Tyr525/526Cannabinoid Rec20.86Syk Tyr525/526PKCaß Thr638/6410.91Syk Tyr525/526CD630.91Syk Tyr525/526CD630.85Syk Tyr525/526CD234 (DARC)0.86Syk Tyr525/526DAG Lipase Beta0.86vWFIL-60.92vWFSyk Tyr525/5260.91vWFCD630.90vWFCannabinoid Rec10.90vWFNeutrophilElastase0.85TABLE 3: Spearman rho non-parametric pairwise protein correlations quantified in cardioembolic(CE) and large artery atherosclerotic (LAA) thrombus specimens show extensive network2021 Abbasi et al. Cureus 13(2): e13499. DOI 10.7759/cureus.134998 of 11
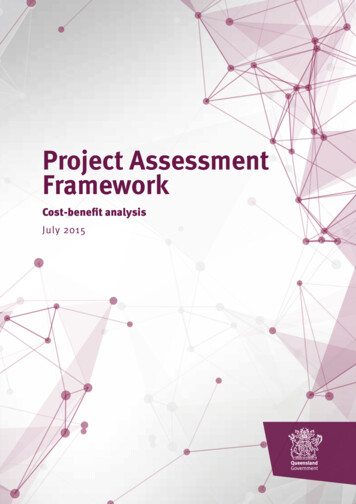
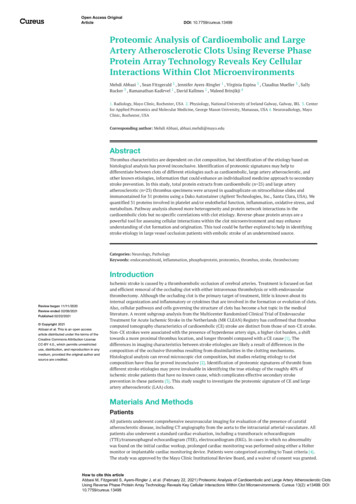
linkages in CE but not LAA thrombus specimensJMP Statistical Software ver. 5.1, SAS Institute Inc., Cary, USAThe protein linkages (correlations) in CE clot specimens were diverse and more abundant compared to LAAclot specimens (Figure 4). Predominant linkages between PPAR-gamma and arginase-1, CD63, CD234,PKCαβ Thr 638/641, and von Willebrand factor (vWF) were found in CE clots compared to LAA clots (Table3). Multiple protein linkages within inflammatory/immune cell proteins arginase-1, neutrophil elastase,CD234, and CD63 were found in CE clot specimens. In contrast, the LAA clots did not have any uniqueprotein-protein correlations compared to the CE clots and lacked significant vWF protein linkages.FIGURE 4: Protein interconnections and network signaling differbetween thrombus etiologyA correlogram of CE thrombus specimens reveals numerous, strong protein-protein interconnections, shownby the dark blue dots (A). Diverse protein network signaling predominates in CE thrombus specimens (B). Incontrast, LAA clots show very few protein-protein interactions (C), with sparse network interconnections (D).LAA - large artery atherosclerotic; CE - cardioembolicDiscussionOur study advances the knowledge of the human cerebrovascular thrombi composition by focusing on theproteomic analysis of cardioembolic and atherothrombotic thrombi. Our results support the general notionthat direct analysis of the clots could help in the unveiling, in the future, biomarkers which potentially couldassist in stroke diagnosis and differentiating stroke etiologies. Our study comparing the proteomicsignatures of CE versus LAA clots demonstrated a number of interesting findings. We found predominantlinkages between PPAR-gamma and arginase-1, CD63, CD234, PKCαβ Thr 638/641, and von WillebrandFactor (vWF) in CE clots suggesting that platelet signaling dominates in CE clots compared to LAA clots.The multiple protein linkages within inflammatory/immune cell proteins lend additional support to theobservation of platelet-immune cell cross-talk in CE clot specimens, supported by the white blood cellenrichment seen in the histological analysis of CE emboli in this and previous studies [9]. Proteomicsignaling does not necessarily correspond with cellular proportions on histological staining, but it doesreflect activated pathways and intra- and inter-cellular communications present in the occlusive clot,influenced by the etiology. Detailed analysis including individual patient histories and medications will2021 Abbasi et al. Cureus 13(2): e13499. DOI 10.7759/cureus.134999 of 11
likely demonstrate strong correlations with certain protein networks, a study we plan to perform with thelarger sample currently under investigation.The widespread use of mechanical thrombectomy devices has resulted in the availability of clot material forhistopathological and proteomic analysis. Studies relating histological clot composition to etiology havethus far proved inconclusive [2]. Identifying stroke etiology in this population is very important due to thefact that up to 30% of large vessel occlusions (LVO) patients do not have a stroke source identified, whichcomplicates secondary stroke prevention strategies. Secondary stroke prevention in this population isessential in preventing recurrent large vessel occlusion, an occurrence that can have a devastating effect onthe patient [9]. RPPAs are a powerful tool for assessing proteomic interactions within the cellularmicroenvironment and may enhance our understanding of the clot formation process in various etiologies,which is why we sought to investigate the proteomic signatures of thrombi from LAA and cardiac etiologies.Previous proteomics studies have provided some insight, but much more needs to be explored to identifypathways that could aid in differentiating stroke etiology. A previous proteomic study found that twoinflammation proteins (integrin alpha-M and mitochondrial superoxide dismutase) are associated with highblood low-density lipoprotein (LDL) [10]. In another study, these two proteins failed to differentiatebetween cardioembolic vs. atherosclerotic etiology [11]. Also, another study analyzed four thrombi, with 1,600 proteins identified [12]. To identify proteomic signatures that can help differentiate between clots ofdifferent etiologies such as cardiac and LAA, 31 proteins involved in platelet and/or endothelial function,inflammation, oxidative stress, and metabolism were quantified using reverse phase protein arrays (RPPA)[13-15]. Unsupervised two-way hierarchical clustering revealed two primary clusters of specimens, butdespite the difference in etiology between the two thrombus types, the resulting proteomic clusters werequite heterogeneous within each group. However, we did find that platelet signaling dominates in CE clotscompared to LAA clots and hope to explore this hypothesis further in larger cohort studies.Protein signaling networks comprise a series of interconnected proteins and their post-translationallymodified forms [6, 16], which are generally organized within specific biological processes, such asinflammation or endothelial integrity. Crosstalk between pathways provides redundancy and resiliencywithin the cellular microenvironment. Mapping these signaling networks provides functional insights intometabolic processes [13, 16, 17]. The diverse protein signaling interactions found in the clots weredetermined primarily by analysis of protein phosphorylation cascades. Phosphorylation events are transientfunctional indicators of active kinase signaling pathways. Specific phosphorylation sites, at any point intime, define the functional character of protein-protein interactions. A set of interacting proteins within anactive pathway will tend to be simultaneously phosphorylated in the signaling cascade. Thus, for a given setof patient observations over a disease cohort, correlations among individual protein pairs imply activeinteractions in a linked pathway [6, 18].ConclusionsWhile we demonstrated common protein interactions in thromboembolic disease, consisting of immune,endocannabinoid, and metabolism proteins, CE protein signaling networks are comprised of complexinteractions across biological pathways and differ from those seen in LAA patients. Our findings suggest thatRPPA of retrieved thrombi in large vessel occlusion could be a promising tool in determining strokeetiology. However, larger studies are needed.Additional InformationDisclosuresHuman subjects: Consent was obtained or waived by all participants in this study. Animal subjects: Allauthors have confirmed that this study did not involve animal subjects or tissue. Conflicts of interest: Incompliance with the ICMJE uniform disclosure form, all authors declare the following: Payment/servicesinfo: This work was funded by the National Institutes of Health grant number R01 NS105853. Financialrelationships: All authors have declared that they have no financial relationships at present or within theprevious three years with any organizations that might have an interest in the submitted work. Otherrelationships: All authors have declared that there are no other relationships or activities that could appearto have influenced the submitted work.References1.2.3.4.Boodt N, Compagne KCJ, Dutra BG, et al.: Stroke etiology and thrombus computed tomographycharacteristics in patients with acute ischemic stroke: A MR CLEAN registry substudy. Stroke. 2020,51:1727-1735. 10.1161/STROKEAHA.119.027749Brinjikji W, Duffy S, Burrows A, et al.: Correlation of imaging and histopathology of thrombi in acuteischemic stroke with etiology and outcome: a systematic review. J Neurointerv Surg. 2017, 9:529-534.Arsava E, Helenius J, Avery R, et al.: Assessment of the predictive validity of etiologic stroke classification .JAMA Neurol. 2017, 74:419-426. 10.1001/jamaneurol.2016.5815Kolominsky-Rabas PL, Weber M, Gefeller O, Neundoerfer B, Heuschmann PU: Epidemiology of ischemicstroke subtypes according to TOAST criteria: incidence, recurrence, and long-term survival in ischemic2021 Abbasi et al. Cureus 13(2): e13499. DOI 10.7759/cureus.1349910 of 11
5.6.7.8.9.10.11.12.13.14.15.16.17.18.stroke subtypes: a population-based study. Stroke. 2001, 32:2735-2740. 10.1161/hs1201.100209Chiechi A, Mueller C, Boehm KM, et al.: Improved data normalization methods for reverse phase proteinmicroarray analysis of complex biological samples. Biotechniques. 2012, 0:1-7.Petricoin EF, Espina V, Araujo RP, et al.: Phosphoprotein pathway mapping: Akt/mammalian target ofrapamycin activation is negatively associated with childhood rhabdomyosarcoma survival. Cancer Res. 2007,67:3431-3440. 10.1158/0008-5472.CAN-06-1344Signore M, Manganelli V, Hodge A: Antibody validation by western blotting . Methods Mol Biol. 2017,1606:51-70. 10.1007/978-1-4939-6990-6 4Shannon P, Markiel A, Ozier O, et al.: Cytoscape: a software environment for integrated models ofbiomolecular interaction networks. Genome Res. 2003, 13:2498-2504. 10.1101/gr.1239303Bouslama M, Haussen DC, Rebello LC, et al.: Repeated mechanical thrombectomy in recurrent large vesselocclusion acute ischemic stroke. Interv Neurol. 2017, 6:1-7. 10.1159/000447754Rao NM, Capri J, Cohn W, et al.: Peptide composition of stroke causing emboli correlate with serum markersof atherosclerosis and inflammation. Front Neurol. 2017, 8:427. 10.3389/fneur.2017.00427Dargazanli C, Zub E, Deverdun J, et al.: Machine learning analysis of the cerebrovascular thrombi proteomein human ischemic stroke: an exploratory study. Front Neurol. 2020, 5:1347. 10.3389/fneur.2020.575376Gallagher RI, Espina V: Reverse phase protein arrays: mapping the path towards personalized medicine . MolDiagn Ther. 2014, 18:619-630. 10.1007/s40291-014-0122-3Muñoz R, Santamaría E, Rubio I, et al.: Mass spectrometry-based proteomic profiling of thrombotic materialobtained by endovascular thrombectomy in patients with ischemic stroke. Int J Mol Sci. 2018, 19:498.10.3390/ijms19020498Paweletz CP, Charboneau L, Bichsel VE, et al.: Reverse phase protein microarrays which capture diseaseprogression show activation of pro-survival pathways at the cancer invasion front. Oncogene. 2001,20:1981-1989. 10.1038/sj.onc.1204265Popova TG, Espina V, Liotta LA, Popov SG: Reverse-phase microarray analysis reveals novel targets inlymph nodes of bacillus anthracis spore-challenged mice. PLoS One. 2015, 10:0129860.10.1371/journal.pone.0129860Wulfkuhle JD, Berg D, Wolff C, et al.: Molecular analysis of HER2 signaling in human breast cancer byfunctional protein pathway activation mapping. Clin Cancer Res. 2012, 18:6426-6435. 10.1158/10780432.CCR-12-0452Espina V, Wulfkuhle J, Calvert VS, el al.: Reverse phase protein microarrays for theranostics and patienttailored therapy. Methods Mol Biol. 2008, 441:113-128. 10.1007/978-1-60327-047-2 8Li R, Erdamar S, Dai H, et al.: Forkhead protein FKHR and its phosphorylated form p-FKHR in humanprostate cancer. Hum Pathol. 2007, 38:1501-1507. 10.1016/j.humpath.2007.02.0162021 Abbasi et al. Cureus 13(2): e13499. DOI 10.7759/cureus.1349911 of 11
The study was approved by the Mayo Clinic Institutional Review Board, and a waiver of consent was granted. 1 2 1 3 3 3 1 1 4 Open Access Original Article DOI: 10.7759/cureus.13499 How to cite this article Abbasi M, Fitzgerald S, Ayers-Ringler J, et al. (February 22, 2021) Proteomic Analysis of Cardioembolic and Large Artery Atherosclerotic Clots