Transcription
2019 Community Health Needs AssessmentKaiser Foundation Health Plan of the Mid-Atlantic States, IncorporatedApproved by Kaiser Foundation Hospitals Board of Director’s Community Health CommitteeSeptember 16, 20191
Community Health Needs Assessment (CHNA) Reportof the Kaiser Foundation Health Plan of the Mid-Atlantic States, Inc.ContentsIntroduction . . .A. About Kaiser Permanente . 44B. About Kaiser Permanente Community Health .C. Purpose of the Community Health Needs Assessment . . .D. Kaiser Permanente’s approach to the Community Health Needs Assessment .Community served . .A. Kaiser Permanente’s definition of community served .45566B. Map and description of community served .i. Map . .ii. Geographic description of the community served .iii. Demographic profile of the community served .Who was involved in the assessment? .668811Process and methods used to conduct the CHNA .A. Secondary data . .i. Sources of secondary data . .ii. Methodology for collection, interpretation and analysis of secondary data .B. Community input .i. Description of who was consulted .ii. Methodology for collection and interpretation C. Written comments .D. Data limitations and information gaps .V.Identification and prioritization of the community’s health needs A. Identifying community health needs .i. Definition of “health need” .ii. Criteria and methods used to identify the community health needs .B. Process and criteria used for prioritization of health needs .C. Descriptions of community needs identified . . .D. Community resources available to respond to the identified health needs VI.KFHP-MAS 2016 Implementation Strategy evaluation of impact . . A. Purpose of 2016 Implementation Strategy evaluation of impact .B. 2016 Implementation Strategy evaluation of impact overview .12121212131313151515151516171926262627C. 2016 Implementation Strategy evaluation of impact by health need 29I.II.III.IV.2
Appendices1 .A. Secondary data sources and dates . B. Community input tracking form . .i. List of key informants .ii. List of survey respondents . .C. Health need profiles .D. Community resources .34343535363846Table 1: List of cities and counties selected for inclusion in the CHNA .Table 2: Demographic profile for KFHP-MAS .Table 3: Greater Baltimore service area demographic profile .889Table 4: District of Columbia/Suburban Maryland service area demographic profile .Table 5: Northern Virginia service area demographic profile .Table 6: CHNA identified needs by service area Table 7: CHNA identified needs for the KFHP-MAS region . . 9101818VII.TablesFiguresFigure 1: Map of KFHP-MAS communities .Figure 2: Data triangulation approach .1Additional appendices are available upon request (e.g. list of indicators, CHNA survey, interviewprotocol, scorecards and priority scores). Please email CHNA-communications@kp.org for moreinformation.3716
I. IntroductionA. About Kaiser PermanenteFounded in 1942 to serve employees of Kaiser Industries and opened to the public in 1945, KaiserPermanente is recognized as one of America’s leading health care providers and nonprofit healthplans. We were created to meet the challenge of providing American workers with medical careduring the Great Depression and World War II, when most people could not afford to go to adoctor. Since our beginnings, we have been committed to helping shape the future of health care.Among the innovations Kaiser Permanente has brought to U.S. health care are: Prepaid health plans, which spread the cost to make it more affordableA focus on preventing illness and disease as much as on caring for the sickAn organized, coordinated system that puts as many services as possible under oneroof—all connected by an electronic medical recordKaiser Permanente is an integrated health care delivery system comprised of Kaiser FoundationHospitals (KFHP), Kaiser Foundation Health Plan (KFHP), and physicians in the PermanenteMedical Groups. Today we serve more than 12 million members in nine states and the District ofColumbia. Our mission is to provide high-quality, affordable health care services and to improvethe health of our members and the communities we serve.Care for members and patients is focused on their Total Health and guided by their personalphysicians, specialists, and team of caregivers. Our expert and caring medical teams areempowered and supported by industry-leading technology advances and tools for healthpromotion, disease prevention, state-of-the-art care delivery and world-class chronic diseasemanagement. Kaiser Permanente is dedicated to care innovations, clinical research, healtheducation and the support of community health.B. About Kaiser Permanente Community HealthFor more than 70 years, Kaiser Permanente has been dedicated to providing high-quality,affordable health care services and to improving the health of our members and the communitieswe serve. We believe good health is a fundamental right shared by all and we recognize that goodhealth extends beyond the doctor’s office and the hospital. It begins with healthy environments:fresh fruits and vegetables in neighborhood stores, successful schools, clean air, and safe,accessible parks and playgrounds.However, it does not end there. If most of what contributes to your health happens outside of thedoctor’s office, in places where communities live, work, and play, fundamental definitions of healthmust also include conditions like peace, shelter, a stable eco-system, social justice, and equity2.Any improvement in health requires a secure foundation in these basic principles.Our vision is a world where all people have a fair and just opportunity to be healthy 3. Ourcommitment to achieving this vision is in part accomplished by our efforts to minimize healthdisparities and remove obstacles to optimal health, especially poverty, discrimination, and their2World Health Organization. Milestones in health promotion: Statements from global conferences.Available from: https://www.who.int/healthpromotion/Milestones Health Promotion 05022010.pdf3Robert Wood Johnson Foundation. Achieving Health Equity. Available alth-equity.html4
consequences. Through our programs, grants and public policy advocacy, we make way forcourageous conversations and decisive action about powerlessness and lack of access to goodjobs with fair pay, quality education and housing, safe environments, and health care. KaiserPermanente’s vision for health equity, where all people can achieve the healthiest life possible, isthe basis for our community health strategies.Better health outcomes begin where health starts, in our communities. Like our approach tomedicine, our work in the community takes a prevention-focused, evidence-based approach. Wego beyond traditional corporate philanthropy or grantmaking to pair financial resources withmedical research, physician expertise and clinical practices. Our community health strategyfocuses on three areas: Ensuring health access by providing individuals served at KP or by our safety net partnerswith integrated clinical and social servicesImproving conditions for health and equity by engaging members, communities, andKaiser Permanente’s workforce and assetsAdvancing the future of community health by innovating with technology and socialsolutionsFor many years, we have worked side-by-side with other organizations to address serious publichealth issues such as obesity, access to care and violence. We have conducted CommunityHealth Needs Assessments to better understand each community’s unique needs and resources.The CHNA process informs our community investments and helps us develop strategies aimedat making long-term, sustainable change and it allows us to deepen the strong relationships wehave with other organizations that are working to improve community health.C. Purpose of the Community Health Needs AssessmentThe Patient Protection and Affordable Care Act (ACA), enacted on March 23, 2010, included newrequirements for nonprofit hospitals in order to maintain their tax-exempt status. The provisionwas the subject of final regulations providing guidance on the requirements of section 501(r) ofthe Internal Revenue Code. Included in the new regulations is a requirement that all nonprofithospitals must conduct a community health needs assessment (CHNA) and develop animplementation strategy (IS) every three years 4-30525.pdf). The required written IS plan is set forth in a separate written document.Both the CHNA Report and the IS for each Kaiser Foundation Hospital and Health Plan areavailable at https://www.kp.org/chna. As a non-hospital region, Kaiser Foundation Health Plan ofthe Mid-Atlantic States, Inc. (KPFH-MAS) voluntarily complies with federal requirements.D. Kaiser Permanente’s approach to the Community Health Needs AssessmentKaiser Permanente has conducted CHNAs for many years, often as part of long-standingcommunity collaboratives. The new federal CHNA requirements have provided an opportunity torevisit our needs assessment and strategic planning processes with an eye toward enhancedcompliance and transparency and leveraging emerging technologies. Our intention is to developand implement a transparent, rigorous and whenever possible, collaborative approach tounderstanding the needs and assets in our communities. From data collection and analysis to theidentification of prioritized needs and the development of an implementation strategy, the intentwas to develop a rigorous process that would yield meaningful results.5
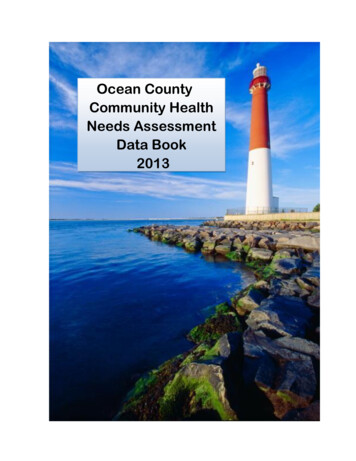
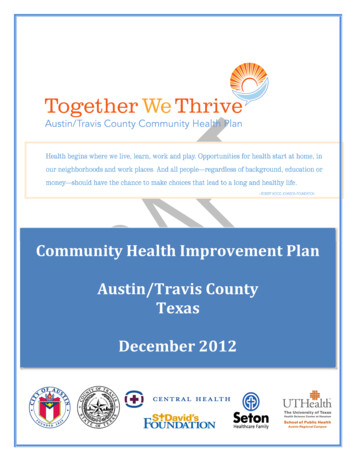
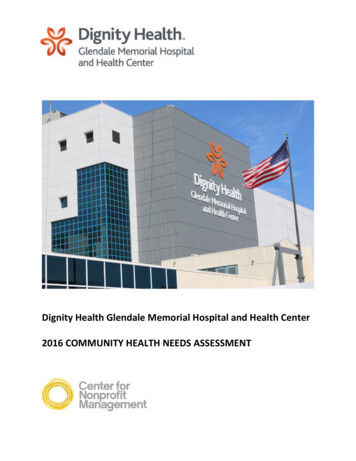
Kaiser Permanente’s innovative approach to CHNAs include the development of a free, webbased CHNA data platform that is available to the public. The data platform provides access to acore set of approximately 120 publicly available indicators to understand health through aframework that includes social and economic factors, health behaviors, physical environment,clinical care and health outcomes.In addition to reviewing the secondary data available through the CHNA data platform, and insome cases other local sources, each KFHP, individually or with a collaborative, collected primarydata through key informant interviews, focus groups and surveys. Primary data collectionconsisted of reaching out to local public health experts, community leaders, and residents toidentify issues that most impacted the health of the community. The CHNA process also includedan identification of existing community assets and resources to address the health needs.Each hospital/collaborative developed a set of criteria to determine what constitutes a health needin their community. Once all the community health needs were identified, they were prioritized,based on identified criteria. This process resulted in a complete list of prioritized community healthneeds. The process and the outcome of the CHNA are described in this report.In conjunction with this report, the Kaiser Foundation Health Plan of the Mid-Atlantic States, Inc.(KFHP-MAS) will develop an implementation strategy for the priority health needs that the healthplan will address. These strategies will build on Kaiser Permanente’s assets and resources, aswell as evidence-based strategies wherever possible. Both the CHNA and the ImplementationStrategy, once finalized, will be posted on our website, https://www.kp.org/chna.II. Community servedA. Kaiser Permanente’s definition of community servedKaiser Permanente defines the community served as those individuals residing within its servicearea. A service area includes all residents in a defined geographic area surrounding its medicalfacilities and includes low-income or underserved populations.B. Map and description of community servedi. MapKFHP-MAS operates in 30 locations, serving more than 770,000 members in Maryland, Virginiaand the District of Columbia. The Mid-Atlantic States region is comprised of three service areas:Greater Baltimore (BALT), District of Columbia/Suburban Maryland (DCSM) and Northern Virginia(NOVA). A map of KFHP-MAS service areas is presented below.6
Figure 1: Map of KFHP-MAS communitiesThe KFHP-MAS community is comprised of 32 counties and cities, including: The District of ColumbiaThe following Virginia jurisdictions: Alexandria City, Arlington County, Fairfax City, FairfaxCounty, Falls Church City, Fredericksburg City, King George County, Loudoun County,Manassas City, Manassas Park City, Prince William County, Spotsylvania County, StaffordCountyPortions of the following jurisdictions in Virginia: Caroline County, Culpepper County,Fauquier County, Hanover County, Louisa County, Orange County, Westmoreland CountyThe following Maryland jurisdictions: Anne Arundel County, Baltimore City, BaltimoreCounty, Carroll County, Harford County, Howard County, Montgomery County, PrinceGeorge’s CountyPortions of the following jurisdictions: Calvert County, Charles County, Frederick CountyNote: The secondary data collected for this report utilized data from all 32 counties. Please seesection IV, A for information about how these data were weighted.7
ii. Geographic description of the community servedCities and counties from the KFHP-MAS region were selected for inclusion in the CHNA basedon the following criteria: 1) the city or county contains a Kaiser Permanente Medical OfficeBuilding (MOB), and 2) the population of the city or county represents at least 1% of the populationserved within the Mid-Atlantic States region. Table 1 displays the 15 cities and counties selectedfor CHNA inclusion based on these criteria.Table 1: List of cities and counties selected for inclusion in the CHNABALTAnne Arundel CountyBaltimore CityBaltimore CountyHarford CountyHoward CountyDCSMDistrict of ColumbiaFrederick CountyMontgomery CountyPrince George's CountyNOVAAlexandria CityArlington CountyFairfax CountyLoudoun CountyPrince William CountyStafford CountyThe following cities and counties did not meet the established criteria for inclusion in the CHNA:Calvert County, Carroll County, Charles County, Caroline County, Culpeper County, Fairfax City,Falls Church City, Fauquier County, Fredericksburg City, Hanover County, King George County,Louisa County, Manassas City, Manassas Park City, Orange County, Spotsylvania County andWestmoreland County.Note: The primary data collected for this report utilized data from the aforementioned 15 countiesand cities, as these were more reflective of the KFHP-MAS footprint, current investments andrelationships. See section IV, B for information about how data were collected and analyzed.iii. Demographic profile of the community servedAn overall demographic profile of the region is presented in Table 2. Data for each of the citiesand counties included in this report are presented by service area in Tables 3-5.Table 2: Demographic profile for KFHP-MASRace/ethnicityTotal PopulationRaceAsianBlackNative American/Alaska NativePacific Islander/Native HawaiianSome other raceMultiple racesWhiteSocioeconomic data8,560,8108.5%27.2%0.3%0.1%4.3%3.6%56.1%Living in poverty ( 100% federal poverty level)Children in povertyUnemploymentAdults with no high school %11.9%3.8%9.7%
Table 3: Greater Baltimore service area demographic profilePopulationMedian household incomeRace/EthnicityWhiteBlackAsianHispanicAdults with no HS diplomaPopulation with any disabilityUninsuredBelow 100% FPLChildren below 100% FPLUnemployedMedian rfordCountyHowardCounty559,737 91,918621,000 44,262825,666 68,989249,776 81,052308,447 e 4: District of Columbia/Suburban Maryland service area demographic profilePopulationMedian household incomeRace/EthnicityWhiteBlackAsianHispanicAdults with no HS diplomaPopulation with any disabilityUninsuredBelow 100% FPLChildren below 100% FPLUnemployedMedian ageDistrict ofColumbia681,170 75,506FrederickCounty243,465 85,715MontgomeryCounty1,026,371 100,352Prince George'sCounty897,693 9
Table 5: Northern Virginia service area demographic profilePopulationMedian household incomeRace/EthnicityWhiteBlackAsianHispanicAdults with no HS diplomaPopulation with any disabilityUninsuredBelow 100% FPLChildren below 100% FPLUnemployedMedian unCounty151,473 89,200226,092 108,7061,148,433 114,329362,435 125,672PrinceWilliamCounty443,630 affordCounty139,548 5.0
III. Who was involved in the assessment?Maya Nadison, Ph.D., M.H.S.: Dr. Nadison led the 2019 KFH-MAS CHNA, overseeing thequantitative and qualitative data collection and analysis, the data triangulation methodology andthe CHNA report writing. She earned her Ph.D. from the Johns Hopkins Bloomberg School ofPublic Health, focusing on health communication and education sciences. She has extensiveexperience in program evaluation, quantitative and qualitative data collection and analysis,message development, creation of educational material, and report writing for diverse audiences.Her research interests relate to the design, implementation, and evaluation of school andcommunity-based interventions focused on the prevention of risk behaviors.Tanya Edelin, C.P.A., P.M.P.: Ms. Edelin provided general oversight of the CHNA process. AsDirector of Community Health Strategy and Operations, Ms. Edelin leads the development andexecution of data-informed initiatives to improve the health of the communities served by KaiserPermanente. She also leads the region’s community health and wealth strategic agenda engagingall Kaiser Permanente assets for impact on population health through creative, innovativestrategies that create shared value.Jessica Minor, B.S., M.P.P.: Ms. Minor supported qualitative data collection and drafted sectionsof the CHNA report. She is currently a Program Coordinator at Kaiser Permanente CommunityHealth, where she manages data for all contributions and the sponsorship program. Previously,she worked as a Public Health Program Manager at the Association of University Centers onDisability. Ms. Minor has a special interest in health disparities, specifically as it relates to peoplewith disabilities and other minority populations.Center for Community Health and Evaluation: (CCHE) assisted with primary data collectionand analysis. For over 25 years, CCHE has provided evaluation, assessment and strategicconsulting services to foundations and health organizations to improve community health. CCHEbrings experience conducting tailored needs assessments and engaging stakeholders to conductplanning and to prioritize strategies based on data.Mah Afroze Chughtai Zain, Ph.D. candidate: Ms. Chughtai supported the quantitative datacollection and analysis process. She is currently pursuing her Ph.D. in Public Policy at theUniversity of Maryland. Ms. Chugtai holds a bachelor’s and master’s degree in economics. Herresearch interests include database management, survey design and agent-based modeling.Pamela Vega, B.S., M.H.A. Candidate: Ms. Vega supported the data triangulation process anddrafted sections of the CHNA report. She is working towards her master's degree in HealthAdministration with a concentration in Nonprofit Management and Leadership at the University ofMaryland, College Park. Ms. Vega has a background in public health, which exposed her to thereality that an individual’s ZIP code is a predictor of their health and well-being. This exposure ledher to serve both in Montgomery County and Prince George’s County, Maryland as a volunteerto promote population health.11
IV. Process and methods used to conduct the CHNAA. Secondary datai. Sources of secondary dataIn order to maintain consistency with other KP regions, KFHP-MAS used the Kaiser PermanenteCHNA Data Platform (http://www.chna.org/kp) to review approximately 120 indicators frompublicly available data sources. The nationally available common indicators collectively provideinsight into the overall health of a community.The KP CHNA Data Platform is a web-based resource with pre-populated national, state andcounty-level data. Data on gender and race/ethnicity breakdowns were included for analysiswhere available. Secondary data for this report was obtained from the platform from June 2018through October 2018. As the platform is undergoing continual enhancements, certain data mayhave been updated since they were obtained for this report. For the most recent data and/oradditional health data indicators, please visit www.chna.org/kp. For more details on data sources,please see Appendix A.ii. Methodology for collection, interpretation and analysis of secondary dataKaiser Permanente’s CHNA Data Platform is a web-based resource provided to our communitiesas a way to support community health needs assessments and community collaboration. Thisplatform includes a focused set of community health indicators that allow users to understandwhat is driving health outcomes in particular neighborhoods. The platform provides the capacityto view, map and analyze these indicators as well as understand racial/ethnic disparities andcompare local indicators with state and national benchmarks.Data at the service area level: Secondary data were downloaded from the platform andpresented by service area. Service area estimates were generated using population-weightedallocations from county-level data. For service areas that fall entirely within one county, thereported indicator value is the value for the county. For service areas that cross multiple countyboundaries, estimates are aggregated from each county that fall within the service area and areweighted by the total population of that county. As an example, only 62% of Calvert County fallswithin the District of Columbia/Suburban Maryland (DCSM) service area. Therefore, data fromCalvert county was weighted to account for the fact that only 62% of county falls within DCSM.All weighting calculations were performed within the CHNA data platform.Benchmarking: Benchmarking is a critical component of the CHNA process that facilitatescomparison of city and county data to national data, thus revealing a community health need. Forthe KFPH-MAS CHNA, city and county level data were compared to national averages. Althougha scan of national and local assessments revealed that both national and state averages can beused as benchmarks, it was not feasible to use the state average given that the DCSM servicearea crosses state lines (i.e. State of Maryland and the District of Columbia).Indicators selected for inclusion in the CHNA were heterogeneous in regard to what and how theyare measured and expressed (e.g. rates, counts). Therefore, they were standardized using “zscores” - converting them to unit-free measures by computing the population-weighted mean,12
variance and standard deviation of the sample. Indicators were identified as poorly performingagainst the national benchmark if the z-score was less than -0.5.Health disparities: According to the Department of Health and Human Services, healthdisparities are defined as “a particular type of health difference that is closely linked with social,economic, and/or environmental disadvantage” 4. In an effort to identify health differences,racial/ethnic disparity data were incorporated into the analysis when available. Approximately15% of the indicators selected for analysis were broken down by race. For consistency, disparitydata were also identified as poorly performing against the national benchmark when the z-scorewas less than -0.5. The result of the benchmarking and racial/ethnic disparity calculationsgenerated a list of secondary data identified health needs by service area.B. Community inputi. Description of who was consultedCommunity input was provided by a broad range of community members using key informantinterviews and surveys. Individuals with the knowledge and expertise relevant to the health needsof the community were consulted. These individuals included representatives from state, local orother regional governmental public health departments (or equivalent department or agency) aswell as leaders, representatives, or members of medically underserved, low-income, and minoritypopulations. Where applicable, other individuals with expertise of local health needs wereconsulted. For a complete list of individuals who provided input, see Appendix B.Community input complemented the quantitative data by adding context and providing a deeperunderstanding of the unique needs of their communities. As members of the communities, inputgleaned from the members themselves offered specialized knowledge of community conditions,available resources and relevant solutions.ii. Methodology for collection and interpretationIn-depth interviews: Between August and September 2018, a total of 20 telephone interviewswith 22 health officials representing each of the 15 CHNA counties and cities were conducted.Only leaders who were not interviewed during the 2016 CHNA were interviewed to avoid duplicatedata collection. In addition to local Public Health Departments, key informants from State HealthDepartments’ Office of Health Equity were interviewed in order to gain a fuller understanding ofneeds in relation to health equity. Interviews were confidential and interviewers adhered tostandard ethical research guidelines.Conversations were audio-recorded with the permission of the interviewee and a scribe providedwritten records of the discussion. Each interview lasted about 45 minutes. Interviewees identifiedcommunity health needs as well as existing community collaborations, assets and resources toaddress identified health needs. Interviewees ranked community health needs based on4United States Department of Health and Human Services, Office of Disease Prevention and HealthPromotion. Healthypeople.gov: Disparities. Available dation-health-measures/Disparities.13
perceived severity and detailed promising solutions and strategies to address the identified healthneeds.Transcriptions of the interviews were provided for qualitative analysis. Using grounded theorytechniques 5 and a code list based on the interview protocol and 13 health needs, the CHNA teammembers organized and grouped quotations by health need or other domain. Quotations werefurther analyzed to identify sub-themes within each health need, such as geographic areas, subpopulations with greater need, or key factors behind the health need. The CHNA team produceda coding memo for each service area to summarize frequencies, key quotes, and sub-themes.Sub-codes were generated for two health needs: 1) economic security data were coded for food,housing, and/or education, and 2) access was coded for transportation, access to mental healthservices, perceived lack of quality health care, lack of insurance and/or access to substanceabuse services. Interview data were summarized to generate frequencies for each health needby service area and region.Survey: Surveys provided a unique advantage during the 2019 KFHP-MAS CHNA health needsidentification and prioritization process as they facilitated the collection of data from a relativelylarge sample at a low cost. The survey method was ideal because it provided participants with astandardized tool for reporting identified health needs, thus reducing biases in interpretation.Finally, the survey method provided an opportunity for more stakeholders to be involved in thehealth needs identification and prioritization process than would otherwise have been possiblewith interviews alone.A sample of 216 community leaders with knowledge of the Mid-Atlantic States service areas wereinvited to participate in the online survey in September and October 2018. The ten-minute surveyincluded both open and closed-ended questions. Each respondent was asked to assign a severityscore to prominent health needs (poor health outcomes as well as underlying risk factors, ordrivers). Respondents were also given the opportunity to write in health needs that were notpreviously identified, highlighting potentially overlooked health challenges. Lastly, eachrespondent ranked their top three health needs in their respective communities.Of the 216 stakeholders asked to respond to the web-based survey, 103 responded to somequestions, although the number of respondents by question varied. Of the respondents whocompleted the entire survey,19 represented the BALT service area, 38 the NOVA service area,and 2
Permanente's vision for health equity, where all people can achieve the healthiest life possible, is the basis for our community health strategies. Better health outcomes begin where health starts, in our communities. Like our approach to medicine, our work in the community takes a prevention-focused, evidence-based approach. We