Transcription
Extrusion of Feather KeratinJustin R. Barone, Walter F. Schmidt, N. T. GregoireUSDA, ARS, ANRI, EQL, Beltsville, Maryland 20705Received 17 December 2004; accepted 27 June 2005DOI 10.1002/app.23501Published online in Wiley InterScience (www.interscience.wiley.com).ABSTRACT: Keratin obtained from poultry feathers wasextruded at 120 C using a combination of glycerol, water,and sodium sulfite as processing aids. Rheological properties were assessed as a function of water, glycerol, andsodium sulfite content as well as extruder die temperature.The lowest viscosity blends at a constant feather keratinconcentration of 60 wt % were found at glycerol concentrations that were higher than the water concentration andsodium sulfite concentrations of 3– 4 wt % of the featherkeratin fraction. For the melt state, higher or lower sodiumsulfite concentrations resulted in increased viscosity. In thesolid state, it was observed that processing induced orientation increased the tensile properties of the extrudates.Raman spectroscopy and DSC showed that there was atransition from -helix to -sheet at sodium sulfite concentrations of less than 4 wt %. At greater sodium sulfite concentration, increased crystallinity was found, because keratin chains could be extended more during processing. 2006INTRODUCTIONmethod to make biopolymers a “drop-in” replacementfor current synthetic polymers. Researchers have thermally processed proteins from soybean,24,25 sunflower,26 –28 corn,19,29,30 fish,31 milk,32 wheat,16,33 andfeather keratin.34 This includes compression-molding,injection-molding, extrusion, and internal batch mixing. If biopolymers from sustainable resources are tobe used commercially, the biopolymers have to beprocessed through preferred processing methods. Itbecomes imperative to identify biopolymers from sustainable resources that can be easily processed usingavailable technology.Feather keratin could be one such resource. Thereare 5 billion pounds of wet poultry feathers (2.5billion pounds dry) available as the result of U.S.poultry processing.35 Currently, the feathers are eitherprocessed into a low nutritional value animal feed orland-filled, both of which are a liability to the poultryindustry. Keratins are defined by the large amount ofthe amino acid cysteine compared with other proteins.36 Cysteine (C) is a sulfur-containing amino acidand can form sulfur–sulfur (S-S) cystine bonds withother intra- or intermolecular cysteine molecules. Intermolecular cystine bonds are referred to as“crosslinks.” The crosslinks plus other protein structural features, like crystallinity and hydrogen-bonding, give keratin high strength and stiffness.37 Theamount of cysteine varies depending on the keratinsource. Wool keratin contains 11–17% cysteine, whilefeather keratin contains about 7% cysteine.38,39 Thecystine bonds deliver strength and stiffness to thekeratin in the solid-state, while the cystine bonds arean impediment to processing in the melt-state. Solu-Extrusion processing of naturally-derived polymers orbiopolymers is a topic of much recent interest.Biopolymers from agricultural sources or from theagricultural waste stream are viewed as a viable alternative to petroleum-based polymers, if suitable processing techniques can be found. The biggest advantage of biopolymers over synthetic polymers is thatbiopolymers are sustainable and environmentalfriendly. Most research has focused on the thermalprocessing of carbohydrate biopolymers such asstarch.1,2 However, products made from starch usually have inferior physical properties to comparableproducts made from synthetic polymers. Therefore,attempts were made at blending starch with syntheticpolymers.3– 8 Recently, research has shifted focus tothe other biologically important polymer, protein,which may be more robust than carbohydrates. Proteins from wool and feather keratin,9 –11 gelatin,12 soybean,13,14 wheat,15–17 corn,18 –21 milk,22 and peanut23have been processed into films from solution. Solventcasting is tedious and can only be performed on asmall scale. In addition, if the solvents are volatile, thiswould defeat the purpose of environmental-friendliness. Thermal processing is viewed as the easiestCorrespondence to: J. R. Barone (baronej@ba.ars.usda.gov).Contract grant sponsor: Tyson Foods, Inc.Journal of Applied Polymer Science, Vol. 100, 1432–1442 (2006) 2006 Wiley Periodicals, Inc. *This article is a US Governmentwork and, as such, is in the public domain in the United Statesof America.Wiley Periodicals, Inc.* J Appl Polym Sci 100: 1432–1442, 2006Key words: biopolymers; proteins; extrusion; Raman spectroscopy
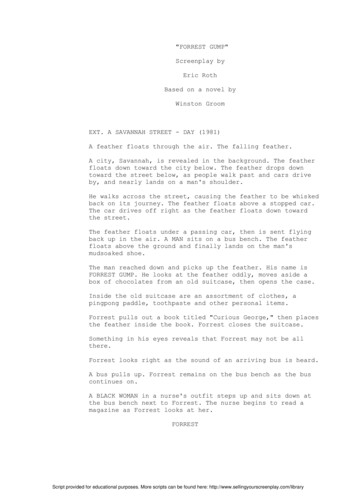
EXTRUSION OF FEATHER KERATINtion cast cysteine-containing proteins have been prepared using reducing agents to break the cystinebonds.10 One such reducing agent is sodium sulfite(Na2SO3), which has been used not only in solutionprocessing of proteins but also in thermal processingas well.26 Sodium sulfite as a redox reagent is approved for food and drug use and is often used in lowquantities as a preservative in food. Therefore, use ofsmall quantities of sodium sulfite would not compromise the environmental-friendliness of a thermallyprocessed polymer made using it.In this study, feather keratin waste from poultryprocessing is blended with sodium sulfite and glyceroland then extruded. The result can be a clear, flexiblepolymer extrudate if the blend composition and extrusion conditions are right. Glycerol is a commonlyused plasticizer in biopolymer processing and can alsobe obtained from the waste stream of the biodieselproduction process or directly from vegetable processing. The effect of feather keratin quality, glycerol concentration, water concentration, sodium sulfite concentration, and extrusion conditions on rheology andsolid-state properties is studied. The goal is to producean easily processed value-added product from a wastestream that is also completely environmental friendly.EXPERIMENTALFeather keratinFeather keratin was obtained from several sources.Pure keratin feather fiber and a mixed fiber/quill fraction were obtained from Featherfiber Corp. (Nixa,MO). A mixed fiber/quill fraction was also obtainedfrom Tyson Foods, Inc. (Rogers, AR). The FeatherfiberCorp. material was thoroughly washed with ethanolusing the process developed and patented by theUSDA.40 The Tyson Foods, Inc. material was washedand ground using the process that does not utilizeethanol.41 Difficulty in obtaining large, consistent supplies of each material for extrusion resulted in the useof the three different materials. Although quantitativecomparisons were difficult between each material,qualitative comparisons on blending and extrusion offeather keratin can easily be made.The as-received feather material was several millimeters in size or larger. Feather material was groundusing a Retsch PM 400 ball mill. Feather keratin wasloaded into 500 mL stainless steel grinding vessels sothat it occupied about a quarter of the volume. Thegrinding media was four 40-mm stainless steelspheres for a total of 1132 g grinding media. Grindingproceeded at 200 rpm for 10 –30 min. The groundfeather keratin was then sieved by hand through asieving stack with sizes ranging from 0.1 to 0.0038 cm.Typical results showing the weight fraction of feathermaterial remaining above each sieve are shown in1433Figure 1 and grinding of the different feather materialsgave similar results. As expected, grinding reducedthe average fiber size, from greater than 1 mm for nogrinding to 0.589 mm after 10 min, 0.246 mm after 20min, and 0.0053 mm after 30 min. The properties offeather keratin have been described extensively elsewhere.34,37,38,42Blend preparationSodium sulfite (Mallinckrodt, reagent grade, mol. wt. 126.04 g/mol, density 2.63 g/cm3) was dissolvedin deionized water (DI-H2O) at various concentrationsoutlined in the Results and Discussion. Sodium sulfiteis a redox reagent and will allow for the breaking ofsulfur–sulfur bonds between cysteine residues duringextrusion (reduction) resulting in a lower apparentviscosity, a. After extrusion, the sulfur–sulfur bondscan re-form (oxidation). Dissolution of sodium sulfitewas aided by stirring. The maximum solubility ofsodium sulfite in water is 1 : 3.43 Glycerol (Sigma–Aldrich, 99 %, mol. wt. 92.1 g/mol, boiling point 290 C, density 1.26 g/cm3) was added to theaqueous solution and further mixed for a few minutes.The ground feather keratin was put into a Waringkitchen blender and the liquid was added. The powder was mixed for 2 min on high-speed, using a plasticspatula to vigorously move material out of the stagnant areas of the blender and into the flow. After 2min, mixing is stopped, the blender capped andshaken by hand for about a minute, and the highspeed blender mix repeated. During each break inmixing, the mixing blade and blender are felt for heatand the equipment was, at most, warm to touch. Themixing times were decided upon so that liquid wouldbe incorporated into the ground feather keratin without heating the protein.ExtrusionExtrusion was performed on a 3/4 in. single-screwextruder (SSE) from Brabender powered by a PrepCenter drive. The length to diameter ratio of thebarrel was 25 : 1 and had a 3 : 1 compression ratioscrew. A slit die was used that was W 2.54 cm wide,H 0.05 cm thick, and L 0.90 cm long, and so theaspect ratio of the die is L/H 18. The extruder barrelhad three temperature zones and a fourth temperaturezone was located on the die, all heated with bandheaters. A fifth temperature zone was added at theconfluence of the barrel and die and was maintainedat the same temperature as the third barrel temperature closest to the die. Extruder motor speed was setand melt pressure, P, was measured at the confluenceof the barrel to the die, or at the die entrance. Apparent shear stress, a, was defined as a PH/2L. Thevolumetric flow rate of material, Q, was calculated
1434BARONE, SCHMIDT, AND GREGOIREFigure 1 Feather material size distribution following grinding. [Color figure can be viewed in the online issue, which isavailable at www.interscience.wiley.com.]from Q m/t, where m/ t was the mass of extrudateflowing per unit time and was the density of theflowing melt. The density of the material was determined from the equation (wk/ wk wg/ g ww/ w ws/ s) 1, where w is weight fraction, isdensity, and k, g, w, and s denote keratin, glycerol,water, and sodium sulfite, respectively. Apparentshear rate, a, was then defined as a 6Q/WH2.Apparent viscosity, a, was then a a/ a.was performed using a Com-Ten Industries 95 RCTest System. Extrudates 10.2 cm or 15.2 cm long (depending on study) were tested using a gauge length of5.1 cm or 10.2 cm. The applied crosshead speed was2.54 cm/min. A minimum of six extrudates for eachcondition was tested at room temperature and humidity.Differential scanning calorimetryMechanical testing of extrudatesMechanical testing of the extrudates was performedimmediately after extrusion. Uniaxial tensile testingThe thermal properties of the extruded feather keratinpolymers were assessed using differential scanningcalorimetry (DSC). A TA Instruments DSC 910s was
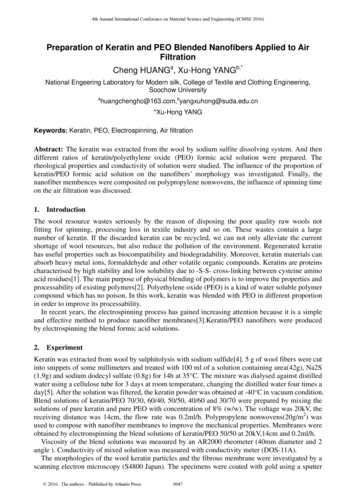
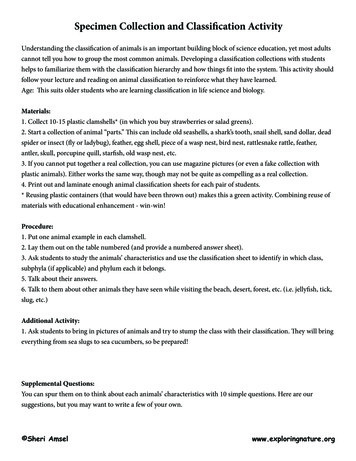
EXTRUSION OF FEATHER KERATIN1435used according to the procedures outlined in ASTMD3417 and D3418. Sample sizes of 3–5 mg were usedin a N2 atmosphere. Only one heating cycle from 30 Cto 300 C at 10 C/min was used.Raman spectroscopyA Raman spectrometer from Horiba/Jobin-Yvon wasused to examine molecular level interactions of thefeather keratin polymer. The instrument was aLabRam HR Raman microscope. The incident beamhad a wavelength of 633 nm. The samples were analyzed simply by placing them into the incident beampath under the microscope and recording a spectrum.The spectral range was from 3500 to 200 cm 1. Theobtained dispersive spectra were baseline correctedand the carbonyl peaks fitted to a Lorentzian equation.The carbonyl peaks were used to compare relativeabundance of -helical, -sheet, and random coil peptide backbone structures. At least two different sitesper sample were scanned as a check for samplinguniformity.Solid-stateFigure 2 Effect of initial feather material size on extrudateproperties.13C-NMRSpectra were collected on a Bruker QE 300 NMR spectrometer at a field strength of 7 T. The 13C spectra wererecorded at 75 MHz with a spectral width of 250 ppm,typically with 1 k scans, 16 k data points, zero-fillingto 32 k data points, and a line broadening of 7 Hz. Thinfilms 2 cm wide were rolled around a 1-mm capillarysealed tube containing DMSO-d6, which was then inserted to fill a standard 5-mm NMR tube. The resulting samples were run deuterium locked as 120 C. The13C spectra were collected using an APT pulse program to aid in the potential identification of any unknown peaks (OCH2O and OCAO peaks were allabove the baseline, OCHO and OCH3 peaks werealways below the baseline).44RESULTS AND DISCUSSIONEffect of initial feather keratin sizeBlends of the mixed feather fiber/quill material(Featherfiber Corp.) ground for 0, 10, 20, and 30 min,glycerol, DI-H2O, and Na2SO3 at 60 : 30 : 8 : 2 wt %,respectively, were extruded at a motor speed of 25rpm. The extruder temperature profile was 100 –100 –100 C with 120 C at the die. There did not appear tobe a significant effect of initial size on the rheologicalproperties. However, Figure 2 shows that the solidstate properties of the extrudates were affected by theinitial feather keratin material size. The modulus, E,was not affected significantly. But, stress at break, b,and strain at break, b, decreased as initial materialsize increased. The creation of the feather keratin poly-mer in the extruder relies on the reaction of the aqueous sodium sulfite/glycerol with the solid keratin particles. In this case, smaller particles have increasedsurface area, which allows for more diffusion of theliquid into the solid and a more complete reaction.More completely reacted keratin particles result inbetter physical properties of the polymer.Effect of barrel and die temperatureFigure 3 shows the effect of different barrel and dietemperatures on rheology for a mixture of groundfeather fiber (Featherfiber Corp.), glycerol, DI-H2O,and Na2SO3 at 60 : 30 : 8 : 2 wt %, respectively. Twobarrel temperature profiles were used over the threebarrel heating zones: 100 –100 –100 C and 120 –120 –120 C. In addition, two die temperatures of 120 and140 C were used. The data were the result of severalexperiments conducted over a range of applied extruder motor speeds. The amount of error between theexperiments can be found by comparing the measuredapparent viscosity values for a given data set at aconstant apparent shear rate. The rheology of featherkeratin blends at the specified temperatures showsstrong shear-thinning behavior usually displayed bythermoplastic melts, that is, (log ha) (log a) 0.75In general, lower barrel and die temperature resultin higher viscosity. However, there was a moremarked lowering of apparent viscosity by using ahigher barrel temperature rather than just a higher dietemperature. Removal of the die showed that the keratin mixture formed a polymer inside of the extruder
1436Figure 3 Rheology of 60 : 30 : 8 : 2 keratin:glycerol:H2O:Na2SO3 blends at two different barrel and die temperatures.Figure 4 Rheology of keratin blends with 2% Na2SO3 andvarious amounts of keratin, glycerol, and H2O.BARONE, SCHMIDT, AND GREGOIREFigure 5 Rheology of keratin blends with 60% keratin, 20%glycerol, and varying amounts of Na2SO3 and H2O.Figure 6 The effect of Na2SO3 concentration on apparentviscosity.
EXTRUSION OF FEATHER KERATIN1437Figure 7 DSC of blends shown in Figures 5 and 6. [Color figure can be viewed in the online issue, which is available atwww.interscience.wiley.com.]at a barrel temperature of 120 C. However, at a barreltemperature of 100 C, the material exited the extruderthe same way it entered, as a powdery mixture. Therefore, the polymer formed inside of the die that was setat 120 C. This was the origin of the larger split between the different barrel temperatures and differentdie temperatures.Effect of water and glycerol contentFigure 4 shows the results of varying the ratio ofglycerol to water in a mixture of ground feather fiberkeratin (Featherfiber Corp.), glycerol, DI-H2O, andNa2SO3. The sodium sulfite concentration was heldconstant at 2 wt % of the total blend concentration,and the feather keratin concentration was either 50 or60 wt % of the total blend concentration. The balancewas a combination of water and glycerol to yieldblends of keratin : glycerol : DI-H2O : Na2SO3 of 60 :30 : 8 : 2, 60 : 20 : 18 : 2, 60 : 10 : 28 : 2, 50 : 30 : 18 : 2,50 : 20 : 28 : 2, and 50 : 10 : 28 : 2 wt %, respectively.The extruder temperature profile was 100 –100 –100 –120 C. The results in Figure 4 show that varying thewater to glycerol ratio creates a “master-curve,” wheremore glycerol results in a lower viscosity and fasterflow while more water results in a higher viscosityand slower flow. This was probably the result of theloss of water by evaporation during extrusion. Theeffect of solids concentration was noteable, as the 60wt % feather keratin data (open symbols) were higherin apparent viscosity (further left on the curve) thanthe 50 wt % feather keratin data (closed symbols)because there was more liquid in the 50 wt % featherkeratin blend. Again, the feather keratin melts showedstrong shear-thinning behavior with a scaling similarto the data in Figure 3.Effect of sodium sulfite concentrationFigure 5 shows the flow curves for feather keratinblends when the amount of sodium sulfite in the formulation was varied. The feather material used wasthe mixed quill/fiber fraction from Featherfiber Corp.The amount of feather material and glycerol were keptconstant at 60 wt % and 20 wt %, respectively. Thesodium sulfite concentration was varied as a percent-
1438BARONE, SCHMIDT, AND GREGOIREFigure 8 CAO stretching region of feather keratin obtained with Raman spectroscopy. [Color figure can be viewed in theonline issue, which is available at www.interscience.wiley.com.]age of the feather keratin used. For instance, 1%Na2SO3 refers to 1% by weight of the 60 wt % offeather keratin used or 0.6 wt % of Na2SO3 relative tothe total formulation. Multiple extruder runs wereperformed.The flow curves show that there is a progressivechange in the scaling of the apparent shear rate withthe apparent shear stress from (log a) (log a)1 at1–3% Na2SO3 to (log a) (log a)2 at 4 – 6% Na2SO3.This suggests that there was a change in the molecularstructure of the feather keratin polymer with increasing Na2SO3 concentration. This may indicate that thesodium sulfite was significantly altering the polydispersity or perhaps the amount of branching of thekeratin molecules in the melt. Over a similar apparentshear stress range, stronger shear-thinning behavior,that is, increased scaling of the log–log apparent shearrate-apparent shear stress curve, indicates a widermolecular weight distribution or the presence of longchain branches.45The flow curves show that the apparent viscosityprogressively decreased as sodium sulfite concentration was increased up to 3% of the feather keratinconcentration before increasing again. The apparentviscosity at apparent shear stress values of a 0.2MPa and 0.5 MPa is plotted as a function of sodiumsulfite concentration in Figure 6. A minimum in apparent viscosity is observed in both cases at 3%Na2SO3 relative to feather keratin or 1.8 wt % of sodium sulfite in the total blend concentration. Orliac etal. observed a decrease of viscosity up to 2.4 wt %sodium sulfite when extruding sunflower protein isolate, followed by a viscosity increase with increasedaddition of sodium sulfite.36 These researchers attributed the viscosity increase to an increased breaking ofdisulfide bonds and perhaps greater protein extensionor to the fact that sodium sulfite might act as a chargeor complexing agent. Any viscosity reduction becauseof sodium sulfite would arise from intermolecular S-Sbond reduction. So the minimum values observed in
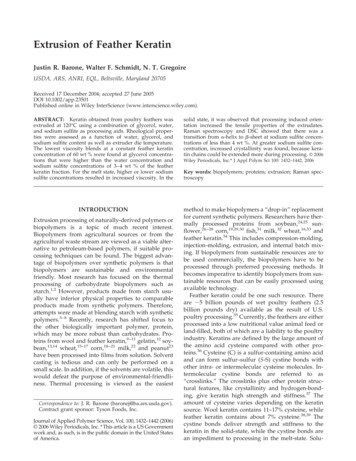
EXTRUSION OF FEATHER KERATIN1439Figure 9 CH2 region of feather keratin obtained with Raman spectroscopy. [Color figure can be viewed in the online issue,which is available at www.interscience.wiley.com.]the sodium sulfite concentration studies may revealthe amount of intermolecular disulfide or cystinebonds in the protein. Feather keratin has 7% cysteinein its amino acid sequence.39 Therefore, about 43%(3/7) of the cysteine amino acids can form intermolecular cystine bonds using this reasoning.At greater sodium sulfite concentration, the rise inviscosity could at least be partially attributed to thelack of liquid, as evidenced in Figure 2. However, thisdifference was slight and probably not responsible forsuch a dramatic change in the rheology. DSC resultsfor the extrudates are plotted in Figure 7 for extrudates obtained at similar extrusion conditions. A crystalline peak is shown for the feather keratin polymers.The crystalline peak becomes more developed withincreasing Na2SO3 concentration. At 5 and 6%Na2SO3, the peak is large and sharp and at highertemperatures than the 1– 4% Na2SO3 samples. All ofthe samples were obtained under similar extrusionconditions, and so there does not appear to be anydeformation-induced crystallinity from extrusion.However, the notion of Orliac et al. surmising that thekeratin molecules become more extended because ofless disulfide linkages may be a possible explanation.All of the intermolecular S-S bonds may be gone at 3%Na2SO3, resulting in the lowest melt viscosity. Continued addition of Na2SO3 may break intramolecular S-Sbonds, which are holding portions of the keratin molecule together. S-S bonds between two different molecules may be more accessible than S-S bonds betweendifferent portions of the same molecule, resulting inthe observed behavior. If there are less intramoleculardisulfide linkages, more of the keratin molecule is freeto rearrange in the reduced melt state and crystallizeupon oxidation, resulting in increased crystallinity.Raman spectroscopy is one possible method tomonitor disulfide linkages in keratin.46,47 The sulfur–sulfur (S-S) bonds appear as weak peaks in the 500 –550 cm 1 range of the spectrum. In Raman experiments on the feather keratin polymers, no S-S peaks
1440Figure 10 Initial extrudate swell ratio for rheological datadepicted in Figure 3.were found outside of the background noise of thespectra, probably because they were too weak. However, other discernible peaks reveal important information about the structure of the polymers as a function of sodium sulfite concentration. Figure 8 showsthe carbonyl region of the Raman spectrum for thekeratin polymers. Shown are the 2, 4, and 5% Na2SO3samples. At 2% Na2SO3, there is a strong peak at 1665cm 1 indicative of a -sheet fraction of keratin. Thereis a small shoulder on this peak at about 1610 cm 1,which may be indicative of the carbon– carbon doublebond on the aromatic ring of tyrosine or phenylalanine, which comprise 1.4 and 3.1 wt % of featherkeratin, respectively.46 As Na2SO3 concentration is increased to 4%, the peak at 1665 cm 1 decreases whilethe peak at 1610 cm 1 becomes more pronounced. At5% Na2SO3, the amide carbonyl peak at 1665 cm 1completely disappears, with two pronounced peaks at1605 and 1580 cm 1 appearing. The peaks at 1605 and1580 cm 1 have been assigned to tyrosine and phenylalanine, respectively.46 These changes together demonstrate that a major disruption of the -sheet formation occurred. As Na2SO3 concentration was increased, more disulfide bonds were reduced and moreof the keratin molecule was exposed to additionalredox reaction. In this case, there was a significantrearrangement of the keratin molecule to expose theportions that contain aromatic rings. This was not sosurprising as the portions of the peptide backbonewith the large aromatic side chains may be too steri-BARONE, SCHMIDT, AND GREGOIREcally hindered to return to their original position oncethe cystine bonds holding them in a strained locationwere broken. The appearance of a new peak at 1735cm 1 for the 5% Na2SO3 extrudate may be indicativeof degradation or rearrangements along the peptidebackbone. These changes at some sites in keratin couldpotentially disrupt the uniformity of the -sheet as awhole.Additional evidence of the rearrangement of thekeratin backbone after redox treatment is found inFigure 9. The 4% and 5% Na2SO3 spectra are shown,which was where the transition from low to highcrystallinity was detected in DSC. The CH2 scissorpeak in the 4% spectrum at 1460 cm 1 was observed at1450 cm 1 in the 5% spectrum. The appearance of anew peak at 1375 cm 1 in the 5% spectrum is at thenormal frequency for symmetrical CH3 scissors motion, for example, on alanine.48 In the absence of the -sheet in the 5% sample, the mobility of one or moreof the OCH3 groups on keratin may have increased.All of this is consistent with previous results whereNishikawa et al. show that reduction and subsequentoxidation of human hair keratin results in the decreaseof the -helix conformation with new disorderedstructures forming.49Extrudate swellThe extrudate swell ratio is defined as the extrudatethickness, H , relative to the slit die thickness, H. InFigure 11 Effect of initial material quality on extrudatephysical properties.
EXTRUSION OF FEATHER KERATIN1441Figure 12 Solid-state NMR spectra of Tyson and Featherfiber extrudates.this study, the initial extrudate swell ratio, (H /H)0 isplotted, which is the swell ratio immediately uponexiting the die.50,51 Extrudate swell is the recovery ofdeformation imposed onto the flowing polymer during extrusion. Figure 10 shows the initial extrudateswell ratio for the rheological data presented in Figure3. The extrudate swell grew with increasing apparentshear stress, which was expected because the higherthe apparent shear stress, the more imposed deformation. At a given apparent shear stress, higher die temperatures result in more extrudate swell. Extrudateswelling of 20 – 80% was observed for the blends overthe range of apparent shear stress used. Largeamounts of extrudate swell are not uncommon forpolymers and are important in some applications likefilm extrusion or blowing, where the polymeric filmexits the die and then is drawn-down a large amountby a calender or film blower. Large amounts of extrudate swell correlate with melt elasticity or large firstnormal stress difference, N1.52 So, the feather keratinpolymer has a fair amount of melt elasticity thatwould make it preferential to use in film making processes. Film made from feather keratin would be biodegradable and could therefore be used for packaging,for instance.Quality of feather keratin materialFigure 11 shows the solid-state tensile properties ofthree different extrudates plotted as a function of apparent shear stress during extrusion. The three different extrudates were the material from Tyson Foods,Inc. ground for 10 (T-10 min) and 30 (T-30 min) minand the feather fiber fraction from Featherfiber Corp.ground for 30 (FF-30 min) min. All blends were 60 :30 : 8 : 2 wt % of feather keratin, glycerol, DI-H2O,and Na2SO3, respectively. Extrusion occurred at atemperature profile of 100 –100 –100 –120 C. Shown inthe inset is the rheological data corresponding to thetensile data. Both the modulus and breaking strengthof the extrudates increased with the increasing apparent shear stress, during extrusion. It is well knownthat polymer molecules are more oriented at higherextrusion stresses and increased molecular orientationwas a factor in the higher modulus and breaking stressobserved. However, the three different feather keratinsamples also contributed to the observed rheologicaland mechanical differences.The difference in properties between identicalblends of samples T-10 min, T-30 min, and FF-30 minoriginated in how effective the glycerol was in plasticizing each sample. Nuclear magnetic resonance
1442(NMR) spectroscopy of the extrudates showed sharperpeaks at 81 ppm and 72 ppm for the Featherfiberkeratin material over the Tyson keratin material (Fig.12). The difference in the peak quality was indicativeof increased hydrogen bonding in the Tyson keratinmaterial, which may also be responsible for the increased mechanical properties. New peaks at 73 ppmand 69 ppm for the Tyson keratin material indicate thepresence of a lipid contaminant, which was not eradicated during cleaning. The increased hydrogen bonding in the Tyson material was not surprising, becauseit was not cleaned and dried as thoroughly as theFeatherfiber material and therefore contains more water. In addition, less glycerol was probably availablefor keratin plasticization because some associatedwith the lipid. In contrast, all of the glycerol used inthe Featherfiber material went to keratin plasticizationas seen by the sharp peaks at 81 and 72 ppm. So, theFF-30 min extrudate was more plasticized, which resulted in a lower melt viscosity, a more flexible material, and a lower strength to break. Coincidentally, theT-30 min material, with a smaller particle size, stillshowed increased physical properties over the T-10min sample, with a larger particle size, concurrentwith Figure 2.The authors thank Horiba/J. Yvon for the use of their LabRam HR Raman microscope.References1. Rouilly, A.; Rigal, L. J Macromol Sci Polym Rev 2002, C42, 441.2. Bayer, R. K.; Lindemann, S.; Dunkel, M.; Cagiao, M. E.; Ania, F.J Macromol Sci Phys 2001, B40, 733.3. DeGraaf, R. A.; Janssen, L. P. B. M. Polym Eng Sci 2001, 41, 584.4. Biresaw, G.; Carriere, C. J. J Polym Sci Polym Phys 2001, 39, 920.5. Park, J. W.; Im, S. S.; Kim, S. H.; Kim, Y. H. Polym Eng Sci 2000,40, 2539.6. Zhou, G.; Willett, J. L.; Carriere, C. J. Polym Eng Sci 2001, 41,1365.7. Averous, L.; Fringant, C. Polym Eng Sci 2001, 41, 727.8. Rodriguez-Gonzalez, F. J.; Ramsay, B. A.; Favis, B. D. Polymer2003, 44, 1517.9. Yamauchi, K.; Yamauchi, A.; Kusunoki, T.; Kohda, A.; Konishi,Y. J B
flowing per unit time and was the density of the flowing melt. The density of the material was deter-mined from the equation (w k / w k w g / g w w / w w s / s) 1, where w is weight fraction, is density, and k, g, w, and s denote keratin, glycerol, water, and sodium sulfite, respectively. Apparent shear rate, a, was then defined as a .