Transcription
Newton Medical CenterCommunity Health Needs Assessment2019-2021
NEWTON MEDICAL CENTERACKNOWLEDGEMENTS & CHNA COMPLIANCEAtlantic Health System – Newton Medical Center (NMC) acknowledges the hard work and dedication of theindividuals and the organizations they represent who contributed to NMC’s Community Health Needs Assessment.The 2019-2021 Newton Medical Center Community Health Needs Assessment (CHNA) was approved by NMC’sCommunity Health Committee in December 2019. Questions regarding the Community Health Needs Assessmentshould be directed to:Atlantic Health SystemNewton Medical CenterPlanning & System Development973-660-3522A copy of this document has been made available to the public via Atlantic Health System’s website munity-health-needs-assessment.html. The public may also view a hard copy of this document bymaking a request directly to the office of the President, Newton Medical Center.COMPLIANCE CHECKLIST: IRS FORM 990, SCHEDULE HPart V Section B Line 1aA definition of the community served by the hospital facilityPart V Section B Line 1bDemographics of the communityPart V Section B Line 1cExisting health care facilities and resources within the community that are available to respondto the health needs of the communityPart V Section B Line 1dHow data was obtainedPart V Section B Line 1fPrimary and chronic disease needs and other health issues of uninsured persons, low-incomepersons, and minority groupsPart V Section B Line 1gThe process of identifying and prioritizing community health needs and services to meet thecommunity health needPart V Section B Line 1hThe process for consulting with persons representing the community’s interestsPart V Section B Line 1iInformation gaps that limit the hospital facility’s ability to assess the community’s health needsPlanning & System DevelopmentREPORT PAGE(S)47 and Appendix AAppendix GAddressed ThroughoutAddressed Throughout66None IdentifiedPage 1
NEWTON MEDICAL CENTERCONTENTSEXECUTIVE SUMMARY . 3COMMUNITY HEALTH NEEDS ASSESSMENT OVERVIEW . 4Organization Overview . 4Community Overview . 5SECONDARY DATA PROFILE OVERVIEW . 7Demographic Statistics . 7Health Status Indicators . 9Mortality Rates . 19SocioNeeds Index . 19Ambulatory Care Sensitive Conditions . 21Localized Acute Care Disease Utilization Rates . 22KEY INFORMANT FINDINGS . 28IDENTIFICATION OF COMMUNITY HEALTH NEEDS . 34Prioritization . 34Identified Health Priorities - Overview . 35APPENDIXA: Demographic Tables . 53B: Secondary Data Sources . 58C: Secondary Data Indicators. 59D: Key Informant Tool. 65E: Key Informant Survey Participants . 70F: Prioritization Participants . 71G: Sussex County Licensed Health Facilities . 72Planning & System DevelopmentPage 2
NEWTON MEDICAL CENTEREXECUTIVE SUMMARYNewton Medical Center (NMC) is committed to the people it serves and the communities where they reside.Healthy communities lead to lower health care costs, robust community partnerships, and an overall enhancedquality of life. To that end, beginning in June 2019, NMC, a member of Atlantic Health System (AHS), undertooka comprehensive community health needs assessment (CHNA) to evaluate the health needs of individuals livingin the hospital service area, that encompasses portions of Sussex and Warren counties in New Jersey as well asportions of Pike County in Pennsylvania. The purpose of the assessment was to gather current statistics andqualitative feedback on the key health issues facing residents of NMC’s service area. The assessment examineda variety of health indicators including chronic health conditions, access to health care, and social determinantsof health.The completion of the CHNA provided NMC with a health-centric view of the population it serves, enabling NMCto prioritize relevant health issues and inform the development of future community health implementationplan(s) focused on meeting community needs. This CHNA Final Summary Report serves as a compilation of theoverall findings of the CHNA process. This document is not a compendium of all data and resources examined inthe development of the CHNA and the identification of health priorities for NMC’s service area, but rather anoverview that highlights statistics relevant to NMC’s health priorities for the CHNA/CHIP planning andimplementation period.CHNA Components Secondary Data ResearchKey Informant SurveyPrioritization SessionImplementation PlanKey Community Health IssuesKey Community Health IssuesNewton Medical Center, in conjunction with community partners, examined the findings of the Secondary Dataand Key Informant Interviews to select Key Community Health Issues. The following issues were identified andadopted as the key health priorities for NMC’s 2019-2021 CHNA: Barriers to Access to Health Education & ResourcesCancerDiabetes & Unhealthy WeightHeart Disease & StrokeMental HealthSubstance MisuseBased on feedback from community partners, health care providers, public health experts, health and humanservice agencies, and other community representatives, Newton Medical Center plans to focus on multiple keycommunity health improvement efforts and will create an implementation strategy of their defined efforts, to beshared with the public on an annual basis.Planning & System DevelopmentPage 3
NEWTON MEDICAL CENTERCOMMUNITY HEALTH NEEDS ASSESSMENT OVERVIEWOrganization OverviewNewton Medical Center is home to over 1,100 employees and over 350 physicians. As part of its communitybenefit programs, NMC provides screenings, health education programs, classes, support groups, vaccinationsand health professions education.Since 1932, Newton Medical Center has been providing care to the people of Sussex and Warren counties in NewJersey, Pike County in Pennsylvania and southern Orange County in New York. NMC is home to the Center forBreast Health, the only one of its kind in Sussex County, addressing all woman’s breast health needs with stateof-the-art technology, resources, education, support and follow-up care. Newton Medical Center recentlyachieved the American Nurses Credentialing Center’s Pathway to Excellence designation and is one of a select fewhealth care facilities in New Jersey accredited by the Inter-societal Accreditation Commission (IAC) in all threeechocardiography procedures: adult transthoracic, adult transesophageal and adult stress.Newton Medical Center provides emergency care that is close to home for many in northern New Jersey withaccess to high-tech specialty services available through Atlantic Health System, when needed. Atlantic HealthSystem provides access to renowned specialists, clinical trials, innovative technology and medical treatments, andcompassionate support services right here in NJ. Our vast network of hospitals and providers spans 11 counties,so patients can enter our all-encompassing community of cancer care no matter where they live or work.Atlantic Health System participates in and provides financial support to the North Jersey Health Collaborative(NJHC), an independent, self-governed 501(c)(3) organization with a diverse set of partners representing healthcare, public health, social services and other community organizations. NJHC’s function is a shared process ofcommunity needs assessment and health improvement planning to identify the most pressing health issues andfacilitate the development of collaborative action plans to address them. By working together NJHC partners arestrategically aligning their efforts and resources to achieve collective impact on the health of our communities,accomplishing together what we could never do alone.Atlantic Health System participates in the New Jersey Healthy Communities Network (NJHCN) and commits annualfunding to their Community Grants Program, which brings together local, regional, and statewide funders, leadersand partners to support communities in implementing healthy eating and active living strategies to advanceenvironment, policy and system changes. Since 2011, the NJHCN Community Grants Program has provided 3.2million in grants. NJHCN Community Grants Program funding collaborative consists of Atlantic Health System, NewJersey Department of Health, New Jersey Health Initiatives, New Jersey Partnership for Healthy Kids, Partners forHealth Foundation, and Salem Health & Wellness Foundation. Evaluation for the Community Grants Program isconducted by Center for Research and Evaluation on Education and Human Services (CREEHS) at Montclair StateUniversity.Community OverviewNMC defines the area it serves as the geographic reach from which it receives 75% of its inpatient admissions. ForNMC, this represents 11 ZIP Codes, encompassing portions of Warren and Sussex counties in New Jersey and PikeCounty in Pennsylvania 1 There is broad racial, ethnic, and socioeconomic diversity across the geographic areaserved by NMC, from more populated suburban settings to rural-suburban areas of the state. Throughout the1Source: NJDOH Discharge Data Collection System – UB-04 Inpatient DischargesPlanning & System DevelopmentPage 4
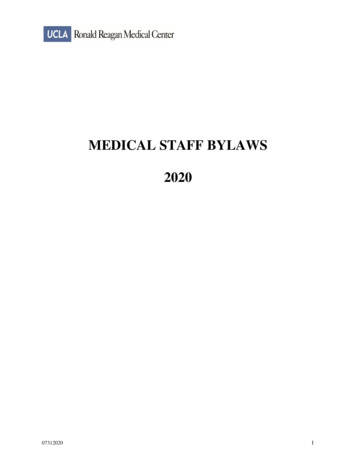
NEWTON MEDICAL CENTERservice area, NMC always works to identify the health needs of the community it serves. Following are the townsand cities served by NMC.ZIP EXBRANCHVILLELAFAYETTESPARTAMILFORDNMC STARK SERVICE AREACOUNTYZIP c Area Served by Newton Medical CenterPlanning & System DevelopmentPage 5
NEWTON MEDICAL CENTERMethodologyNMC’s CHNA comprised quantitative and qualitative research components. A brief synopsis of the components isincluded below with further details provided throughout the document: A Statistical Secondary Data Profile depicting population and household statistics, education andeconomic measures, morbidity and mortality rates, incidence rates, and other health statistics for primaryand secondary service areas was compiled with findings presented to advisory committees for review anddeliberation of priority health issues in the community. A Key Informant Survey was conducted with community leaders and partners. Key informants representeda variety of sectors, including public health and medical services, non-profit and social organizations,public schools, and the business community.Analytic SupportAtlantic Health System’s corporate Planning & System Development staff provided NMC with administrative andanalytic support throughout the CHNA process. Staff collected and interpreted data from secondary data sources,collected and analyzed data from key informant surveys, provided key market insights and prepared all reports.Community RepresentationCommunity engagement and feedback were an integral part of the CHNA process. NMC’s Community HealthDepartment played a critical role in obtaining community input through key informant surveys of communityleaders and partners and included community leaders in the prioritization and implementation planning process.Public health and health care professionals shared knowledge about health issues, and leaders andrepresentatives of non-profit and community-based organizations provided insight on the community, includingthe medically underserved, low income, and minority populations.Research LimitationsTimelines and other restrictions impacted the ability to survey all potential community stakeholders. NMC soughtto mitigate these limitations by including in the assessment process a diverse cohort of representatives or and/oradvocates for underserved population in the service area.Prioritization of NeedsFollowing the completion of the CHNA research, NMC’s Community Health Advisory Sub-Committee prioritizedcommunity health issues, which are documented herein. NMC will utilize these priorities in its ongoingdevelopment of a Community Health Improvement Plan which will be shared publicly on an annualbasis.SECONDARY DATA PROFILE OVERVIEWBackgroundOne of the initial undertakings of the CHNA was to evaluate a Secondary Data Profile compiled by the North JerseyHealth Collaborative and Atlantic Health System’s Planning & System Development department. This county andservice area-based profile is comprised of multiple data sources. Secondary data is comprised of data obtainedfrom existing resources (see Appendix B) and includes demographic and household statistics, education andincome measures, morbidity and mortality rates, health outcomes, health factors, social determinants of health,Planning & System DevelopmentPage 6
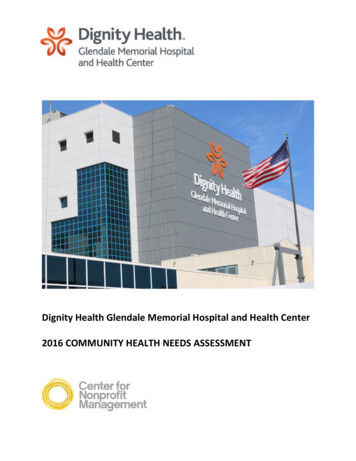
NEWTON MEDICAL CENTERand other data points. County-level secondary data were augmented, where possible, by ZIP Code level inpatientand emergency room utilization data for the entire NMC service area and, when available AHS specific health careutilization data.Secondary data was integrated into a graphical report to inform key stakeholders and NMC Community AdvisoryBoard’s Community Health Subcommittee of the current health and socio-economic status of residents in NMC’sservice area. Following is a summary of key details and findings from the secondary data review. A comprehensivedata report is available upon request from Atlantic Health System.Demographic Overview2Sussex County’s projected growth is -1.8% and NMC’s service area has a growth of -0.7%; only Hamburg has aprojected increase of 0.39%. At 274.97 residents per square mile, Sussex County is the 2nd least densely populatedcounty in New Jersey; the 21 counties range from a low of 183.02 population/sq. mile (Salem County) to a high of14,864.40 population/sq. mile (Hudson County). NMC’s service area is predominately White (Non-Hispanic). TheNew Jersey average for White (Non-Hispanic) is 53.9%, NMC’s service area is 86.4%. Over 97% of the population,ages 5 years and older, speak English only or speak English “very well”; this is 9 percentage points higher than theNew Jersey average.For 2019, the median household income for the NMC service area was over 90,159 which was 12,176 morethan the state average (Sparta was 179% greater than the state average). There were three towns over 100,000(Andover, Sparta and Blairstown) however, in 2024 there are projected five towns over 100,000. No towns areprojected to increase more than the state average.The state average for families below poverty was 7.8%; NMC’s service area was 3.8% and Sussex County was 3.8%.NMC’s service area has been projected to have a smaller increase in the ‘number of families below poverty’ thanthe state average; however, the number of Sussex County families has been projected to increase.Currently, there are about 4.8% of people within NMC’s service area receiving food stamps/SNAP benefits whichwas lower than the state average, 9.3%, and higher than Sussex County, 4,4%. Within NMC’s service area, therewere no towns higher than the state average.The New Jersey unemployment rate is 7.9%, NMC’s service area was 6.9% and the Sussex County rate was 7.1%.Out of the towns in the service area, 73% were below the state’s unemployment rate.The percent of the population within NMC’s service area that had ‘some high school education or less’ was lowerthan the New Jersey average; meaning that the area’s population was, on average, more educated.Health Insurance Coverage / Health Care Access and Payer Mix3The state average for uninsured was 10.7%; however, NMC’s service area and Sussex County were both less than7.5%. Every town in NMC’s service area was less than the state average, Montague had the largest uninsuredpercent at 10.6%.Health insurance coverage can have a significant influence on health outcomes. Among ED visits, NMC’sService Area is approximately 15.0% Medicaid/Caid HMO/NJ Family Care with another 6.0% of Self Pay/Charity23Please see Appendix A for tables with demographic information; Source: New Solutions/Claritas 2019-2024 Demographic FileSource: U.S. Census Bureau, 2012-2016 American Community Survey 5-Year EstimatesPlanning & System DevelopmentPage 7
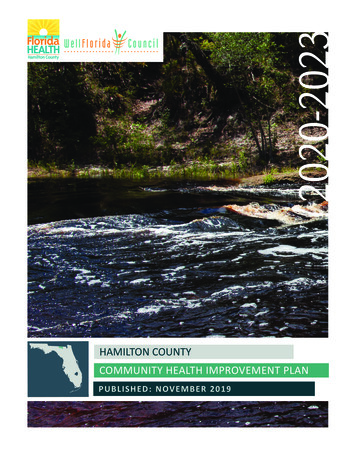
NEWTON MEDICAL CENTERCare. The area is approximately 58.0% Commercial and 21.0% Medicare/Care HMO. From a payer mixperspective, the ED payer distribution in the Service Area is largely similar to Sussex County overall and is morefavorably distributed than the statewide figures.Among inpatients, NMC’s Service Area is approximately 10.0% Medicaid/Caid HMO/NJ Family Care withanother 1.0% of Self Pay/Charity Care. The area is approximately 39.0% Commercial and 50.0% Medicare/CareHMO. From a payer mix perspective, the inpatient payer distribution in the Service Area is largely similar toSussex County overall and is more favorably distributed than the statewide figures.Payer Mix ComparisonNMC Service AreaEDED58%SUSSEX MC Service Area15%IPSUSSEX COUNTYNJAll Other PayersPlanning & System Development43%35%Medicaid/ Caid HMO/ NJ Family Care10%19%Medicare/ Care HMO46%42%2%4%Self Pay/ Charity/ UnderinsuredPage 8
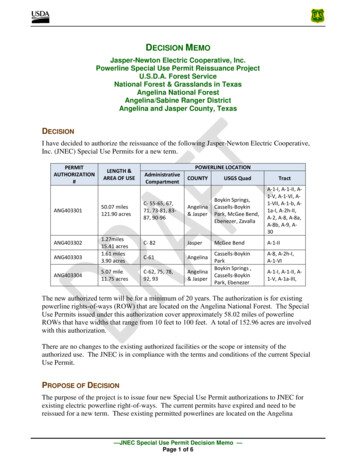
NEWTON MEDICAL CENTERHealth Status Indicators4A health status indicator describes an aspect of the population used to measure health or quality of life. Healthindicators may include measurements of illness or disease, as well as behaviors and actions related to health.Quality of life indicators include measurements related to economy, education, built environment, socialenvironment, and transportation. We know, from literature, that quality of life indicators may be drivers of healthstatus - which is why both categories of data (approximately 155 indicators) are included in this analysis.For each indicator, a county is assigned a score based on its comparison to four things: other NJ counties, whetherstate and national health targets have been met, and the directional trend of the indicator value over time. Thesefour comparison scores range from 0-3, where 0 indicates the best performance and 3 the worst. Availability ofeach type of comparison varies by indicator and is dependent upon the data source, comparability with datacollected for other communities, and changes in methodology over time. Where comparison data is not available,a neutral score is substituted. For ease of interpretation and analysis, indicator comparison scores of concern arevisually highlighted in red, showing how the county is faring in each category of comparison.Indicator scores are calculated as a weighted average of all included comparison scores. If none of the includedcomparison types are possible for an indicator, no score is calculated, and the indicator is excluded from the datascoring results. The weights of each comparison in calculating the indicator scores were decided by the DataCommittee of the North Jersey Health Collaborative. Specifically, this committee saw the value in comparing anindicator value against itself (the "trend") and against other local New Jersey counties, for the purposes ofprioritizing interventions, which is why these two comparisons are the most heavily weighted.The following tables represent the county-based scoring of specific health indictors. The data are organized bymajor indicator topic, indicator groupings, the specific indicators within that grouping and pertinent data pointsbased on available secondary data sources. An indicator can be compared against all US or NJ counties, US orStatewide values, relative to Healthy People 2020 or local targets and the trend of an indicator value. A scoregreater than 2 represents an indicator where the county performs at lower than preferred targets. Where apopulation segment disparity can be identified that population segment is noted.4Healthy Communities Institute/Conduent. Data Scoring Tool. New Jersey Health Matters. North Jersey Health Collaborative.Planning & System DevelopmentPage 9
NEWTON MEDICAL ICATORTOPICINDICATORAccess to Health ServicesPrimary Care Provider RateNon-Physician Primary Care Provider RateMental Health Provider RateDentist RateClinical Care RankingAdults with Health InsuranceChildren with Health InsuranceAdults who have had a Routine CheckupPreventable Hospital Stays: MedicarePopulationAdults Unable to Afford to See a DoctorMortality RankingPhysical Environment RankingClinical Care RankingHealth Behaviors RankingMorbidity RankingSocial and Economic Factors RankingState3322100113HealthAdults with Pneumonia VaccinationGonorrhea CasesAdults 50 with Influenza VaccinationChlamydia CasesImmunizations & Infectious Lyme Disease CasesDiseasesAge-Adjusted Rate of ED Visits Due to InfluenzaKindergartners with Required ImmunizationsAge-Adjusted Death Rate due to Influenza andPneumoniaTuberculosis Incidence Rate32010002Wellness & LifestyleHealthPrevention & SafetyDeath Rate due to Drug PoisoningPlanning & System DevelopmentHP2020TrendLocal Trend201Score 1.141.000.830000.4222221100County Health RankingsHealthTargetUS13100HealthInsufficient SleepLife ExpectancyMorbidity RankingLimited Activity due to a Health ProblemPoor Physical Health: Average Number of DaysFrequent Physical DistressSelf-Reported General Health Assessment: Pooror FairValueIdentifiedDisparityHispanic or 022302.171.331.251.170.670.500.5032.33Page 10
NEWTON MEDICAL TOPICINDICATORAge-Adjusted Death Rate due to UnintentionalInjuriesAge-Adjusted Death Rate due to UnintentionalPoisoningsAge-Adjusted Death Rate due to Motor VehicleCollisionsAdults who were Injured in a Fall: 45 Severe Housing tState3US113312HP20203TrendLocal Trend3Score 22.2522.0311.391.001.000130010DisabilitiesPersons with Disability Living in PovertyPersons with Disability Living in Poverty 3322111.781.721.641.58Heart Disease & StrokeAtrial Fibrillation: Medicare PopulationAge-Adjusted Death Rate due to HypertensiveHeart DiseaseStroke: Medicare PopulationHyperlipidemia: Medicare PopulationAge-Adjusted Death Rate due to Heart DiseaseAge-Adjusted Rate of Adult ED Visits for AcuteMyocardial InfarctionAdults who Experienced a StrokeAge-Adjusted Death Rate due to Heart AttackIschemic Heart Disease: Medicare PopulationAge-Adjusted Hospitalization Rate due to HeartAttackAdults who Experienced Coronary HeartDiseaseHypertension: Medicare PopulationHigh Blood Pressure PrevalenceAdults who Experienced a Heart AttackAge-Adjusted Death Rate due toCerebrovascular Disease (Stroke)Heart Failure: Medicare 0.81Age-Adjusted Death Rate due to DiabetesDiabetic Monitoring: Medicare PopulationAdults with PrediabetesDiabetes: Medicare PopulationAdults 20 with Diabetes21100Food Insecure Children Likely Ineligible forAssistance3DiabetesExercise, Nutrition, & WeightPlanning & System parityMalesPage 11
NEWTON MEDICAL matoid Arthritis or Osteoarthritis:Medicare PopulationDiabetes: Medicare PopulationPeople 65 Living AlonePeople 65 Living Below Poverty LevelOsteoporosis: Medicare PopulationHeart Failure: Medicare PopulationChildren with Low Access to a Grocery StorePeople with Low Access to a Grocery StoreSNAP Certified StoresPeople 65 with Low Access to a Grocery StoreGrocery Store DensityHouseholds with No Car and Low Access to aGrocery StoreLow-Income and Low Access to a Grocery StoreHealth Behaviors RankingFarmers Market DensityAdults 20 who are SedentaryRecreation and Fitness FacilitiesAdults 20 who are ObeseFast Food Restaurant DensityAccess to Exercise OpportunitiesAdults Engaging in Regular Physical ActivityFood Environment IndexChild Food Insecurity RateFood Insecurity 333122.441.500000000010010Oral Cavity and Pharynx Cancer Incidence RateDentist Rate3220Physical Environment RankingBlood Lead Levels in Children ( 5 microgramsper deciliter)Lyme Disease CasesEnvironmental & Occ. Health Asthma: Medicare PopulationAdults with Current Asthma2101201Melanoma Incidence RateOral Cavity and Pharynx Cancer Incidence RateNon-Hodgkin Lymphoma Incidence Rate232323332CancerPlanning & System DevelopmentIdentifiedDisparityLocal Trend00Oral HealthScore der Adults & ge 12
NEWTON MEDICAL lthINDICATORTOPICRespiratory DiseasesOther Chronic DiseasesPlanning & System DevelopmentINDICATORStateBreast Cancer Incidence Rate2Colorectal Cancer Incidence Rate2All Cancer Incidence Rate1Mammography Screening: Medicare Population3Mammogram in Past 2 Years: 50-742Age-Adjusted Death Rate due to Lung Cancer2Colon Cancer Screening1Age-Adjusted Death Rate due to Colorectal1CancerCancer: Medicare Population0Pancreatic Cancer Incidence Rate0Age-Adjusted Death Rate due to Cancer2Liver and Bile Duct Cancer Incidence Rate1Lung and Bronchus Cancer Incidence Rate2Prostate Cancer Incidence Rate0Pap Test in Past 3 Years: 21-651Age-Adjusted Death Rate due to Pancreatic0CancerAge-Adjusted Death Rate due to Breast Cancer0Cervical Cancer Incidence Rate0Age-Adjusted Death Rate due to 03223211210001000Chronic Kidney Disease: Medicare PopulationAdults with ArthritisRheumatoid Arthritis or Osteoarthritis:Medicare .471.44010302132Local Trend2Score 21.441.441.391.331.331.331.250.89Age-Adjusted Death Rate due to Chronic LowerRespiratory DiseasesAdults with Pneumonia VaccinationAdults 50 with Influenza VaccinationCOPD: Medicare PopulationAge-Adjusted Death Rate due to Lung CancerLung and Bronchus Cancer Incidence RateAge-Adjusted Rate of Adult ED Visits for COPDAdults with Current AsthmaAsthma: Medicare PopulationAge-Adjusted Death Rate due to Influenza andPneumoniaTuberculosis Incidence .890.6410.473231.671.610.83MalesMalesPage 13
NEWTON MEDICAL TOPICINDICATORHealthMortality DataMental Health & MentalDisordersPlanning & System DevelopmentTargetState0US1State0US0Age-Adjusted Death Rate due to SuicideDeath Rate due to Drug PoisoningAge-Adjusted Death Rate due to UnintentionalInjuriesAge-Adjusted Death Rate due to Chronic LowerRespiratory DiseasesAge-Adjusted Death Rate due to UnintentionalPoisoningsAge-Adjusted Death Rate due to Alzheimer'sDiseaseAge-Adjusted Death Rate due to HypertensiveHeart DiseaseInfant Mortality RateAge-Adjusted Death Rate due to Heart DiseaseMortality RankingAge-Adjusted
quality of life. To that end, beginning in June 2019, NMC, a member of Atlantic Health System (AHS), undertook a comprehensive community health needs assessment (CHNA) to evaluate the health needs of individuals living in the hospital service area, that encompasses portions of Sussex and Warren counties in New Jersey as well as