Transcription
Primary Health Network ProgramNeeds AssessmentWestern NSW Primary Health NetworkThis Needs Assessment report is for a three-year period and covers 1 July 2019 to 30 June 2022 andincludes a general population, mental health (including suicide prevention), alcohol and other drugtreatments, and Aboriginal people’s health (including chronic disease).Western NSW Primary Health Network Health Needs Assessment 2019-20221
Contents:Section 1: Narrativepages 3-6Section 2: Outcomes of the health needs analysispages 7-67(i) General populationpages 7-39(ii) Primary Mental Health Care (including suicide prevention)pages 40-44(iii) Alcohol and other Drug Treatment Needspages 45-52(iv) Aboriginal health (including chronic disease)pages 53-67Section 3: Outcomes of the service needs analysis pages 68-121(i) General populationpages 68-92(ii) Primary Mental Health Care (including suicide prevention)pages 93-105(iii) Alcohol and other Drug Treatment Needspages 106-110(iv) Aboriginal health (including chronic disease)pages 111-121Section 4: Opportunities, priorities and options . pages 122-148(i) General populationpages 122-130(ii) Primary Mental Health Care (including suicide prevention)pages 130-135(iii) Alcohol and other Drug Treatment Needspages 136-138(iv) Aboriginal health (including chronic disease)pages 139-148Section 4: Checklist page 149Western NSW Primary Health Network Health Needs Assessment 2019-20222
Section 1 – NarrativeNeeds Assessment processWestern New South Wales Primary Health Network (WNSW PHN) undertook a participatory needsassessment approach to identifying the key and service needs and set priorities, to be used as thebasis for developing service activity planning. Under the guidance of the WNSW PHN NeedsAssessment Project Advisory Committee, a comprehensive analysis of quantitative data from a varietyof sources including national, state and commissioned services databases was complemented by anextensive consultation with a broad cross section of stakeholders including: community members,consumers, carers, general practitioners, service providers, and key government and non-governmentorganisations.The key stages of the needs assessment included:(1) Project planningThe PHN established a project Advisory Committee whose membership included PHN executive andmanagement staff, representatives from the Far West Local Health District (FW LHD) and WesternNSW Local Health Districts (WNSW LHD), a General Practitioner, an allied health professional anduniversity lecturer and project consultants.(2) Health data analysisIdentification of key regional and sub-regional health and service unmet needs through the analysesof key population, health and service data, and determining variance from national, state and peerPHN averages.(3) Consultation and stakeholder engagementWorkshops and region-wide stakeholder surveys conducted to validate, add context and augmenthealth data analyses.Twelve consultation workshops were held in four representative communities, Broken Hill, Bourke,Dubbo and Orange. The workshops were supported by concurrent telephone and online surveys ofalmost 3,200 residents across the region; results of which are included in the final consultation reportsummary. Planning and delivery of the workshops involved a collaboration with key health partnersincluding the Far West Local Health District (FW LHD), Western NSW Local Health District (WNSWLHD), Three Rivers Regional Assembly, Murdi Paaki Regional Assembly, Bula Muuji AboriginalControlled Health Services and the NSW Rural Doctors Network (RDN). To engage with as manystakeholders from each community as possible, three workshops were held in each location:(1) Aboriginal yarning session(2) Whole of community workshop(3) General practice and service provider workshopTo ensure members of the Aboriginal community were provided a culturally safe place to discusshealth issues, yarning sessions were held first and were facilitated by a prominent Aboriginal leaderand Wiradjuri man who grew up in the region. Key messages from the yarning sessions were then fedinto the whole of community workshop by the facilitator. In all, over 200 people attended theconsultation workshops. Key stakeholder groups represented at the workshops included members oflocal and neighbouring communities and over 70 individual services and organisation representativesfrom general and specialist practices, allied health private practices, FWLHD and WNSW LHD services;Aboriginal community-controlled organisations including land councils and Aboriginal medicalWestern NSW Primary Health Network Health Needs Assessment 2019-20223
services; local community groups, local government and shire councils; department of Education andTechnical and Further Education (TAFE), universities with rural campuses and non-governmentorganisations.(4) Synthesis and prioritisation: data was analysed using appropriate statistical methods andpriorities were determined by applying a modified Hanlon method. The modified Hanlon methodinvolved the use of multiple criteria to rank issues identified in the consultations stakeholderworkshops and community phone and online surveys together with issues identified from thequantitative data analysis of key health and service data. Priorities were then validated by the PHNBoard, PHN Clinical, Community and Aboriginal Health Councils and PHN staff using an anonymoussurvey.The finalised list of ten key health and service priorities, ranked in order of importance include:1. Mental health and services2. Access to services3. Health workforce4. Health systems and coordination improvement5. First 2000 days of life6. Health of Aboriginal people7. Chronic disease management and prevention8. Digital health9. Alcohol and drug abuseWestern NSW Primary Health Network Health Needs Assessment 2019-20224
10. Aged care and older people(5) Development of a strategies, opportunities and options to address priority health and serviceneeds:This stage involved consultation with the PHN Board, PHN Clinical, Community and Aboriginal HealthCouncil, PHN staff, and key health partners. Options to address priorities were also drawn from thefindings of the consultation workshops and information submitted from stakeholders via an onlinesurvey.(6) Needs Assessment Review and approval by the Chief Executive Officer.Additional Data Needs and GapsWNSW PHN encountered challenges accessing sufficient data in the following areas:(1) Health and service utilisation data for Aboriginal people(2) Mapping of complex service provisions(3) General practice and allied health data to indicate prevalence of conditions (beyond Medicareservice data)(4) Commissioned service data in a format to support Needs Assessments and service planningWestern NSW Primary Health Network Health Needs Assessment 2019-20225
Recommendations for future Needs Assessments:In future needs assessments it is recommended additional data be collected and analysed to furtherdefine the needs of lesbian, gay, bisexual, transgender, intersex (LGBTI) people and understand thesize of this vulnerable group in our region. Due to difficulties obtaining data for this community it isrecommended separate consultation be conducted with peak bodies and service providers relevantto LGBTI people.Western NSW Primary Health Network Health Needs Assessment 2019-20226
Section 2 – Outcomes of the health needs analysis(i) General Population HealthOutcomes of the health needs analysis -general populationPopulation health determinantsPriorityIdentified NeedKey IssueDescription of EvidencePopulationprofileLowpopulationdensity withmajority ofpeople livingin regionalcentresWhole of PHN and sub-regional variation (LGA)In 2016, the estimated resident population (ERP) for WNSW PHN was 309,250, representing 4% of the NSWpopulation. The PHN’s population is geographically dispersed over an area of around 55% of the total areaof NSW; the largest area of any NSW PHN.Half of the population live in one of the four regional centres of Bathurst, Broken Hill, Western Plains(Dubbo) and Orange. Western Plains had the largest ERP in 2016 in Western NSW, and Broken Hill for theFar West of NSW.Source: Centre for Epidemiology and Evidence, NSW Ministry of HealthAvailable at: http://www.healthstats.nsw.gov.au Accessed: 6.11.2018GenderstructureMalesoutnumberfemalesWhole of PHNIn 2016, for every 100.0 females there were 101.1 males in WNSW PHN.Source: Health of the Population. Western NSW Health Needs Assessment. Health Intelligence Unit, Western NSW Local HealthDistrict, December 2017.Age StructureBimodal:majority ofthepopulationaged 0-14 or50-69 yearsWhole of PHNIn 2016, more of the population occupied two main age groups (bimodal), 0-14 and 50-69 years, comparedto NSW, where the largest proportion of the population occupied the 25-44 years age group.Source: Health of the Population. Western NSW Health Needs Assessment. Health Intelligence Unit, Western NSW Local HealthDistrict, December 2017.Western NSW Primary Health Network Health Needs Assessment 2019-20227
Outcomes of the health needs analysis -general populationPopulation health determinantsPriorityIdentified NeedKey IssueDescription of EvidencePopulationaverage ageOlderaverage agecompared toNSWWhole of PHNIn 2016, the average age of a WNSW PHN resident was approximately 40 years compared to 32 years forthat for NSW.Smallpopulationincreasecompared tothatexpected forNSW, withsub-regionalvariation.Whole of PHN and sub-regional variation (Local Government Area)From 2016 to 2036, the WNSW PHN population is projected to increase by 6% compared to more than 20%for NSW. At the Local Government Area (LGA) level, over the same 20-year period, a decline is predicted inthe Far West LGAs of Wentworth, Balranald and Broken hill, with Broken Hill expecting the largest decline of10%. By comparison, the populations of the Western regional and surrounding LGAs of Bathurst, Cabonneand Orange are expected to increase by at least 18%, with Bathurst showing the largest predicted increaseof 30%.70 years age groupexpected toincrease bymore than60% by 2036Whole of PHNBetween 2016 and 2036, the number of WNSW PHN residents aged 70 years and over are expected toincrease by more than 60%, while all other age groups are predicted to remain relatively stable over the 20year period.Lowest lifeexpectancyat birth of allNSW PHNs.Whole of PHN:In 2016, life expectancy at birth for WNSW PHN residents was 80.3 years, lower than the NSW average of83.1 years and lowest of all NSW onLife ExpectancySource: Health of the Population. Western NSW Health Needs Assessment. Health Intelligence Unit, Western NSW Local HealthDistrict, December 2017Source: Centre for Epidemiology and Evidence, NSW Ministry of HealthAvailable at: http://www.healthstats.nsw.gov.au Accessed: 6.11.2018Source: Health of the Population. Western NSW Health Needs Assessment. Health Intelligence Unit, Western NSW Local HealthDistrict, December 2017Source: Centre for Epidemiology and Evidence, NSW Ministry of HealthAvailable at: http://www.healthstats.nsw.gov.au Accessed: 13.10.2018Western NSW Primary Health Network Health Needs Assessment 2019-20228
Outcomes of the health needs analysis -general populationPopulation health determinantsPriorityIdentified NeedKey IssueDescription of EvidenceLife ExpectancyLifeexpectancieslower thanNSW averagein all LGAsSub-regional variation (LGA):In 2016, life expectancy at birth for residents in all 27 LGAs were lower than the NSW average of 83.1 years.The LGAs of Broken Hill, Mid-Western Regional and Walgett had the lowest life expectancy at birth (80.0,80.8 and 81.0 years, respectively). The LGAs of Balranald, Wentworth and Oberon had the highest lifeexpectancy at birth (82.3, 82.2 and 82.2 years, respectively).Source: Centre for Epidemiology and Evidence, NSW Ministry of HealthAvailable at: http://www.healthstats.nsw.gov.au Accessed: 13.10.2018Cultural wer ratesof peoplebornoverseaswho do notspeak Englishwell, or at allWhole of PHN and sub-regional variation (LGA)According to the ABS Census 2016, 0.3% of WNSW PHN residents were born overseas and did not speakEnglish well, or at all, compared to 2.9% for Australian residents and 3.8% for NSW residents for the same.At the sub-regional level, the LGAs with the highest proportion of residents born overseas who did notspeak English well, or at all, were Balranald (0.6%), Orange (0.6%) and Walgett (0.4%).High levels ofsocioeconomicdisadvantageWhole of PHN:The Social Economic Index for Areas (SEIFA) Index of Relative Socio-economic Disadvantage (IRSD) forWNSW PHN is 954, lower than the Australian score of 1000. The lower the score the higher the degree ofdisadvantage.Source: Population Health Information Development Unit (PHIDU), 2018 ‘Social Health Atlas of Australia, Data by Primary HealthNetwork’ Available at: ses/data (Accessed: 15.10.2018)Source: Population Health Information Development Unit (PHIDU), 2018 ‘Social Health Atlas of Australia, Data by Primary HealthNetwork’Available at: ses/data (Accessed: 15.10.2018)Western NSW Primary Health Network Health Needs Assessment 2019-20229
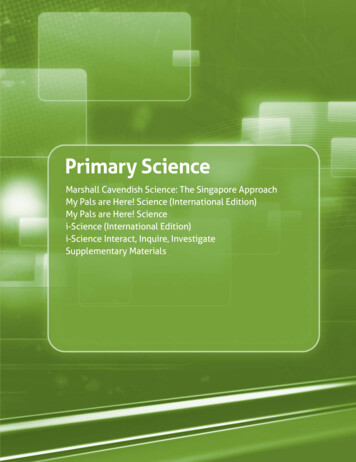
Outcomes of the health needs analysis -general populationPopulation Health DeterminantsPriorityIdentified NeedKey IssueDescription of EvidenceSocio-economicdisadvantageHigher levelsof socioeconomicdisadvantagein Far Westand NorthWest NSWSub-regional variation (LGA):In 2016, 85% of WNSW PHN LGAs were ranked in the five lowest IRSD deciles (i.e. 1-5), nationally; with morethan a third (37%) occupying the two lowest deciles (Figure 1).Figure 1: Index of RelativeSocioeconomicDisadvantage (IRSD) byLGA, 2016 where 1 mostdisadvantaged and8 least disadvantagedSource: Health of the Population. Western NSW Health Needs Assessment. Health Intelligence Unit, Western NSW Local HealthDistrict, December 2017.Western NSW Primary Health Network Health Needs Assessment 2019-202210
Outcomes of the health needs analysis -general populationPopulation Health DeterminantsPriority1Identified NeedKey IssueDescription of EvidenceHealth LiteracyLower levelsof healthliteracy invulnerablegroupsOnly about 40% of adults have the level of individual health literacy needed to be able to make informeddecisions and take action about their own health.1From stakeholder consultation, health literacy was raisedas an important factor impacting on self-care and health outcomes. There was concern that people do notrealise they are unhealthy and are often not presenting until very unwell. Improving health literacy acrossthe lifespan would empower individuals to improve, and engage with health professionals to better manage,their own health. Vulnerable groups identified through consultations with community included parents ofbabies and young children, Aboriginal people, Elders and older people, rural and remote communities, men,people living with chronic disease and/or disabilities and their Carers, people living with mental illness anddrug and alcohol addiction and their Carers.Source: Western NSW Needs Assessment Consultation Workshops 2018 Final ReportDisabilityLevels ofdisability onpar withstate andnationalaverages,with higherlevels in ruraland remoteregionsWhole of PHN and sub-regional variation (LGA)In 2016, 5% of WNSW PHN residents were living with a profound or severe disability and living in thecommunity, similar to that for NSW (5%) and Australia (5%). The majority of LGAs had levels equal to orlower than the average for NSW, while those LGAs in more remote and rural areas tended to have higherlevels with Weddin (8%), Broken Hill (7%) and Coonamble (7%) having the highest levels.Source: Population Health Information Development Unit (PHIDU), 2018 ‘Social Health Atlas of Australia, Data by Primary HealthNetwork’Available at: ses/data (Accessed: 15.10.2018)Source: Australian Commission on Safety and Quality in Health Care,2015. Health Literacy: A Summary for CliniciansAvailable at: https://www.safetyandquality.gov.au Accessed: 16.10.2018Western NSW Primary Health Network Health Needs Assessment 2019-202211
Outcomes of the health needs analysis -general populationPopulation Health DeterminantsPriorityIdentified NeedKey IssueAboriginalPopulationLGBTI (lesbian,gay, bisexual,transgender, orintersex)populationDescription of EvidenceRefer to Aboriginal Health Needs Assessment tablesIdentified asa vulnerablepopulationthat forwhich littledata ue to a lack of specific data, even at a national level, reporting on the health of LGBTI people in WNSWPHN is challenging. From the AIHW’s Australia’s health 2018 Report, it is estimated that this group maycomprise as high as 11% of the total population. This population is considered at high risk of mental health,drug and alcohol and sexual health issues.Source: Australian Institute of Health and Welfare 2018. Australia’s health 2018. Australia’s health series no. 16. AUS 221. Canberra:AIHW. Available at: https://www.aihw.gov.au Accessed: 3/11/2018Western NSW Primary Health Network Health Needs Assessment 2019-202212
Outcomes of the health needs analysis -general populationPopulation health statusPriorityIdentified NeedKey IssueDescription of EvidenceHealth andwellbeingperceptionsLower rate ofself-reportedgood healthcompared tonationalaverageWhole of PHN:In 2016-17, 81% of surveyed WNSW PHN residents reported their health as excellent, very good or goodcompared to a national average of 85%.Low rates ofself-reportedgood healthandwellbeing,with lowestratesreported insome ruralareasWhole of PHN and Sub-regional variation (LGA):In 2018, 73% of participants surveyed in the WNSW PHN Telephone Community Health Survey rated theirhealth and wellbeing as good or better, and that of their family as slightly higher than their own, 75%.Groups that rated their own health lower than the survey average were people aged 65 years and over (66%rated their health as good or better), and Aboriginal people (62% rated their health as good or better).There was considerable sub-regional variation with the lowest levels of good or better health and wellbeingreported by participants living in the LGAs of Blayney (53%), Brewarrina (54%), Narromine (68%), Broken Hill(69%), Cowra (69%) and Parkes (69%). While the highest levels were reported by participants living inCentral Darling (89%), Gilgandra (84%), Balranald (81%) and Warren (80%).Source: Australian Institute of Health and Welfare analysis of Australian Bureau of Statistics, Patient Experience Survey, 2016-17.Available at: alth-network/phn107# Accessed: 13.10.2018Source: Telephone Community Health Survey for Western NSW PHN Report, 28 August 2018.Western NSW Primary Health Network Health Needs Assessment 2019-202213
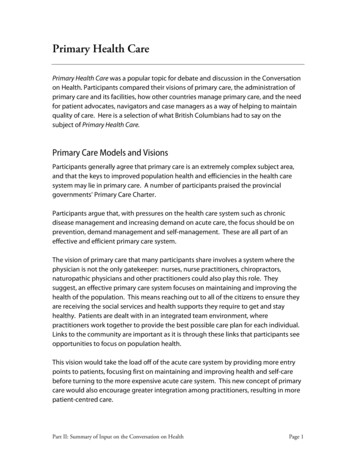
Outcomes of the health needs analysis -general populationPopulation health statusPriorityIdentified NeedKey IssueDescription of EvidencePotentiallyavoidabledeaths (PAD)Higher ratesof potentiallyavoidabledeaths,highest inNorth-WestNSWWhole of PHN:The annual average rate of potentially avoidable deaths for WNSW PHN residents for the five years fromJuly 2011 to June 2016 was 43% higher than that for NSW, 151.9 compared to 106.4 per 100,000population, respectively.Source: Centre for Epidemiology and Evidence, NSW Ministry of HealthAvailable at: http://www.healthstats.nsw.gov.au Accessed: 16.10.2018)Sub-regional variation (LGA):Between July 2010 and June 2015, the average annual rates of potentially avoidable deaths were higher forall WNSW PHN LGAs than NSW, with the exception of Oberon (Figure 2). Rates were highest in Walgett,Broken Hill and Brewarinna.Only Oberon and Bathurst hadsimilar rates to the of NSW.Figure 2: Potentially avoidabledeaths (annual averagestandardised rate) for personsless than 75 years of age by LGA,2010-11 to 2014-15.(*The ratio of LGA rate to NSW rate(RR rate ratio)Source: Health of the Population.Western NSW Health NeedsAssessment. Health Intelligence Unit,Western NSW Local Health District,December 2017.Western NSW Primary Health Network Health Needs Assessment 2019-202214
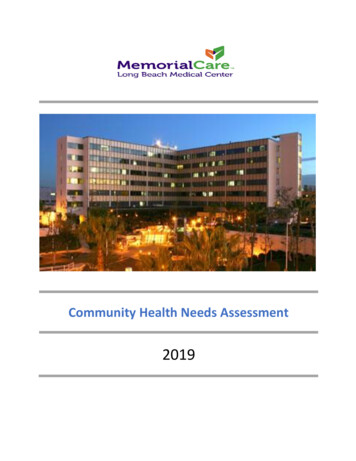
Outcomes of the health needs analysis -general populationPopulation Health StatusPriorityIdentified NeedKey IssueDescription of )High ratecompared toNSW withsteady trendover 5 yearsWhole of PHN:Between July 2012 and June 2017, the annual average rate of PPH in WNSW PHN was 16% higher than thatfor NSW, 2460.6 compared to 2118.2 per 100,000 population, respectively. However, for the five-yearreporting period, rates have increased by only 0.5% in the PHN compared to an 11% increase of the same inNSW.Source: Centre for Epidemiology and Evidence, NSW Ministry of HealthAvailable at: http://www.healthstats.nsw.gov.au Accessed: 16.10.2018Higher ratesin NorthWest NSWSub-regional variation (LGA):Between July 2015 and June 2017, the rates of PPH in just under half of WNSW PHN LGAs had PPHs ratessignificantly higher than the NSW rate. Highest rates occurred in Walgett, Bourke, Brewarrina andCoonamble (Figure 3). Lower rates occurred in Blayney, Mid-Western Regional, Cabonne and Parkes.Figure 3: PPH by LGA, NSW2015-16 to 2016-17Source: Centre for Epidemiologyand Evidence, NSW Ministry ofHealth Available at:http://www.healthstats.nsw.gov.auWestern NSW Primary Health Network Health Needs Assessment 2019-202215
Outcomes of the health needs analysis -general populationPriorityIdentified NeedPopulation health statusRisk FactorsKey IssueHigherprevalenceof chronicdisease riskfactorsDescription of EvidenceWhole of PHN:Alcohol consumption:In 2017, 37% of WNSW PHN adults surveyed in the NSW Adult Population Health Survey reported levels ofalcohol consumption posing a long-term risk to health. This rate was 20% more than the NSW average forthe same (31%).Inadequate fruit and vegetable consumption:In 2017, less than half (45%) of WNSW PHN adults self-reported adequate fruit consumption. This rate was4% lower than the State average (46%). While only 7% of surveyed adults reported adequate vegetableconsumption, this was 11% more than the NSW average for the same (7%).Overweight and obesityIn 2017, 33% of WNSW PHN adults surveyed in the Adult Population Health Survey self-reported beingoverweight, equal to that for NSW (33%). However, 25% self-reported being obese which was 17% morethan that for NSW (21%).In 2018, obesity was rated as a serious health concern by 28% of participants of the WNSW PHN TelephoneCommunity Health Survey.Physical InactivityIn 2017, 53% of WNSW PHN adults surveyed in the Adult Population Health Survey self-reported insufficientphysical activity. This rate was the highest of any NSW PHNs and 27% higher than that for NSW (42%).Smoking:In 2017, 23% of WNSW PHN adults surveyed reported they were current smokers. This rate was the highestof any NSW PHNs and was 49% more than the average for NSW (15%).Sources: Centre for Epidemiology and Evidence, NSW Ministry of HealthAvailable at: http://www.healthstats.nsw.gov.au Accessed: 16.10.2018Telephone Community Health Survey for Western NSW PHN Report, 28 August 2018.Western NSW Primary Health Network Health Needs Assessment 2019-202216
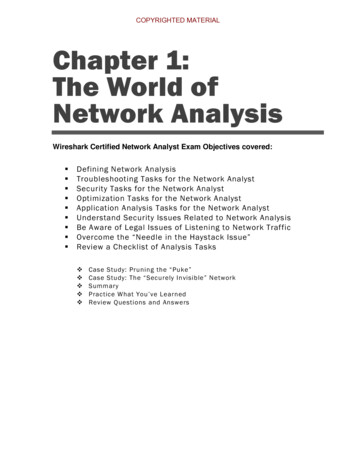
Outcomes of the health needs analysis -general populationPopulation health statusPriorityIdentified NeedKey IssueDescription of EvidenceRisk factorsHigherprevalenceof riskfactorsincreasingwith ruralityandremotenessSub-regional variation (LGA):For the period 2014-15, rates ofbiomedical risk factors, whenranked by socioeconomicdisadvantage, tended to behigher in those LGAs locatedNorth West and Far West NSW(Table 1).NB: lack of data for remotecommunities due to smallnumbersTable 1: Self-reported serviceaccessibility, 2014-16Source: Population Health InformationDevelopment Unit (PHIDU), 2018 ‘SocialHealth Atlas of Australia, Data byPrimary Health Network’Available ntindicatingincreased risk ofchronic disease(ASR/100)2014-15High blood High or veryObesepressurehigh(ASR/100)(ASR/100) psychologicaldistress(ASR/100)Brewarrina1V. remoteN/AN/AN/AN/ACentral Darling1V. onamble1Remote73.921.412.742.2Broken Hill2M. accessible68.323.713.637.2Gilgandra2M. accessible70.617.110.040.9Warrumbungle Shire2M. accessible70.218.210.140.3Bourke2V. remoteN/AN/AN/AN/ACowra2M. .542.5Narromine3M. accessible70.617.110.040.9Parkes3M. 11.039.2Unincorp. FW gan4Remote73.921.512.842.2Forbes4M. accessible72.119.210.542.5Weddin4M. 1.039.2Mid-Western Regional5M. accessible67.623.510.836.6Dubbo (Western Plains) Regional5M. accessible69.320.312.640.4Cobar5V. remote73.921.512.842.2Oberon5M. t Regional6Accessible68.623.912.336.7Cabonne8M. accessible70.116.210.538.6Western NSW69.321.111.938.9New South Wales61.922.311.028.1N/A not a va i l a bl e due to s ma l l numbers ; ARIA Acces s i bi l i ty Remotenes s Index of Aus tra l i a ; LGA l oca l governmenta rea ; IRSD SEIFA Index of Rel a tive Soci oeconomi c Di s a dva ntage; ASR a ge s tanda rdi s ed ra te; V very; M modera tel y.Western NSW Primary Health Network Health Needs Assessment 2019-202217
Outcomes of the health needs analysis -general populationFirst 2000 days of lifePriorityIdentified NeedKey IssueDescription of the evidenceChildren agedyounger than 5yearsHigherproportionof the totalpopulationcompared toNSWWhole of PHN and sub-regional variationIn 2016, the total WNSW PHN ERP aged 0-4 years made up 7.0% of the total WNSW PHN ERP, 8% higherthan that for NSW (6.5%). The majority (70%) of WNSW PHN LGAs had a greater proportion of theirpopulation aged under 5 years of age compared to the same for NSW.Source: Centre for Epidemiology and Evidence, NSW Ministry of HealthAvailable at: http://www.healthstats.nsw.gov.au Accessed: 17.10.2018Fertility ratesHighestfertility rateof all NSWPHNsWhole of PHNIn 2016, the total fertility rate of 2.22 in WNSW PHN was the highest of any NSW PHN and 25% higher thanthat for NSW (1.78).Source: Centre for Epidemiology and Evidence, NSW Ministry of HealthAvailable at: http://www.healthstats.nsw.gov.au Accessed: 17.10.2018BirthsA decline inthe totalnumber ofbirths peryear; lowestrate in FarWestWhole of PHN and sub-regional variation (LHD)In 2001, there were 4,136 births to WNSW PHN resident mothers, representing 5% of the total state birthsfor that year. In 2017, there were 3,839 births to PHN resident mothers, representing 4% of total state birthsfor that year; a 7% decline since 2001. In Far West Local Health District (FW LHD) the total number of birthsfell by 34% between 2001 (312) and 2017 (207). This decline is much larger than that for Western NSW LHDwhere the total number of births fell by only 5% between 2001 (3,824) and 2017 (3,632).Source: Centre for Epidemiology and Evidence, NSW Ministry of HealthAvailable at: http://www.healthstats.nsw.gov.au Accessed: 17.10.2018Teen pregnancyHighest rateof pregnancyin youngmothers ofall NSWPHNsWhole of PHN and sub-regional variation (LHD)In 2017, 5% of WNSW PHN mothers giving birth were aged under 20 years. This was the highest proportionof all NSW PHNs and 2.5 times that for NSW (2%). In 2017, 6% of FWLHD resident mothers giving birth wereaged under 20 years more than that for WNSW LHD (5%).Source: Centre for Epidemiology and Evidence, NSW Ministry of HealthAvailable at: http://www.healthstats.nsw.gov.au Accessed: 17.10.2018Western NSW Primary Health Network Health Needs Assessment 2019-202218
Outcomes of the health needs analysis -general populationFirst 2000 days of lifePriorityIdentified NeedMortalityKey IssueHigher rateof mortalitycompared toNSW averageDescription of EvidenceWhole of PHNBetween 2009 and 2013 the annual average mortality rate for the 0-4-year old age group, was more than30% higher than that for NSW, 119.4 compared to 89.5 per 100,000 population. Over the five-year period,child mortality rates in NSW declined, while that for WNSW PHN increased. The leading causes of deathwere those originating in the perinatal period, followed by congenital and chromosomal abnormalities,injury and poisoning, respiratory diseases and cardiovascular diseases.Source: Health of the Population. Western NSW Health Needs Assessment. Health Intelligence Unit, Western NSW Local HealthDistrict, December 2017.Smoking inpregnancyHighest rateof smoking inpregnancy ofany NSWPHN, butevidence of adownwardtrendWhole of PHNIn 2016, 20% of mothers giving birth smoked in pregnancy, the highest of any NSW PHN. Between 2012 and2016, the annual average rate of WNSW PHN mothers who smoked at all during pregnancy was 23%, 2.4times that for NSW (9%). Importantly however, rates have fallen by 21% from 2012 to 2016, a similar trendto that in NSW (20%).Source: Centre for Epidemiology and Evidence, NSW Ministry of HealthAvailable at: http://www.healthstats.nsw.gov.au Accessed: 17.10.2018Western NSW Primary Health Network Health Needs Assessment 2019-202219
Outcomes of the health needs analysis -general populationFirst 2000 days of lifePriorityIdentified NeedSmoking inpregnancyKey IssueRatesincreasingwith ruralityandremotenessDescription of EvidenceSub-regional variation (LGA)Between 2011 and 2014, the proportion of mothers who smoked during pregnancy was higher in all WNSWPHN L
Western NSW Primary Health Network Health Needs Assessment 2019-2022 1 Primary Health Network Program . First 2000 days of life 6. Health of Aboriginal people 7. Chronic disease management and prevention 8. Digital health . and Orange are expected to increase by at least 18%, with Bathurst showing the largest predicted increase .