Transcription
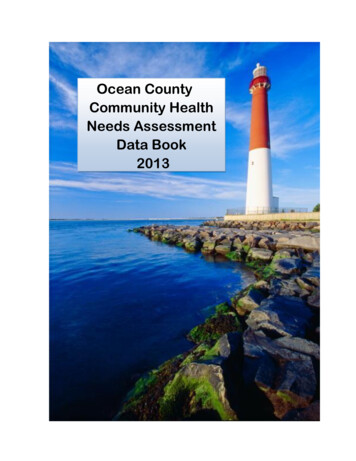
Ocean CountyCommunity HealthNeeds AssessmentData Book2013
Ocean County Community Health Needs Assessment2013Table of ContentsExecutive Summary 7Introduction . 19Ocean County Health Advisory Group . . 19Healthy NJ 2020 Overarching Goals 22Ocean County Dashboard of Measures for Data Collection 23MAPP Process Assessment Overview . 24Ocean County Highlights from 2007 Community Health Needs Assessment. 26Section 1: Ocean County Quick Fact Sheet .28Section 2: Demographic Profile 29Section 3: Healthy NJ 2020 Leading Health Indicatorsa)b)c)d)e)f)g)h)Maternal, Infant and Child Health . 35-47Access to Care . 48-60Vaccination Rates . 61-63Clinical Preventative Services 64-67Injury . 68-70Environmental Health . 71-73Substance Abuse 74-76Mental Health . 77-78Section 4: Mortality Rates 79Section 5: Morbidity Rates-Communicable Diseases 82Section 6: Healthy Behaviors 91Section 7: Overall Health System Assessment 96Reference Sources .1022
List of TablesSection 1: Quick Fact Sheet .28Section 2: Demographic Profile* Population Distribution in Ocean County 2010 . .* Age and Sex Distribution 2010 .* County Population by Race/Ethnicity. . . .* Socio-Economic Profile. . . .* Ocean County Population Growth .* Ocean County Municipalities Map . .293031323334Section 3: Healthy NJ 2020 Leading Health Indicators by Age GroupMaternal, Infant and Child Health* Birth rate in Ocean County . .* Ocean County Municipalities with highest birth rate. .* Birth rate by Race/Ethnicity . .* Percentage of women receiving early prenatal care . .* Low Birth-Weight Infants . .* Very Low Birth- Weight Infants .* Women enrolled in the WIC Program-First Trimester . .* Breastfeeding Rates in the Ocean County WIC Program .* WIC Program Participation in Ocean County . .* Teen Pregnancy 2000-2008 .* Teen Pregnancy by Township 2010 .* Lead Testing 2000-2011 .* Autism Rates by Ethnicity 2010 . . .* Early Intervention Diagnosis 2007-2011 . .3536373839404142434445464747Access to Health Services* Primary Care Provider Rate .* Overall Hospital Admissions per Age Group .* Overall ED Treat & Release per Age Group. .484950Infants and Children from 0-17 years of age* Leading Hospital Admission Diagnosis for 2008-2010. . .* Leading ED Diagnosis (Treat & Release) 2008-2010 .* Top 10 Health Center Visits by Municipality 2009-2011 .* Top Diagnosis for Health Center Visits 2009-2011 .*Oral Health Utilization in Health Centers 2009-2001.* Insurance Utilization in Hospitals and Health Centers .3515253545556
Adolescents and Adults 18-64 years of age* Leading Reasons for Hospital Admissions including ED Admits 2008-2010. * Leading ED Diagnosis (Treat & Release) 2008-2010 .* Top Diagnosis for Health Center Visits 2009-2011 .* Insurance Utilization in Hospitals and Health Centers 2008-2010. 57575858Adults’ 65 years and older* Leading for Hospital Admissions including ED Admits 2008-2010 . * Leading Emergency Department Diagnosis (Treat & Release) 2008-2010 .* Top Reasons for Health Center Visits 2009-2011 . .* Insurance Utilization in Hospitals and Health Centers 2008-2010. 58585959Vaccination Rates* Preventative Vaccine for Children 2000-2011Rates .* Seasonal Immunization Totals in Ocean County 2000-2011. .* Pneumonia Vaccination Totals 2000-2011 .616363Clinical Preventative Services* Diabetes Screening. .* Colorectal Cancer Screening . .* Mammography Screening * Pap Smear Screening .* Prostate Antigen Screening .6465666767Injury* Injury and Poison Admissions for 00-17 year olds 2008-2010 .* Injury and Poison Admissions for 18-64 year olds 2008-2010 .* Injury and Poison Admissions for 65 plus and older 2008-2010 * Unintentional injury rates 2000-2008 .68686969Environmental Health* Air Pollution Trend by Year 2002- 2011 * PNC/Lead Investigations 2002-2011 * Food Establishments Inspections 2002-2011 .717273Substance Abuse* Drug Abuse Violations in Ocean County * Treatment Admissions * Drug of Choice .4747575
* Age and Ethnicity of clients in treatment programs .76Mental Health* Mental Health Board 2012 Needs Assessment .77Section 4: Mortality RatesMortality Rates* Top Infant Mortality Rates 2007 .79* Top 10 Mortality Diseases in Ocean County 2000-2007 79* Diseases of the Heart .80* Diabetes, Prostate and Breast Cancer 80-81Selection 5: Morbidity Rates-Communicable DiseasesMorbidity Rates- Communicable Diseases* Communicable Disease by Year 2002-2010. * Salmonellosis 2000-2010 . * Lyme Disease 2000-2010 .* Campylobacteriosis .* Shigellosis .* Chlamydia * Gonorrhea .* Syphilis (Primary and Secondary) .* HIV Case-Fatality rate .828384858687888990Section 6: Healthy BehaviorsHealthy Behaviors* Community Health Survey Summaries . .91Section 7: Overall Health System AssessmentLocal Public Health System Assessment* CDC Health System Assessment Report .596
AcknowledgmentsThis report was prepared by Brunilda Price, Ocean County Health Department, under theguidance and direction of the Ocean County Advisory Group for the 2013 Ocean CountyCommunity Health Needs Assessment.Special thanks to all Ocean County Health Advisory Group members for their input anddedication to the preparation of the countywide community health needs assessment.Ocean County Health Advisory Group Members:Laura Ahern, Director, Community Outreach, Meridian HealthTheresa Berger, MD, Executive Director, Ocean Health InitiativesElla Boyd, VMD, Assistant Public Health Coordinator, Ocean County Health Dept.Dovid Friedman, MD Chief Executive Officer, Center for Health Education, Medicine, andDentistryMary Gibson, Program Coordinator, Drug & Alcohol Abuse, Ocean County Health Dept.Charlene Harding, System Development & Planning, Barnabas HealthTimothy Hilferty, Health Officer, Director, Long Beach Island Health DepartmentBridget Hogan, Chief Operations Officer, Ocean Health InitiativesDiane Klimik, Director of Nursing, Ocean Health InitiativesDaniel J. Krupinski, Sr. Registered Environmental Health Specialist,Long Beach Island Health DepartmentDana O’Connor, Public Health Nurse Supervisor, Long Beach Island Health Dept.Richard J. Pallamary, Vice President for Development, Barnabas HealthBrunilda Price, Coordinator Community Health Services, Ocean County Health Dept.Daniel E. Regenye, Health Officer, Public Health Coordinator, Ocean County HealthDepartmentCarol Schoenberger, Clinical Program Manager, Meridian HealthYaakov Schwartz, Project Manager, Center for Health Education, Medicine, and DentistryLeslie Terjesen, Public Information Officer, Ocean County Health DepartmentNancy Tham, MD, FACOG, Chief Medical Officer, Ocean Health InitiativesChedva Werblowsky, Director of Operations, Center for Health Education, Medicine andDentistrySincere appreciation to all who contributed in the data collection process or analysis:Ocean County Health Department Staff: John Clayton, Jennifer Crawford, Peter Curatolo, Mary Gibson,Patricia High, Meg McCarthy-Klein, Mary Jane Navin, John Protonentis, Kimberly Reilly, and Leslie TerjesenCharlene Harding, System Development & Planning, Barnabas HealthRobert LaForge, Database Manager and Diane Klimik, Director of Nursing: Ocean Health InitiativesDana O’Connor, Public Health Nurse Supervisor, Long Beach Island Health DepartmentYaakov Schwartz, Project Manager, Center for Health Education, Medicine and Dentistry6
Executive Summary perAge Groups:00-17 Years18-64 Years65 Plus7
The Ocean County Community Health Needs Assessment of 2013 is a combination ofprimary and secondary data. The data presented is broken down in three major age groupsfor easier discussion and understanding, and compared against the Healthy NJ 2020targets. Our intent is to identify the primary health issues affecting Ocean County residentsper age group.Age Group: 00-17 YearsDemographics: Ocean County’s population of 00-17 years of age is 23.4% or 134,919 ofits total population of 576,567 (2010 Census), a 6% increase from 2006. The largest agegroup is the 6-12 year olds at 8.9%, followed by the 1-5 year olds at 6.7%, and 13 to 17years of age at 6.4%.The birth rate in Ocean County has averaged higher at 14% compared to NJ at 13% in2008. The number of births in county hospitals in 2010 was 7,481. The municipalities withthe highest number of births in county hospitals in 2010 were Lakewood at 48%, Toms Riverat 12.6%, Brick at 8%, and Jackson and Lacey at 5.9%.Healthy NJ 2020Maternal & Child HealthLeading HealthIndicatorsReducing the rate ofinfants deathsReduce low birth weightinfantsReduce very low birthweight infantsIncrease the proportionof pregnant women whoreceive prenatal care inthe first trimesterIncrease the proportionof infants who are everbreastfedReduce the birth rateamong females aged 1517 years oldsTargetOcean County New 10)4.5%(2008-2010)4.8%7.7%8Target Met byOcean County
Reduce the proportion oflead levels in childrenaged 1-5 years who havean initial blood lead level 10ug/dL0.9%1.2%(2000-2011)0.5%(2010)Socio-economic conditions for 00-17 year olds in Ocean County:21% of children living below the poverty level in 2010, up from 14% in 2006;55,448 children as of October 2012 were enrolled in NJ Family Care, a 52% increasefrom 2007;26,320 children are receiving NJ SNAP (Food Stamps) benefits up 154% from 2007;11,215 children and 4,002 infants were enrolled in the Ocean County WIC Programas of August 2012, an increase of 9% for children and 10% for infants from August2011;Medicaid HMO was the primary insurance used the most for hospital admissions, EDvisits, and the Federally Qualified Health Center visits.Healthcare HighlightsLeading causes for Hospital Admissions for 00-17 year olds in 2008-2010:Demographics: Lakewood, Toms River and Brick were the municipalities with the mosthospital admissions from 2008-2010. The most prevalent races inhospital admissions were: Whites, Blacks and Hispanics.Neonates with major complications (prematurity, respiratory distress)Pulmonology (asthma, bronchitis, COPD, respiratory infections, pneumonia)Psychiatry (psychoses or behavioral disorders, depression, neuroses)Gastroenterology (billiary tract or esophageal disorder, major gastrointestinaldisorder)Leading Emergency Department Diagnoses (Treat & Release) for 00-17 year olds in2008-2010:Demographics: Toms River, Lakewood and Brick were the municipalities with the most EDvisits. The most prevalent race in ED visits were: Whites, Blacks and Hispanics.Body Injuries (major chest or skin trauma ,other multiple injuries)Otology (Otitis media and Eustachian tube disorder)9
Medical Trauma Orthopedics (Femur Fx with and without major complications)Gastroenterology (billiary tract or esophageal disorder, major gastrointestinaldisorder)Pulmonology (asthma, bronchitis, pneumonia)Leading Hospital Injury and Poison Treatment Admissions for 00-17 year olds in2008-2010:Demographics: Toms River, Brick and Lakewood were the municipalities with the mostinjury and poison admissions. The races with the most injury and poison admissions were:Whites, Blacks and Hispanics.Head injuries-trauma (concussions with and without complications/comorbidity)Surgical trauma orthopedics (limb reattachment, local excision)Substance abuse (alcohol/drug abuse, poisoning/drugs toxic)Medical trauma orthopedics (Femur Fx with and without major complications)Body injuries (major chest or skin trauma, other multiple injuries)Leading Federally Qualified Health Centers (FQHC’s) Diagnoses for 00-17 year olds in2009-2011:Demographics: Lakewood, Toms River and Bayville were the municipalities with the mostclients seen at the FQHC’s. The races most seen at the FQHC’s were: Whites, Blacks andHispanics.Routine Child Health Exam: Immunizations and well child visitsAcute Respiratory Infections: Asthma, bronchitis, upper respiratory infectionsDisease of the Nervous System: Bacterial Meningitis, disorders of the eye, hearingproblemsInfectious & Parasitic Diseases: Salmonellosis, Shigellosis, Pertussis, Mumps,Tuberculosis, etc.Symptoms, Signs, & Ill Defined Conditions: Nervous & Musculoskeletal systems,skin, nutrition, etc. followed by Diseases of the Digestive System and MentalHealth.10
Prevalence of Chronic and Infectious Diseases in 00-17 year olds:2011-2012: Pertussis Outbreak (whooping cough): 136 cases were confirmed in 2012 inthe northern part of the county (Lakewood) with other cases are also being seen inneighboring communities and around the county as a whole. Forty-three cases or 32% of allcases were in the county were children under 5 years of age. Pertussis is a very contagiousvaccine-preventable disease that can cause serious illness and even death―especially ininfants who are too young to be fully vaccinated ( 6 months). Many of the infants andchildren who have confirmed cases of whooping cough have not been fully immunizedagainst the disease. It is important that the adolescents and adults that are with infants andchildren are vaccinated against whooping cough. The Tdap vaccine is a combination ofthree vaccines that protect against tetanus, diphtheria, and Pertussis,In 2011, 312 confirmed or probable cases were identified in NJ, compared with 169 cases in2010: 8% of cases occurred in those 1 year of age, 5% in 1-4 years, 14% in 5-9 years,34% in 10-19 years, 4% in 20-29 years, and 35% in 30 years of age. Of all cases 1 yearof age, 76% have been hospitalized.In 2012, 385 cases have been identified in 2012 in NJ: 9% of cases occurred in those 1year of age, 5% in 1-4 years, 17% in 5-9 years, 51% in 10-19 years, 3% in 20-29 years, and16% in 30 years of age. Of all cases 1 year of age, 66% have been hospitalized. Thetotal number of cases for 2012 is provisional and expected to increase as reports currentlyunder investigation are finalized2011-2012: Shigellosis: 492 confirmed cases in children, 53% occurred in 1-4 years of age,23% in 5-9 years and 7% in 10-14 years.Shigellosis is an intestinal illness caused by infection with Shigella bacteria. Shigellosis ismost common in young children two to four years of age. Children who attend child carecenters are at greater risk for acquiring this infection from other childrenJune 2009 through June 2010: Mumps Outbreak: 425 cases reported in Ocean County.Adolescents 13 to 17 years of age (27% of all patients) and males (78% of patients in thatage group) were disproportionately affected. Among case patients 13 to 17 years of agewith documented vaccination status, 89% had previously received two doses of a mumpscontaining vaccine, and 8% had received one dose. The epidemiologic features of thisoutbreak suggest that intense exposures, particularly among boys in schools, facilitatedtransmission and overcame vaccine-induced protection in these patients. High rates of twodose coverage reduced the severity of the disease and the transmission to persons insettings of less intense exposure.11
Substance Abuse: 6.8% of admissions for drug & alcohol treatment programs were fromclients under the age of 18 years of age (2006-2010); synthetic marijuana and bath salts hasincreased in 2011 for 13-19 year olds; 8.8% of Intoxicated Driving Clients were less than 21years of age in 2010.Obesity: 15.8% of children under the age of 5 years in 2010 were considered obesecompared to NJ at 15.7%.Asthma: 7.4% of children under 18 years of age were diagnosed with asthma from 20082010. Asthma is one of the top five ED visits and hospital admission diagnosis for childrenunder 18 years of age.Age Group: 18-64 YearsDemographics: Ocean County’s population of 18-64 year olds is 55.6% or 320,544 in 2010of the total county population of 576,567. The highest age group is the 45 to 65 year olds at25.9%, followed by the 25 to 44 years of age at 22.2%, and lastly the18 to 24 year olds at7.5%. The most prevalent chronic and infectious diseases in the county are within this agegroup.Healthy NJ2020Leading HealthIndicatorsAsthma:Reduce thehospitalization ratePer 10,000residentsdue to asthma:18-64 yearsCancer:Reduce the deathrate due to allcancers:Lung CancerFemale BreastCancerProstate CancerTarget112Ocean County16.49 rate per10,000residents(2009)New Jersey18.6 rate per10,000residents(2009)161.542.023.5201.4 (2007)58.7 (2007)26.6 (2007)180.7 (2007)59.1 (2007)26.2 (2007)21.222.3 (2007)23.7 (2007)12Target metby OceanCounty
Diabetes:*Reduce the deathrate due todiabetes per 1,000population*Increase theproportion of adultswith a glycosylatedhemoglobinmeasurement(A1C) per 1,00015.820.8 (2007)24.4 (2007)93.6%88.5 % (2010)86.7% (2010)Socio-economic conditions for 18-64 year olds in Ocean County:14.4% of adults (18-64 years) were without health insurance in 2009;10.1% are living below 200% of the Federal Poverty level (2009);Medicaid HMO and Self- Pay was the prevalent insurance used most for hospitaladmissions while Self-pay and Private Insurance was the most prevalent insuranceused for ED visits. Medicaid, self-pay and private insurance were used the most atthe Ocean County Federally Qualified Health Centers.Healthcare HighlightsDemographics: The municipalities with the most hospital admissions and ED visits wereLakewood, Toms River and Brick with Whites, Blacks and other races the most prevalentgroups receiving treatment in our hospitals.Leading Hospital Admissions Diagnoses for 18-64 year olds in 2008-2010:Delivery, Psychiatry and Gastroenterology diagnosis were most prevalent for 1844 year oldsMedical Cardiology, Gastroenterology and Pulmonology were the most prevalentdiagnosis for 45-64 year olds.Leading Emergency Department Diagnoses (Treat & Release) for 18-64 year olds in2008-2010:Body Injuries (multiple sight trauma, trauma injuries, major chest trauma)Gastroenterology (liver disorder, pancreas, cirrhosis, alcoholic Hepatitis,)Medical Spine (medical back problems)Medical Trauma Orthopedics (femur, hip, pelvis or thigh trauma)Pulmonology (asthma, bronchitis, interstitial lung disorder, pneumonia, COPD)13
Leading Injury and Poison Hospital Admissions diagnoses for 18-64 year olds in2008-2010:Substance Abuse, Head Injuries and Surgical Traumas were the leading injury orpoison admissions diagnosis for 18-44 year olds.Surgical trauma orthopedics followed by substance abuse were the leadinginjury and poison admissions diagnosis for the 45-64 year olds.Leading Federally Qualified Health Centers Diagnoses for 18-64 year olds in2009-2011:Demographics: The municipalities with the most visits in this age group are fromLakewood, Toms River and Jackson. The races most prevalent in this age category wereWhites, Blacks and other or refusing to report race. Medicaid and self pay or underinsuredwere the most prevalent forms of insurance.Supervision of pregnancySymptoms, signs and ill defined conditions (nervous & musculoskeletal systems,skin, nutrition metabolism & development, head& neck, cardiovascular system,respiratory system, chest, digestive system, urinary system, and the abdomen &pelvis)Acute Respiratory Infections (asthma, bronchitis, pneumonia)Endocrine, Nutritional and Metabolic Diseases, & Immunity Disorders (disordersof the thyroid gland, endocrine glands, nutritional deficiencies, and metabolic &immunity disorders).Diseases of the reproductive organs and urinary systemPreventative Screenings:Mammography Screenings:Age: 40 year olds68.4% of women had a mammography in 201040-49 year olds - 62.1% of women had a mammography in 201050- 64 year olds- 82.7% of women had a mammography in 2010PSA Screenings:Age: 40 year olds61.3% had a PSA testing in 201040-49 year olds- 29.6% had a PSA testing in 201050-64 year olds -62.2% had a PSA testing in 201014
Age Group: 65 plus yearsDemographics: Ocean County’s population of 65 years and older is 121,104 or 21% of itstotal county population of 576,567 in 2010. The highest age groups are the 65 to 74 yearolds at 10.1%, followed by the 75 to 84 year olds at 7.5%, and the 85 year olds and over at3.4% of the total county population.Socio-economic conditions for 65 plus in Ocean County: The primary method ofinsurance payment for this age group is Medicare or Medicare HMO with 5.7% of the 65year olds living below the 200% poverty level in 2010.Healthy NJ 2020Leading HealthTargetIndicators for OlderAdultsReduce the rate offall-related injuries65 year olds and24.8older(per 100,000 pop.)Reduce theproportion of the23.9%population that isoverweight or obeseOceanCountyNew Jersey2512.8 (2000-2005)41%28.7%Target Met byOcean CountyHealthcare HighlightsDemographics: The municipalities with the most hospital admissions and ED visits for the65 plus age group were: Toms River, Manchester, Brick and Lakewood. Whites, Blacks andother races were the most prevalent races for hospital admissions in this age category from2008-2010.Leading Hospital Admissions Diagnosis for the 65 plus age group from 2008-2010:Medical cardiology (chest pains, heart failure, atherosclerosis, endorcarditis)Pulmonology (bronchitis, asthma, pneumonia, pulmonary embolism, COPD)Gastroenterology (billiary tract disorder, cirrhosis, alcoholic hepatitis, pepticulcers)Nephrology (kidney/urinary tract infections, renal dialysis, renal failure)15
Demographics: Toms River, Manchester and Brick are the leading municipalities forED visits with Whites, Blacks and other race being the leading races for ED visits.Leading Emergency Department Diagnoses (Treat & Release) for 65 plus year olds in2008-2010:Body injuries (multiple sight trauma, trauma injuries, major chest trauma)Medical cardiology (heart failures, cardiac arrhythmia, hypertension, endocarditis)Gastroenterology(billiary tract disorder, cirrhosis, alcoholic hepatitis, peptic ulcers)Other General Medical Care (aftercare, allergic reactions, complications of treatment,non- malignant breast disorder, injury or poisoning)Pulmonology (asthma, bronchitis, interstitial lung disorder, pneumonia, COPD)Leading Hospital Injury and Poison Admissions Diagnoses for 65 plus in2008-2010:Demographics: Toms River, Manchester and Lakewood are the leading municipalities forhospital injury and poison admissions in this age group with Whites, Blacks and other racesbeing the leading races for admission.Surgical trauma orthopedics (hip, femur, or foot procedures)Joint replacement (hip/knee replacement, bilateral/multiple joint procedures)Medical trauma orthopedics(Femur, Hip, Pelvis or Thigh trauma)Medical cardiology(heart failures, cardiac arrhythmia, hypertension,endocarditis)Head injuries-trauma (concussions trauma, coma)Leading Federally Qualified Health Centers Diagnoses for 65 plus year olds in2009-2011:Demographics: Lakewood, Toms River and Jackson were the leading municipalitiesaccessing the FQHC’s with Whites, Blacks and other races the most prevalent. Medicare isthe leading health insurance utilized at the Health Centers.Diseases of the Circulatory System (hypertension, heart disease)Endocrine, Nutritional & Metabolic Diseases, & Immunity Disorders (thyroid,Symptoms, Signs and Ill Defined Conditions(nervous & musculoskeletal systems,skin, nutrition metabolism & development, head& neck, cardiovascular system,respiratory system, chest, digestive system, urinary system, the abdomen and pelvis)16
Diseases of the Musculoskeletal System & Connective Tissue (arthritis,rheumatism)Supplementary Classification of Factors Influencing Health Status & Contactwith Health Services (health hazards, BMI assessment)Summary of FindingsThe age groups with the highest ED visits from 2008-2010 were the 25-44 year oldswith body injuries and major trauma followed by the 00-17 year olds for Otitis mediaand Eustachian Tube disorders.Traffic accidents accounted for 10.2% of injury deaths in the county from 2001-2008compared to NJ’s rate of 8.2%. Poisonings deaths followed at 8.3% in the countycompared to NJ’s rate of 7.5%.Substance Abuse, Heroin and other Opiates are the leading diagnosis for ED visitsfor the 25-34 year olds followed by the 18-24 year olds. The 35-49 year oldsaccounted for 31.7% of clients attending the Ocean County Intoxicated DriverProgram.The top five communicable infectious diseases in 2010 in Ocean County wereHepatitis C with a rate of 43 compared to NJ’s rate of 11 per 100,000 populations,Lyme Disease with a rate of 33 for Ocean County compared to NJ’s rate of 38,Salmonellosis with a rate of 15 compare to NJ’s rate of 14, and Campylobacteriosiswith a rate of 11 compared to NJ’s rate of 11. Ocean County also faired higher onShigellosis at a 38.9 rate compared to NJ’s rate of 6.7 in 2009. Pertussis and Mumpsoutbreaks in 2012 and 2009 have contributed to a higher rate of vaccine preventablediseases in the county compared to NJ’s rate.Ocean County is leading in the Maternal and Child Health indicators meeting most ofthe targets set by Healthy NJ 2020.The most prevalent chronic diseases in 2010 were asthma, diabetes and heartdisease.The leading causes of death are diseases of the heart, cancer, stroke and chronicrespiratory diseases followed by unintentional injuries (2000-2007).The leading cancer incidences in 2008 were breast and prostate cancer at a rate of180.0 and 156.8 respectively, even though, 68% of women over 40 are havingmammographies and 60% of men are having PSA screenings.Mental Health is seen across all age groups adding to the unmet demand foradequate services affecting all healthcare venues from the use of ED to the long waittimes in outpatient services.17
Ocean CountyCommunity Health Needs Assessment Data 201318
IntroductionThe 2013 Ocean County Community Health Needs Assessment Data is a compilation ofprimary data collected from Public Health, Federally Qualified Health Centers and countyhospitals, as well as from various secondary data sources with the purpose to assessOcean County community health needs. The new requirements of the Affordable Care ActSection 501(r) (3), requires that non-profit hospitals conduct and report on a communityhealth needs assessment every three years in order to maintain their tax exempt status. TheFederally Qualified Health Centers that serve designated medically underservedpopulations/areas or special medically underserved populations are required to demonstrateand document the needs of its target population in a needs assessment every five years aspart of its program and grant application requirements (Section 330(k) (2), and Section330(k) (3) (J) of the Public Health Service Act. The Public Health Practice Standards ofPerformance for Local Boards of Health in New Jersey N.J.A.C. 8:52-10 and 11 requires thelocal health departments to perform a community health assessment and community healthimprovement plan every four years to help leverage community resources and providesupport programs for the underserved (N.J.A.C. 8:52-9.2).Since a community health assessment requirement exists for multiple agencies, anopportunity for a shared effort and work is the foundation of the 2013 Ocean CountyCommunity Health Needs Assessment. The partnering of various healthcare agenciesallows for sharing of data and the avoidance of duplication of services while focusing moreon the health needs of the community. The partnering has offered the ability to provide upto-date information directly from the agencies who are the primary data collectors.A broad understanding of community health needs is necessary to prioritize and planprograms or allocate resources in the county. It is our goal this document will assist you inplanning for appropriate programs that will help deliver needed services to the communitythru improve communication and data sharing amongst healthcare agencies while meetingfederal or state regulatory requirements for a countywide community health needsassessment.Ocean County Health Advisory GroupIn February 2011, the Ocean County Health Advisory Group for a countywide communityhealth needs assessment was formed as the major pillars in identifying and addressinghealthcar
Data Book 2013 . 2 Ocean County Community Health Needs Assessment . The Ocean County Community Health Needs Assessment of 2013 is a combination of primary and secondary data. The data presented is broken down in three major age groups for easier discussion and understanding, and c

