Transcription
Analyzing PI System DataVersion 2018
How to Use this WorkbookEach Main Heading describes ahigh-level valuable learning topic.Your objectives are skills youcan expect to learn in thissegment.New concepts are presented aslevel 2 headings.Throughout the class you will bepresented with questions andchallenges to help you learn.The majority of your time will bespent learning new skills viahand-son exercises, either insmall groups or on your own.Icons help you identify themes,like exercises, tools, tips, ordocumentation references.User manuals, Learning workbooks, and other materials used in class can bedownloaded from http://techsupport.osisoft.com. Login to an OSIsoft technicalsupport account is required.Page i
Analyzing PI System DataSoftware Versions Used in this DocumentThe list below describes the software versions used in this version of the course.iiSoftwareVersionPI DataLink2017 SP2Microsoft Office2016PI ODBC Driver2016 R2PI Integrator for Business Analytics Advanced Edition2018PI OLEDB Enterprise2017 R2Microsoft SQL Server2014PI Data Archive2018PI Asset Framework2018PI Vision2017 R2 SP1
Contents123Welcome . 51.1Course Environment . 51.2Review PI System Architecture . 61.3Assets and Tags – The Basic Building Blocks in the PI System . 81.4Discussion .11Business Intelligence .122.1Intro to Power BI .132.2Directed Activity – Inspect a Sample Power BI Report .13Part 1 – Power BI Reports using PI Integrator for BA .193.1456PI Integrator for Business Analytics.214.1Architecture .214.2PI Integrator Web UI .214.3Directed Activity – Create the Transformer Loading View .23Building the Distribution Network Reports .315.1Preparing and Importing the Tables .315.2Building the Report Visuals .34Part 2 – Power BI Reports using PI OLEDB Enterprise .876.1789Directed Activity – PI AF Hierarchy and Data Set .19Directed Activity – PI AF Hierarchy and Data Set .88PI Analysis Service .917.1Capabilities of the PI Analysis Service .917.2Expressions .927.3Rollups .103Event Frame Generation .1108.1What are Event Frames? .1118.2Event Frame Generation .1208.3Discussion .126Analyzing Events .1279.1Objectives .1279.2PI Event Frames in PI System Explorer .1279.3PI Event Frames in PI DataLink .1339.4PI Event Frames in PI Vision.140
Analyzing PI System Data9.510Discussion .147PI OLEDB Enterprise SQL Queries .14810.1 Dissecting the Syntax .14810.2 PI OLEDB Provider or Enterprise? What’s the difference? .15010.3 Table Aliases .15610.4 JOIN Statements .15610.5 Built-in Functions.16310.6 Data Tables .16410.7 Data Transpose Functions & Function Tables .16810.8 UNION Statements .17910.9 Saved Views .18310.10 Importing PI OLEDB Enterprise data to Power BI .18810.11 Discussion .19411Building the “Fleet Generation” Report .19511.1 Preparing and Importing the Tables .19511.2 Augmenting the Data using DAX.20811.3 Configuring the Visualizations .210412Final Exercise: Create a Report .21313Appendix A Substitution Parameters .21614Appendix B Performance Equation Operands and Functions .21815Appendix C PI SQL Commander Table Relationships .223
Analyzing PI System Data1 WelcomeWelcome to the Analyzing PI System Data Course!Since you are attending this class, you should have some experience with OSIsoftClient Tools (PI ProcessBook, PI DataLink, PI WebParts and PI Vision), either usingdisplays, reports or webpages previously created to analyze your data, or creatingthese displays, reports and webpages so that others in your organization haveaccess to all the powerful data that resides in the Data Archive and data external tothe PI System.The basic tasks within these tools are presumed to be understood; what you willexperience here can be seen as a factory of ideas, a space for OSIsoft customers torealize how powerful existing data can be when analyzed with the advanced optionsof our tools and additional third party tools, and integrated with non-PI data.Hope you enjoy!1.1 Course EnvironmentThe environment for this course is being hosted with Azure. The environment has 3VM and contain the following: PIDC – Domain ControllerPISRV01 – The server environmento Microsoft SQL Server 2014o PI Data Archive 2018o PI AF Server 2018o PI AF Client 2018o PI Vision 2017 R2 SP1o PI Integrator for Business Analytics Advanced Edition 2018PICLIENT01 – This is the primary working environment.o PI System Explorer 2018o Microsoft Office Professional Plus 2016 (64-bit)o Microsoft PowerBI Desktop 2.59.5135.781o Google Chrome 68.0.3440.106The userid for each student is pischool\student01, password will be provided bythe instructor.Page 5
Analyzing PI System Data1.2 Review PI System ArchitectureObjectives: Define the components of a PI SystemDraw a diagram of the architecture of a PI SystemThe PI System DescribedThe PI System collects, stores, and manages data from your plant or process. Youconnect your data sources to one or more PI Interface nodes. The Interface Nodesget the data from your data sources (control systems, instrumentation, etc) and sendit to the Data Archive. The data is organized and given context using PI AssetFramework. Users get data from the Data Archive and Asset Framework and workwith it using a variety of client tools, such as PI Vision and PI DataLink.6
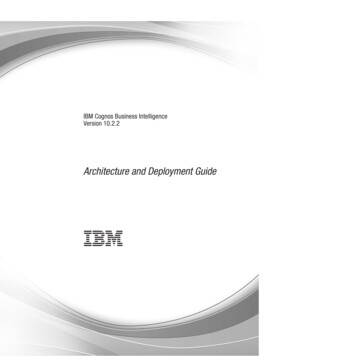
Analyzing PI System Data1.2.2Architecture of a Typical PI SystemSometimes the architecture can be very simple. Some customers have as few asone or two interfaces feeding data to a single Data Archive. Access to data isthrough the single Data Archive.PI AF ServerAsset AnalyticsEvent FramesNotificationsNetwork DevicesIT MonitorProcessControlsDCS / PLCOPCHQ PI DataArchiveRelationalDatabaseSite PI DataArchiveHTML /Web ServicePI CloudConnect450 PI Interfaces andPI Connectors(Failover)Mobile DevicesPI VisionPI Web APIPI VisionSQL ServerText /Flat FilesPI ProcessBookPI Manual LoggerPI to PIPI DataLinkData SourcesProcess ControlNetwork (PCN)DMZCorporate LANVPNThere are often several Data Archives in an organization, aggregating data fromlower levels. Some corporations have Data Archives dedicated to servicing theirclients with restricted company data.Page 7
Analyzing PI System Data1.3 Assets and Tags – The Basic Building Blocks in the PI SystemObjectives: Define an AF Asset with its components element and attributes.Define four attribute types: Static (None), PI Point, Formula, and TableLookup.Define a Data Archive Tag with the attributes Tag Name, Descriptor, andPoint Source.Define the different data types that can be stored in Data Archive Tags.AutoCreateTagsAssetsFigure 3: Tag Auto CreationWhat is an Asset?The AF Server is a part of the PI System. It contains asset or “metadata” usuallyorganized according to the assets containing the attributes being monitored. AF canbe helpful to users of the Data Archive who know the assets, but are not familiar withattribute nomenclature. With assets, data can be located without understanding thetechnical details of each piece of equipment. Organized assets help find all of theattributes associated with a specific piece of equipment.What is an AF Attribute?Attributes represent a unique property associated with an asset. The attributemaybe a constant, a value from an internal AF table, a value from an externaldatabase or a storage point for data in the Data Archive. An AF attribute is simply asingle point of measurement. The point has been the traditional storage method ofdata in the Data Archive. The AF Server can automatically generate points asassets are created.Some Basic Properties and Why They Are Important to YouAF attributes and Data Archive points have a set of properties that define them.Some common properties used in client tools are for display or informationalpurposes.8
Analyzing PI System DataAttribute nameThe attribute name is similar in concept to the point description. A detailed name forthe attribute may help the user identify the source of the information.Figure 6: Attribute NameTag nameUnique name is used to create points for storage in the Data Archive. Points for dataattributes storage can be built through AF templates using substitution parametersfor local naming convention or can be searched for on the Data Archive.Creating points through templates, lends consistency in nomenclature makingsearches easier for PI Administrators. For example, which might be easier to locatein a search?Point: M03 E1P1 MOTDRV1202 RUNSTATAttribute: Machine3 Enclosure 1 Panel 1 Motor Drive 1202 Run StatusSubstitution parameters are variables placed in attribute templates for PI point and PI pointarray data references representing portions of the AF hierarchy.For example, %Element% is a substitution parameter that represents the element name. Afteryou create an element based on that template, you tell AF to create the data reference. WhenAF creates the reference, it substitutes the current element name wherever %Element% ispresent.Page 9
Analyzing PI System DataDescriptorThis is the human-friendly description of the Data Archive Point, similar to theattribute. The descriptor is often a search criterion since the point name is notalways intuitive. Often the point name is some sort of abbreviated convention andthe descriptor captures the “full name.”Point sourcePoints can be related to their interfaces that collect the data by a point attributecalled pointsource. Grouping by point source allows all of points associated with aparticular device to be identified by searching for all points of a certain point source.This assumes that the user knows the point sources in use and that will not be true inmost situations.Point typeThe PI point attribute that specifies the data type for the values that a point stores.The possible point types include int16, int32, float16, float32, float64, digital, string,BLOB, and timestamp.10
Analyzing PI System Data1.4 DiscussionThis is a discussion designed to maximize learning in a specific topic area.Your instructor will have questions, and will prompt for communication withinthe class. This is an open ended section and the result depends on yourneeds.Objective: The AF data is to be included within our Business Intelligence tools.What data do we want to see? This can be in the context of your own system, or theexample AF databases available in the class.Approach What do we currently use our AF databases for regrading report generation?Within the example database, what else do we want to know? What ismissing?Pros and cons of including external asset related data within the AF structureWhat sort of BI tools would we want to use to view this data?Estimated Completion time 15 minutes.Page 11
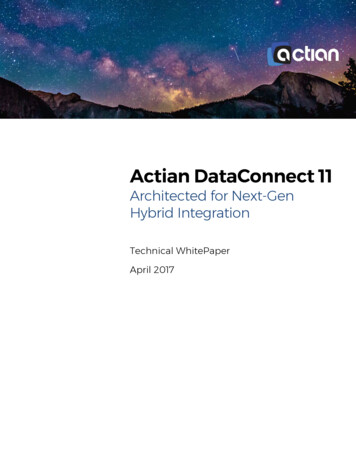
Analyzing PI System Data2 Business IntelligenceBusiness intelligence (BI) tools offer solutions to quickly analyze raw, un-normalized,multidimensional data. In concert with historical values from the Data Archive,metadata and calculations from Asset Framework, and business intelligence tools,users can quickly create interactive reports to gain insight on business andoperational processes.Later on in the course, we will explore the process of preparing the Asset Frameworkmodel to add additional dimensions of information to our AF database. The next stepis extracting desired information (process data, metadata, and event frame data)from the PI System through PI Data Access tools. This data will be incorporated intoa BI cube and used to develop interactive reports that allow us to “slice and dice” ourdata and bring meaning to our multidimensional data cube.The Distribution Network and FleetGeneration databases have acomprehensive amount of informationincluding a hierarchy of substations,metadata for each asset. The figure to theright depicts a data cube that capturesmetadata and real-time data of generatingunits.Inclusion of additional attributesthrough table lookups and analyticson existing attributes allow for theexpansion of additional columns (ordimensions) to the data cube above.Further, historical data, interpolatedor compressed, add an additionaldimension of information that bringmore meaning in BusinessIntelligence reports.12
Analyzing PI System DataIn the next several chapters in the course, we will be using a pair of AF databases toexpose meaningful data that will help management and engineers make better, moreinformed decisions. Specifically, we will add value through the following:1. Expose the database in a simpler structure for data processing.2. Develop analytics within PI AF and PI Integrator for Business Analytics3. Import the data into Microsoft Power BI4. Draw actionable conclusions from the resulting data sets in our reports2.1 Intro to Power BIPower BI is a business analytics service and client provided by Microsoft. It provides interactivevisualizations with self-service business intelligence capabilities, where end users can createreports and dashboards by themselves, without having to depend on information technologystaff or database administrators.Some of the benefits of Power BI: Less work than Excel for more complex analysis and visualsCan solve problems that are simply too large for Excel and PI DataLinkCheap – Free download or 9.99 / month per user for Power BI ProLive reporting and centralized web-based dashboards in Office 365Slick visuals including 3rd Party Visuals in Microsoft AppSource2.2 Directed Activity – Inspect a Sample Power BI ReportIn this part of the class you will perform a learning activity to explore thedifferent concepts presented in this chapter or section. You may be invited towatch what the instructor is doing or perform the same steps at the same time.You may play a game or hold a quiz. Your instructor will have directions.Objective: Explore a sample Power BI Report.Page 13
Analyzing PI System DataApproachWe’ll start by getting a feel for Power BI using a pre-built report. Open C:\Class\Part 1 - PIIntegrator for BA\Solutions\Transformer Loading.pbixRight now we’re looking at the Report View where the report and visuals are configured. Startclicking on the visuals and the rest of the report will be filtered to only include the selected items.This is often referred to as slicing and dicing the data.Click on the Data Tab to inspect the data set we’ll be working with:14
Analyzing PI System DataNote that all the columns are available in the Fields List:Go back to the Report View, click on the Pole Transformers Table visual, and note theVisualizations Pane and Fields Pane. These sections are where the bulk of the configurationtakes place. Columns from the data set are dragged and dropped from the Fields Pane onto thevarious sections in the Visualizations Pane. We can see that the Secondary Transformer,Phase, Service Hours, Average of Loading, and PI Vision columns are being displayed in thetable.Page 15
Analyzing PI System DataAdd the Voltage Average column to the table by selecting the table and doing a drag and drop:The Voltage Average will be displayed in the table, but by default all the voltages from all therows will be summed by transformer. It makes more sense to summarize these as an average,so click the drop down and change the summary to Average:16
Analyzing PI System DataResize the column directly on the visual similar to Excel:Average of Voltage Average is a pretty weird header name, so rename it to Average Voltage:Other Formatting Options are available by clicking the paint roller icon:Page 17
Analyzing PI System DataWe’ll go over more formatting options in the exercises, so for now just bump up the text size ofthe column headers and resize columns and visuals so everything fits:Your report should now look something like this.We will build this report from scratch in a future exercise.18
Analyzing PI System Data3 Part 1 – Power BI Reports using PI Integrator for BAThis course will be broken down into two main sets of exercises. In Part 1, we’ll usePI Integrator for BA to publish data from PI and spend a lot of time configuring PowerBI. In Part 2, we’ll make modifications to a PI AF hierarchy and then use PI OLEDBEnterprise to extract the report data.In Part 1, we will be working with a data set for a power distribution company, whichincludes electrical characteristics for over 1500 single-phase transformers. Thesource data comes from a real PI System and will be published in a data-scienceready format using PI Integrator for BA. Once this is done, we'll configure an array ofPower BI visuals and integrate the results with PI Asset Framework and PI Vision.The transformers we will be analyzing are secondary transformers that deliver powerto homes and businesses, which you may have seen on a pad or pole in your ownneighborhood. There are thousands of them to keep track of, making this a difficultproblem to solve using Excel.The transformers themselves are not actually instrumented. The power and voltagecharacteristics we will analyze have actually been computed by rolling up childMeters in PI AF.3.1 Directed Activity – PI AF Hierarchy and Data SetIn this part of the class you will perform a learning activity to explore thedifferent concepts presented in this chapter or section. You may be invited towatch what the instructor is doing or perform the same steps at the same time.You may play a game or hold a quiz. Your instructor will have directions.Objective: Better understand the data set used in the following chaptersWe will take a few minutes to understand where the data set came from and relate the samplePower BI report back to the PI System. We are working with a data set for a fictitious powerdistribution company. They have built a PI AF Hierarchy for their transformers and metersserving a number of geographical areas. In this course, we will focus on analyzing thetransformers.Page 19
Analyzing PI System DataOpen PI System Explorer and head to the Distribution Network AF database. Drill down to alevel with transformers (names starting with PT ) and inspect the available attributes. We will beusing a sub-set of these attributes for all of our analysis, in addition to leveraging the AFhierarchy.Note that because the Transformers are not instrumented, Voltages, Voltage Quality, and WhDelivered are rolled up from the child meters using Asset Analytics.Data from this PI AF hierarchy will be published for use in a Power BI report in a laterexercise.20
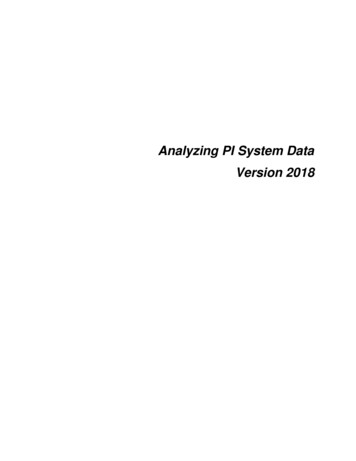
Analyzing PI System Data4 PI Integrator for Business AnalyticsGetting the data out of the AF structure and into the client tools requires the use of integrationsoftware such as the PI Integrator for Business Analytics or PI OLEDB Enterprise. This chapterwill discuss the former method of extracting the data.4.1 ArchitectureThe PI Integrator for Business Analytics resides on a web server between the clientmachines and the source AF server. As such, we are not connecting directly to theAF Server but instead to a web server that contains a cache of our desiredinformation. The architecture within our class system however has both the AFServer and Web Server residing on the PISRV01 machine. The PI Integrator forBusiness Analytics site can be accessed via https://pisrv01.pischool.int:777 or fromthe desktop. If prompted for credentials, enter your student account, as this hasbeen given access rights.PI AF ServerPI AF databasesWeb ServerPI Integrator for BusinessAnalyticsPI SQL DASClientMicrosoft ExcelMicrosoft Power BITibco SpotfireEtc.4.2 PI Integrator Web UIViews can be created within the PI Integrator portal that is hosted on the Web Servermachine.A list of previously generated views is present within the portal on the My Viewspage, allowing for previewing and maintenance. These existing views can also becloned and modified, allowing different views to be created and utilized within BIclient tools.The following is a breakdown of the My Views page layout, and the differentoperations available.Page 21
Analyzing PI System DataNote: The information regarding the My Views page layout is available within the PI Integratorfor Business Analytics User Guide.The My Views page shows details about your views.1.2.3.4.5.6.7.8.22All the views to which you have access are listed in the tableClick to create an Asset View that is based on Elements and Element TemplatesClick to create an Event View that is based on Event Frames and Event Frame TemplatesClick to create a Streaming View that is based on Event Frames and Event FrameTemplatesTo modify a view, select the view in the table and click Modify View.To delete it, click Remove View. Deleting a view removes data from the buffer, thereforefreeing up space. However, this does not free up the available output streams allowed withyour license.For the selected view, the Overview, Log and Security tabs provide the following detailsabout that view:· Overview indicates whether the view has been published. This tab also summarizesinformation about the view, such the PI AF database it uses, when the view was last run,and the shape that it uses. If the view is currently being published, the run status barindicates progress and you have the option to stop the publishing process.· Log displays log information. You can adjust the start and end times, and you can filterthe messages to display those of a certain severity, for example, critical errors.· Security shows who has access to the view, and if you have sufficient privileges, allowsyou to change the level of accessThe red message counter icon at top right show that there are warning and error messages
Analyzing PI System Datarecorded by PI Integrator for Business Analytics. Click the icon to open the message list.9.Click the gear iconat top right to see the version of PI Integrator for BusinessAnalytics and AF you are using.4.3 Directed Activity – Create the Transformer Loading ViewIn this part of the class, you will perform a learning activity to explore thedifferent concepts presented in this chapter or section. You may be invited towatch what the instructor is doing or perform the same steps at the same time.You may play a game or hold a quiz. Your instructor will have directions.Objective: Use the PI Integrator for Business Analytics to create an Asset View, whichwill be used in later exercises.Approach:Open Google Chrome and Navigate to the PI Integrator for BA Web UI athttps://pisrv01.pischool.int:777Click Create Asset View and name it Transformer Loading, click Create View:Click Create a New ShapePage 23
Analyzing PI System DataSelect Distribution Network as the AF Database, then drill down to PT XYZ0343.Drag and drop Alajuela to the Shape BuilderEdit the Filter on Alajuela:24
Analyzing PI System DataClear the Asset Name Checkbox, Change it to filter on the Headquarters template,click Save:Drag and drop Avenida Central to the Shape configuration, and change it to filter onthe Substation Template:Page 25
Analyzing PI System DataRepeat this pattern for Transformer 1 (Template Single Transformer), ColegioCientifico (Template Circuit), X Phase (Template Phase).Drag and drop PT XYZ0343 and select Secondary Transformer as the Template,this time check the box to search derived templates.The shape configuration should look like this:26
Analyzing PI System DataClick PT XYZ0343 then hold control and multi-select Loading, Maximum KVA, RatedKVA, Transformer Type, Voltage Average, Voltage Maximum, Voltage Minimum,Voltage Quality, and Wh Delivered Load. Drag and drop these selections to theShape configuration.There should be over 100 matches in the preview, click Next in the top right corner.Page 27
Analyzing PI System DataWe now see a preview of the data using the default Time Range and interpolationmode.We want to publish Hourly data for the time period 01-Jun-17 00:00:00 to 31-Aug-1723:00:00. Modify the Start Time and End Time and click Apply:Click Edit Value Mode and change the time step to 1 hour, then Save Changes:The TimeStamp column should now reflect changes to the Start, End, and ValueMode:28
Analyzing PI System DataNow we’ll add some additional time columns that will come in handy later whenbuilding the reports. Click Add Colum. Select the Time Column tab. Select Month,Month Name, Week of the Year, and Hour, then click the arrow to bump them over tothe right:Click Display 5 Time Columns:Page 29
Analyzing PI System DataNow the time ranges and columns have been specified, click Next.Now we can choose what target to publish to. This depends on the platform used tosupport front-end application, but for our purposes we’ll publish to a SQL Server.Select SQL Server for the Target Configuration, Leave Run Once checked, and clickPublish:It will take a few minutes to publish the data.30
Analyzing PI System Data5 Building the Distribution Network ReportsWe will now spend a significant amount of time configuring Microsoft Power BIreports. The first step is importing the data.5.1 Preparing and Importing the TablesNow that the Transformer Loading table has been published, we will import the SQL table intoPower BI.Directed Activity – Import Data from Microsoft SQL Server.In this part of the class, you will perform a learning activity to explore thedifferent concepts presented in this chapter or section. You may be invited towatch what the instructor is doing or perform the same steps at the same time.You may play a game or hold a quiz. Your instructor will have directions.Objective:Import the Transformer Loading table.Approach:Open Microsoft Power BISelect Get Data - SQL Server.Page 31
Analyzing PI System DataEnter PISRV01 as the server name and click OK.If Prompted, Leave “use my current credentials” selected and click Connect:There may be a warning that the connection is not encrypted, this can be safely ignored, clickOK:32
Analyzing PI System DataExpand the PIInt database and Select the Transformer Loading table, click LoadNote that about 3.8 million rows have been imported.Page 33
Analyzing PI System Data5.2 Building the Report VisualsNow that the Transformer Loading table has been imported, the rest of the chapter will be awalkthrough of configuring various report visuals.In case there were mistakes or problems with the previous steps, a starter .pbix filehas been created with the raw data set already imported with columns that will matchthe exercises exactly.Open C:\Class\Part 1 - PI Integrator for BA\Starter File - Part 1 DistributionNetwork.pbix and use this
PISRV01 – The server environment o Microsoft SQL Server 2014 o PI Data Archive 2018 o PI AF Server 2018 o PI AF Client 2018 o PI Vision 2017 R2 SP1 o PI Integrator for Business Analytics Advanced Edition 2018