Transcription
Introduction to basic GIS and spatial analysis usingQGIS:Applications in BangladeshZia Uddin AhmedTimothy J. KrupnikMustafa Kamal
Introduction to basic GIS and spatial analysis using QGIS:Applications in BangladeshZia Uddin AhmedTimothy J. KrupnikMustafa KamalCereal Systems Initiative for South Asia (CSISA)
Introduction to basic GIS and spatial analysis using QGIS:Applications in Bangladeshby Zia Uddin Ahmed, Timothy J. Krupnik and Mustafa KamalCIMMYT, the International Maize and Wheat Improvement Center is the global leader onpublicly funded maize and wheat research and related farming systems. Headquartered nearMexico City, CIMMYT works with hundreds of partners throughout the developing world tosustainably increase the productivity of maize and wheat cropping systems, thus improvingglobal food security and reducing poverty. CIMMYT is a member of the CGIAR Consortiumand leads the CGIAR Research Programs on MAIZE and WHEAT. The Center receivessupport from national governments, foundations, development banks and other public andprivate agencies.This work is licensed under the Creative Commons Attribution4.0 International License. To view a copy of this license, visithttp://creativecommons.org/licenses/by/4.0/ or send a letter to Creative Commons, PO Box1866, Mountain View, CA 94042, USA. The designations employed in the presentation ofmaterials in this publications do not imply the expression of any opinion whatsoever on thepart of CIMMYT or its contributory organizations concerning the legal status of any country,territory, city, or area, or of its authorities, or concerning the delimitation of its frontiers orboundaries. The opinion expressed are those of the author(s), and are not necessarily thoseof CIMMYT or its partners. CIMMYT encourages fair use of this material with proper citation.Correct Citation: Ahmed, Z.U., Krupnik, T.J., Kamal, M., 2018. Introduction to basic GISand spatial analysis using QGIS: Applications in Bangladesh. Cereal Systems Initiative for SouthAsia (CSISA) and the International Maize and Wheat Improvement Center, CIMMYT. Dhaka,Bangladesh.Publication DesignM. Shahidul Haque KhanMd. Nazmul Islam DulalPublished byCIMMYT- BangladeshHouse 10/B, Road 53, Gulshan 2, Dhaka 1212Tel (Land/Fax): 880 2 9896676, 880 2 9894278Post: P.O. No. 6057, Gulshan, Dhaka 1212, BangladeshPublished in 2018
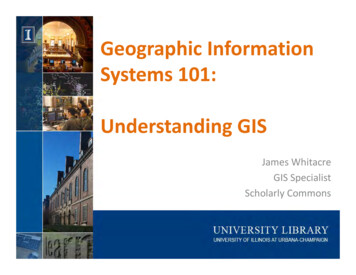
This set of training modules was developed by the International Maize and WheatImprovement Center (CIMMYT) as part of the Cereal Systems Initiative for South Asia(CSISA) project.CSISA was established in 2009 to promote durable change at scale in South Asia’s cerealbased cropping systems. Operating in rural ‘innovation hubs’ in Bangladesh, India and Nepal,CSISA works to increase the adoption of various resource-conserving and climate-resilienttechnologies, and to improve farmers’ access to market information and enterprisedevelopment. CSISA supports women farmers by improving their access and exposure tomodern and improved technological innovations, knowledge and entrepreneurial skills. Bycontinuing to work in synergy with regional and national efforts, and by collaborating withmyriad public, civil society and private sector partners, CSISA aims to benefit more than eightmillion farmers by the end of 2020.This publication was funded by the United States Agency for International Development (USAID andBill and Melinda Gates Foundation (BMGF). The views and opinions expressed in this publication arethose of the author(s) and do not necessarily reflect the views of BMGF, USAID or the US Governmentand the other Donors.
Table of ContentsINSTRUCTIONS BEFORE YOU BEGIN USING THIS SET OF LEARNING MODULES .- 1 MODULE 1: DOWNLOADING AND INSTALLATION OF QUANTUM GEOGRAPHICINFORMATION SYSTEMS (QGIS), GRASS 7 AND R .- 2 MODULE 2: AN OVERVIEW OF THE QGIS INTERFACE .- 29 MODULE 3: LOADING SPATIAL DATA AND VISUALIZATION IN QGIS .- 39 MODULE 4: COORDINATE REFERENCE SYSTEMS IN QGIS .- 50 MODULE 5: WORKING WITH GPS DATA .- 60 MODULE 6: WORKING WITH TABULAR DATA .- 65 MODULE 7: WORKING WITH VECTOR DATA.- 80 MODULE 8: WORKING WITH RASTER DATA .- 90 MODULE 9: TERRAIN ANALYSIS .- 94 MODULE 10: SPATIAL ANALYSIS .- 107 MODULE 11: GEOREFERENCING GOOGLE EARTH IMAGERY .- 115 MODULE 12: CREATING A NEW VECTOR DATASET.- 119 MODULE 13: MAP PRODUCTION IN QGIS .- 126 GLOSSARY OF KEYWORDS .- 135 -
Instructions before you begin using this set of learningmodulesBefore you begin working with these learning modules, please take time to download the dataand other information you will need to complete the hands-on exercises detailed in this book.You can download these files as described below:1. Go to the following link by clicking here. The website that houses the data you needto download looks like shown below:2. You will find listed on this webpage all of the required files that you need to use foreach module exercises in this book in zip format, as shown below.3. Download the ten individual .zip files (one for each of the modules in this book,beginning on Module 3 and ending with Module 13). In total, the files are over 500 MBin size, so they may take some time to download.4. Keep the files on the local drive of your computer, in a location that is easy to accesssuch as the documents folder or root location of any drive.5. As you work through the modules in this book, you will find instructions to loaddifferent files that are in each of the folders in the zip files. Please open and make useof the downloaded files as required to complete the exercises in each of the modules.6. Keep these files available, as you will be requested to import them into QGIS for theexercises in the different modules in this book.-1-
Module 1: Downloading and Installationof Quantum GeographicInformation Systems (QGIS), GRASS 7 and RBefore downloading and installation of QGIS and other software in Windows, check yourWindows System type (32 bit or 64 bit) to assure compatibility.1. Click theWindows StartbuttonStart2. Type “System” inthe search bar,and then clickSystemSearch bar-2-
64-bitDownload QGIS nload.htmlThe OSGeo4W repository contains a lotof software from OSGeo projects. QGIS and all dependencies (supporting software) areincluded, along with Python, GRASS 6.4.3 (http://grass.osgeo.org/), SAGA GIS2.0.8(http://www.saga-gis.org/en/index.html), GDAL (http://www.gdal.org/), etc. If you want to runR-script in QGIS, you have to install latest version of R (http://www.r-project.org/).Note that this set of training modules focuses on using Windows for QGIS, although QGIS isalso compatible with Macintosh computers. Instillation is similar and many online guides forhow to work with QGIS in a MAC environment are available. Please also note that newversions of QGIS, GRASS, GDAL and R may have been released since this publication wascompleted. Where this is the case, feel free to use the new versions, although you may needto adapt portions of the instructions in each module to some mall extent.The QGIS installer can be installed from the internet or you can download all requiredpackages beforehand and then apply them. The downloaded files are located in a localdirectory for future installations. Steps of the downloading QGIS installer are:-3-
1. Click Windows Start button2. Go to Control panel, then System, then System type3. Click Save File. The installer will be saved in C:\Users\[yourusername]\Downloadsdirectory.-4-
Installation of QGISFor Windows XP through Windows 8 (both 32 and 64 bit), the OSGeo4W installer offersmany more choices since it includes the ability to install many other Open Source GISsoftware packages and libraries such as: Quantum GIS, GRASS GIS, SAGA GIS, GDAL tools,MapServer, OpenEV, uDig, and more.Standalone Installer1. To download the OSGeo4W installer click here.2. Navigate to the directory where the downloaded osgeo4w-setup-x86 64.exeinstallercan be found.3. Right click on the installer and select Run as administrator.4. Click Next5. Click I Agree for the License agreement-5-
-6-
6. Keep the default destination folder (C:\Program Files)and click Next7. Click Install (at this point, there is no need to download training data – we willreturn to this later). This part of the process takes several minutes.-7-
8. Click FinishNetwork Installer (for advanced users)1. To download the OSGeo4W installer click here.2. Navigate to the directory where the downloaded osgeo4w-setup-x86 64.exeinstaller is exit.3. Double-click and follow the instruction4. Choose Advanced Install and click Next-8-
5. Choose Install From Internet and click Next6. Set root directory to: C:\OSGeo4W\ and check the radio button All Users,andclick Next-9-
7. Select Local Package Directory (C:\Users\[yourusername]\Documents) as atemporary directory, and click Next8. Select Direct Connection and click Next- 10 -
9. Choose download site and click Next10. Select Packages: In the "Categories field" as shown below, click on the symbolbefore "Desktop" to extend the folder tree.- 11 -
11. Click (expand) and select packages to Install.12. Click Next- 12 -
13. Agree License Agreements (this will need to be done 4 times), and Click Next- 13 -
Please wait, download and Installation will take several minutes, especially if you have slow internet.- 14 -
14. Click FinishInstallation of additional plugins in QGISThe core engine of QGIS is coded in C , but additional QGIS plugins are written in thescripting language Python which is easy to learn. A growing community in the field of geoinformatics use Python to extend the functionality of QGIS. You may install additional pluginswith your internet connection. PLUGINS -- MANAGER AND INSTALL PLUGINS -- SETTINGS. Make sure that‘Show also experimental plugins’is turned on.When the connection with python plugin repositories is established, it becomes possible toinstall necessary plugins from:PLUGINS -- MANAGER AND INSTALL PLUGINS -- NOT INSTALLED MENUYou can also activate and deactivate the plugins in the Installed tab of the Plugin Manager.- 15 -
Download and Installation of RDownloadingIf you want to use R function in QGIS R will need to be installed in your computer. R is anopen-source statistical software program that is increasingly popular among scientists. R candownload from the R project website (www.r-project.org ), a repository CRAN (Rdevelopment Core Team, 2014). As R is a free program, no identification is required.1. For R installers, please go to http://www.r-project.org/- 16 -
2. Click CRAN for download Packages3. Select any CRAN Mirrors from the closest location on the globe proximal to yourlocation- 17 -
4. Select Download R for windows5. Click base or install R for the first time- 18 -
6. In this set of modules, we use R. 3.1.1. Note however that more advanced versions ofR have since been released, and you can also use these in place of version 3.1.1. ClickDownload R. 3.1.1 for Windows7. Click Save File. The installer will be saved inC:\Users\[yourusername]\Downloads directoryInstallation1. To download R-3.1.1 for Windows (32/64 bit)click here.2. Navigate to the directory where the downloaded R-3.1.1-win.exe filejustdownloaded.3. Double-click on it and follow the instructions.4. Select Setup Language: click OK (Note: Keep default language English)- 19 -
GNU General Public License: click Next- 20 -
Select Destination Location as C:\OSGeo4W64\bin\R-3.1.1: click Next Select Components: Select 64 or 32-bit according to your system, click Next- 21 -
Start Option: click Next (No accept defaults) Select Start Manu Folder: click Next (Keep default)- 22 -
Select Additional Tasks: click Next (Keep default) Installation (this again can take several minutes so please be patient)- 23 -
Click Finish- 24 -
R Packages and LibrariesPackages are collections of R functions, data, and compiled code in a well-defined format.The directory where packages are stored is called the library.Installation of R-packagesIf the R program has already been installed, the installation of any ‘package’ can be donedirectly from the console of R through the Internet or from the local drive.Installation from a local drive:1. Click here to download R package named ‘agricolae’2. Open R3. Click Packages from menu barSelect Install packages (s) from local zip files. Navigate to the directory wheredownloadedpackages exist.Select any package or multi multiple packages with shift key and click “Open”Installation from Internet:1. Choose Install Packages from the Packages menu.2. Select a CRAN Mirror (e.g. the location closest to where your computer is)3. Select a package (e.g. agricolae)- 25 -
QGIS configuration for R/SAGA/GRASS GISDisplay settingsIn QGIS 2.4.0, the rendering speed of displaying large image data is much improved usingmulti-threading, which allows the computer to receive multiple commands from the userwithout significant delays in response. This option is not enabled by default, so it is a goodidea for you to turn it on. Go to SETTINGS -- OPTIONS -- RENDERINGand click thecheckbox Render layers in parallel using many CPU cores on. Once this is done, you will findthat zooming and moving layers is considerably faster, saving your valuable time.Configuring the Processing ToolboxThe new spatial processing framework is a highlight of QGIS 2.4. It is based on the Pythonplugin SEXTANTE coded by Victor Olaya, which integrates a large number of analysisalgorithms from different open source projects. The plugin functions are activated by default- 26 -
and can be found under the main menu PROCESSING -- TOOLBOX. A Processing ToolboxWindow should open on the right side of the GUI after you click on PROCESSING -- TOOLBOX.On the bottom of this window,you will find the drop list button‘Simplified interface’. Pleaseswitch this to‘Advanced interface’.If you correctly followed the guides for QGIS and R installation on the Windows new softwareversions of GDAL, OTB, GRASS GIS and SAGA, you will find that they are already installedand correctly configured for the Processing Toolbox.PROCESSING -- OPTIONS AND CONFIGURATION -- PROVIDERS.ExpandGRASS GIS 7COMMANDS, GRASS COMMANDS, R-Scriptsand SAGASwitch Activateon.Change theR Folder:C:\OSGeo4W64\bin\R-3.1.1R-scripts RASS folder:C:\OSGeo4W64\apps\grass\grass-6.4.3- 27 -
- 28 -
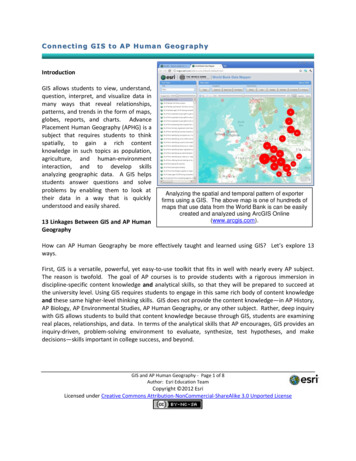
Module 2: An overview of the QGIS interfaceNote: Much of this module builds upon the online version of the standard QGIS manual (see:http://docs.qgis.org/2.2/en/docs/user manual/introduction/qgis gui.html).Furthermodulesbegin to use material specific to Bangladesh and South Asia with custom exercises. When youlaunch QGIS, you will be presented with the GUI like the figure below (the numbers one tosix in the boxes below stand for the six major areas of the interface).QGIS GUI:1.MENU BAR2. TOOLBARS8.Processing Toolbox3.LAYER LIST/MapLegend6.ADD DATA4.MAP VIEW7.Python console5.STATUS BARMenu BARThe menu bar is the most important area for accessing most QGIS features. It uses a standardhierarchical menu format. Information on the menus and keyboard shortcuts to access themare listed out below. The good news is that you can also customize and configure theshortcuts as you wish (see using the [Configure Shortcuts] tool under ‘Settings’). Most ofthe menu options have a tool that you can click on, although you need to remember that themenus are not organized precisely like the toolbars. Instead, the toolbar with the tool can befound after each menu option. Note that some menu options will only be visible if you haveloaded the plugin beforehand.ProjectMenu OptionNewOpenShortcutReferenceToolbarCtrl Nsee ProjectsProjectCtrl Osee ProjectsProject- 29 -
Menu OptionShortcutReferenceNew from template ‣see ProjectsOpen Recent ‣see ProjectsToolbarProjectSaveCtrl Ssee ProjectsProjectSave AsCtrl Shift Ssee ProjectsProjectsee OutputSave as ImageNew Print ComposerCtrl PComposer manager .Projectsee Print ComposerProjectsee Print ComposerPrint Composers ‣Exit qg see Print ComposerCtrl EditMenu OptionShortcutReferenceToolbarUndoCtrl Zsee Advanced digitizingAdvanced DigitizingRedoCtrl Shift Z see Advanced digitizingAdvanced DigitizingCut FeaturesCtrl Xsee Digitizing an existing layerDigitizingCopy FeaturesCtrl Csee Digitizing an existing layerDigitizingPaste FeaturesCtrl Vsee Digitizing an existing layerDigitizingAdd FeatureCtrl .see Digitizing an existing layerDigitizingMove Feature(s)see Digitizing an existing layerDigitizingDelete Selectedsee Digitizing an existing layerDigitizingRotate Feature(s)see Advanced digitizingAdvanced DigitizingSimplify Featuresee Advanced digitizingAdvanced DigitizingAdd Ringsee Advanced digitizingAdvanced DigitizingAdd Partsee Advanced digitizingAdvanced DigitizingDelete Ringsee Advanced digitizingAdvanced DigitizingDelete Partsee Advanced digitizingAdvanced DigitizingReshape Featuressee Advanced digitizingAdvanced Digitizing- 30 -
Menu OptionShortcutReferenceToolbarsee Advanced digitizingAdvanced Digitizingsee Advanced digitizingAdvanced DigitizingMerge SelectedFeaturessee Advanced digitizingAdvanced DigitizingMerge Attr. ofSelected Featuressee Advanced digitizingAdvanced DigitizingNode Toolsee Digitizing an existing layerDigitizingRotate Point Symbolssee Advanced digitizingAdvanced DigitizingOffset CurvesSplit FeaturesViewMenu OptionShortcutReferenceToolbarPan MapMap NavigationPan Map to SelectionMap NavigationZoom InCtrl Map NavigationZoom OutCtrl -Map Navigationsee Select anddeselect featuresSelect ‣Identify FeaturesZoom FullAttributesCtrl Shift Isee MeasuringMeasure ‣AttributesMap NavigationCtrl Shift FMap NavigationZoom To LayerZoom To SelectionAttributesMap NavigationCtrl JZoom LastMap NavigationZoom NextMap NavigationZoom Actual SizeMap NavigationDecorations ‣see DecorationsAttributesMap Tips- 31 -
Menu OptionShortcutNew BookmarkCtrl BShow BookmarksCtrl Shift BRefreshCtrl RReferencesee SpatialBookmarkssee SpatialBookmarksToolbarAttributesAttributesMap NavigationLayerMenu OptionShortcutReferenceToolbarsee Creating new Vector layers Manage LayersNew ‣Embed Layers and Groups .see Nesting ProjectsCtrl Shift Vsee Working with Vector Data Manage LayersAdd Raster LayerCtrl Shift Rsee Loading raster data inQGISManage LayersAdd PostGIS LayerCtrl Shift Dsee PostGIS LayersManage LayersAdd SpatiaLite LayerCtrl Shift Lsee SpatiaLite LayersManage Layerssee label mssqlManage Layerssee Oracle GeoRaster PluginManage LayersAdd SQL Anywhere Layersee SQL Anywhere PluginManage LayersAdd WMS/WMTS Layer Ctrl Shift Wsee WMS/WMTS ClientManage LayersAdd WCS Layersee WCS ClientManage LayersAdd WFS Layersee WFS and WFS-T ClientManage LayersAdd Delimited Text Layersee Add Delimited Text Layer Manage LayersCopy stylesee Style MenuPaste stylesee Style MenuOpen Attribute Tablesee Working with the AttributeAttributesTableToggle Editingsee Digitizing an existing layer DigitizingSave Layer Editssee Digitizing an existing layerDigitizingCurrent Edits ‣see Digitizing an existing layerDigitizingAdd Vector LayerAdd MSSQL Spatial Layer Ctrl Shift MAdd Oracle GeoRasterLayer- 32 -
Menu OptionSave as.ShortcutSet CRS of Layer(s)ToolbarSee Working with the AttributeTableSave selection as vector file.Remove Layer(s)ReferenceCtrl DCtrl Shift CSet project CRS from LayerPropertiesQuery.LabelingCtrl Shift OManage LayersShow All LayersCtrl Shift UManage LayersHide All LayersCtrl Shift HManage LayersAdd to OverviewAdd All To OverviewRemove All FromOverviewPluginsMenu OptionShortcutManage and InstallPluginsReferenceToolbarsee Managing PluginsPython ConsoleGeocode‣see GRASS GIS IntegrationGRASS ‣GRASSOpenlayers Plugin‣VectorMenu OptionCoordinate Capture ‣ShortcutReferencesee Coordinate CapturePluginToolbarVectorDxf2Shp ‣see Dxf2Shp Converter Plugin VectorGPS ‣see GPS Plugin- 33 -Vector
Menu OptionShortcutReferenceOpen Street Map ‣see Loading OpenStreetMapVectorsRoad Graph ‣see Road Graph PluginSpatial Query ‣see Spatial Query PluginToolbarVectorVectorTopography Checker‣Analysis Tools‣Research Tools‣Reprocessing Tools ‣Geometry Tools‣Data management Tools ‣RasterMenu OptionRaster calculatorShortcutReferencesee Raster CalculatorToolbarGeoreferencer ‣see Georeferencer PluginRasterHeatmap ‣see Heatmap PluginRasterInterpolation ‣Terrain Analysissee Interpolation PluginRasterZonal Statistics ‣see Zonal Statistics Analysis‣DatabaseMenu OptionShortcutReferenceDatabaseDB Manager‣eVis ‣Toolbarsee eVis PluginDatabasesee SPIT PluginDatabaseOffline editing ‣Spit ‣Processing- 34 -
Menu OptionShortcutReferenceToolboxsee The toolboxGraphical Modelersee The graphical modelerHistory and Logssee The history managerOptions and configurationResults viewerCommanderCtrl Alt MToolbarToolboxsee Configuring theprocessing frameworksee Configuring externalapplicationssee The SEXTANTECommanderToolbarThe toolbar provides access to most of the same functions as the menus, plus additional toolsused when you are interacting with the map. Each toolbar item has “pop-up” help menusavailable. Hold your mouse selection tool over the item and a short description of the tool’spurpose will be displayed to guide you.Every menu bar can be moved around according to your needs. Additionally, every menubar can be switched off using your right mouse button, obtained by holding the mouse overthe toolbars and right clicking (read also Panels and Toolbars).Tip: Restoring toolbarsIf you have accidentally hidden all your toolbars, you can retrieve them by choosing menu optionSettings ‣ Toolbars ‣. If a toolbar disappears under Windows, which seems to be a problem inQGIS from time to time, you have to remove \HKEY CURRENT USER\Software\QGIS\qgis\UI\statein the registry. When you restart QGIS, the key is written again with the default state, and alltoolbars are visible again.Map Legend/Layer ListAll the layers in your project will be listed in the map legend. If you check the box in eachlegend entry, you can hide or reveal the layer of interest. You can drag around the layer onceyou select it to change the Z-ordering. Z-ordering means that layers listed nearer the top ofthe legend are shown on top of those below them in the legend. You can stop Z-ordering byclicking ‘Layer order’ on the panel.Your layers are organized into groups on the panel. This can be achieved in two ways:1. Right click in the legend window and choose Add Group. Next type the group name asyou choose it, then hit enter. Next, click on an existing layer and drag it onto thegroup – this will add it to the group you have named.2. With the other method, you can choose some layers, right click in the legend window,and select the option Group Selected. This will move the chosen layers into the newgroup automatically.- 35 -
To move a layer out of a group, you can either drag it out or right click and select ‘Make totop-level’ item. Groups can be nested inside other groups to create hierarchies.Remember: The checkbox for a group will show or hide all the layers in the group – this isdone with just one click. The content of the right mouse button context menu also dependson whether the selected legend item is a raster or a vector layer. For GRASS vector layers, Toggleeditingis not available. See sectionDigitizing and editing a GRASS vector layerfor information onediting GRASS vector layers.The right mouse button menu for raster layers reveals the followinginformation: Zoom to layer extent Zoom to Best Scale (100%) Stretch Using Current Extent Show in overview Remove Duplicate Set Layer CRS Set Project CRS from Layer Save as . Properties Rename Copy Style Add New Group Expand all Collapse all Update Drawing OrderAdditionally, according to layer position and selection Make to top level item Group SelectedRight mouse button menu for vector layers Zoom to Layer Extent Show in Overview Remove Duplicate Set Layer CRS Set Project CRS from Layer Open Attribute Table Toggle Editing (not available for GRASS layers) Save As . Save Selection As Filter Show Feature Count Properties Rename- 36 -
Copy StyleAdd New GroupExpand allCollapse allUpdate Drawing OrderAdditionally, according to layer position and selection Make to top-level item Group SelectedRight mouse button menu for layer groups Zoom to Group Remove Set Group CRS Rename Add New Group Expand all Collapse all Update Drawing OrderIt is possible to select more than one layer or group at the same time by holding down theControl (Ctrl) key while selecting the layers with the left mouse button. You can then moveall selected layers to a new group at the same time.You are also able to delete more than oneLayer or Group at once by selecting several Layers with the Ctrl key and pressing Ctrl Dafterwards. This way all selected Layers or groups will be removed from the layer’s list.Map ViewThis is the “core business” of QGIS - maps are displayed in this area. This is where you willdo most of your work. The types of maps you see here will depend on the vector and rasterlayers you have chosen to load. The map view can be panned (moved so your view changes)left and right (this shifts the focus so you can see different regions of the map) and zoomed inand out. A number of other operations can be done to your map, as described in the toolbarsection above. The map view and the legend are important to each other operationally - themaps in view reflect changes you make in the legend area.Tip: Zooming the Map with the Mouse WheelYou can use the mouse wheel to zoom in and out on the map. Place the mouse cursor insidethe map area and roll the wheel forward to zoom in or backwards to zoom out. You cancustomize the behavior of the mouse wheel zoom using the Map tools menu under the Settings‣ Options menu.Tip: Panning the Map with the Arrow Keys and Space BarThe arrow keys can be used to pan the map to the left or right, or up and down. Place themouse cursor inside the map area. Next click on the right arrow on the keyboard to pan East,- 37 -
or the left arrow key to pan West, or the up arrow key to pan North, and the down arrowkey to pan South. You can also pan the map using the space bar or the click on mouse wheelby moving the mouse while holding down space bar (or clicking on the mouse wheel).Status BarThe status bar shows you your current position on the map (indicated by where the mousecursor is) in map coordinates (e.g. meters or decimal degrees). As you move the mouse, thecoordinates change. On the left of the coordinate display in the status bar you will find abutton toggles between showing your coordinate position, or the view extent resulting whenyou pan in or out of the map.Just adjacent to the coordinate display is the scale display. This shows the scale of the map atthe view setting you have chosen (it will change as you zoom in or out). Take note of thescale selector that allows you to choose between predefined scales that range from 1:500 to1:1,000,000.The progress bar can be found in the status bar. This shows progress of rendering as youbring each successive layer into the map view. This can take some time with data heavy layers.If a new plugin or a plugin update is available for your QGIS, you will see a message that tellsyou so on the far right of the status bar. On the right side of the status bar is a small checkbox that can be used to temporarily stop layers being rendered into the map view (see SectionRendering below). The icon immediately stops the current map rendering process. This isuseful if you realize you accidently brought in the wrong layer.Just to the right of the rendering area you will find the EPSG code of the current projectCoordinate Reference System (CRS), and a projector icon. Click on it to open data on theprojection properties of the layer.Tip: Calculating the correct Scale of your Map CanvasDegrees is the default unit when you boot up QGIS. Hence, any layer you add willautomatically be projected in degrees To change or get your corrected scale values, you caneither change this setting to meters manually in the General tab under Settings ‣ ProjectProperties or, you can select a project CRS clicking on the CRS status icon in the lower righthand corner of the status bar. In the last case, the units are set to what the project projectionspecifies, e.g. ‘ units m’ for units as meters.For more information, please see:http://docs.qgis.org/2.2/en/docs/user manual/introduction/qgis gui.html- 38 -
Module 3: Loading Spatial Data and Visualization in QGISThe data set for this exercise is located in: MODULE 03\ Data\ directory:1. Upazila boundary of Bangladesh (polygon- BD UPZ GCS.shp)2. British Geological Survey (BGS) groundwater Arsenic data (point shape filebgs groundwater.shp)3. Road network maps of Bangladesh (BD road network.shp)4. Landsat-5 image for Bangladesh (LT51370442010030KHC00 B4.TIF)Vector DataIn this e
Introduction to basic GIS and spatial analysis using QGIS: Applications in Bangladesh . by Zia Uddin Ahmed, Timothy J. Krupnik and Mustafa Kamal. CIMMYT, the International Maize and Wheat Improvement Center is the global leader on publicly fundedmaize and wheat research and related farming systems. Headquartered near