Transcription
Geographic InformationSystems 101:Understanding GISJames WhitacreGIS SpecialistScholarly Commons
Instructor: James Whitacre GIS SpecialistScholarly Commons, Main Library at the University of Illinois at Urbana‐ChampaignPreviously: GIS ManagerCarnegie Museum of Natural History Master of Science in Geography, concentration in GIS andCartographyIndiana University of Pennsylvania Bachelor of Arts in ZoologyOhio Wesleyan University2
GIS at Scholarly Commons Provide GIS research services and consultation Provide GIS workshops and training Manage the University Library’s geospatial dataand GIS software resources Act as a central resource for the University’s GIScommunity and promote the use of GIS inresearch3
Learning Objectives Learn to think spatially about data and research Understand how to frame and ascertain researchquestions and methods using GIS Overview of different types of GIS software tools and data Overview of foundational geospatial concepts andanalyses Familiarity with GIS resources available for furtherinvestigation4
GIS WorkshopsCore Workshops Geographic Information Systems 101:Understanding GIS GIS for Research I: Tools, Concepts, andGeodata Management Discovering GIS Data GIS for Research II: Geoprocessing, Analysis,and Visualization5
GIS WorkshopsSpecial Topics ArcGIS Online and Story Maps ModelBuilder and Python in ArcGIS Field data collection techniques and Collectorfor ArcGIS Geocoding and georeferencing Spatial Analysis Techniques: Interpolation,Clusters, Statistics, and more Lidar and 3D mapping techniques6
What isGIS?Geographic InformationSystem or Science
Geographic Information Information aboutplaces and features onthe Earth's surface Knowledge about wheresomething is Knowledge about whatis at a given locationSource: Goodchild, M. F. 1997. “What is Geographic Information Science?, NCGIA Core Curriculum inGIScience”. Last modified October 7. ml.8
Geographic Information System Computer hardware and software Spatial information anddata(bases) Spatial and statistical analysis Geography and maps drive theunderlying concepts and theories Powerful tool that must behandled with care to not misuse itSources: Steinberg, Sheila L., and Steven J. Steinberg. GIS Research Methods: Incorporating Spatial Perspectives.Redlands, CA: Esri, 2015.Esri. 2014. “GIS ‐ GIS Dictionary”. Accessed August ionary/term/GIS.9
Geographic Information Science Research that studies the theory andconcepts that underpin GIS Establishes a theoretical basis for thetechnology and use of GIS Commonly an interdisciplinary approach toresearch and investigation Two forms:– Research about GIS that leads toimprovements in the technology– Research that uses GIS as a technology toolfor the advancement of scienceSources: Esri. 2014. “GIScience ‐ GIS Dictionary”. Accessed August ionary/term/GIScienceGoodchild, M. F. 1997. “What is Geographic Information Science?, NCGIA Core Curriculum in GIScience”. Last modified October htmlGoodchild, M.F. 2006. “Geographical information science: fifteen years later.” In Classics from IJGIS: Twenty years of the International Journalof Geographical Information Science and Systems, edited by P.F. Fisher, 199–204. Boca Raton: CRC Press.10
Think:Spatially
What is Spatial Thinking in Research? Applying geographic principlesof place, time, and distance Ability to conceptualizeresearch questions andmethods in light of place,distance, and time Ability to integrate differentforms of spatial data andexplore spatial patterns12
Why Think Spatially in Research? Contextualizes relationships, patterns,and connections in space and time Results in more holistic and realisticpicture of the data Enables better visualization,communication, and implementationof research Most data is spa al it can be ed orlinked to a specific location on theearth13
In Research Aren’t GPS CoordinatesGood Enough?14
GIS inResearch
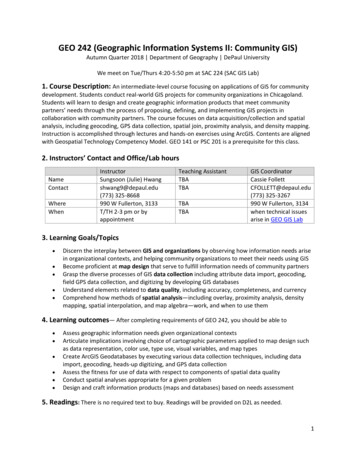
Who uses GIS in Research?Geography, Ecology, Environmental Sciences, Forest Science,Geology, Engineering, History, Archeology, Anthropology,Literature, Political Science, Business, Economics, Biology,Public Health, Medicine, Education, Public Administration,Agriculture, Urban Planning, Atmospheric Sciences, Libraryand Information Science, Journalism, Veterinary Medicine,Social Work, Criminology Image Source: Jensenius, Alexander Refsum. 2012. Disciplinarities: intra, cross, multi, inter, trans.Accesses 18 June 2015: 16
Advantages of Using GIS in Research Comprehensive approach toresearch problem solving– Quantitative– Qualitative Analyze large amounts of datain a spatial context and atdifferent scales Data management, analysis,and visualization tool all inone17
Framing Research for GIS Key in determining how GIS canor will be used in your research Requires concise researchquestions for what you want toaccomplish with GIS Analysis will influence researchquestion(s) Results or final product willinfluence research ataPresentGeospatialData18
GIS Maps,Software,and Data
What is a map? Symbolic and visual representation of a place Contains only selected characteristics or features Highlights spatial relationships of differentfeatures Usually drawn on a flat surface at a specific scale20
Print vs. Digital MapsPrint: Printed and viewed onpaper or other physicalmedia Static viewDigital: Viewed on a computeror projected screen Dynamic and Staticviews21
Maps in GISMap : Location Quantities Densities What is nearby What overlaps Change Map so much more!22
Desktop GIS SoftwareTraditional GIS SoftwareProprietary (usually not free) ArcGIS for Desktop TerrSet/IDRISI ERDAS IMAGINE MapInfo MicroStation AutoCAD Google Earth Pro*Free (usually open source) QGIS GRASS PostGIS MultiSpec ** SAGA uDig GeoDa Google Earth***Recently became free!**Not open source23
Web GIS SoftwareThe Future!GIS and MapServers ArcGIS forServer GeoServer MapServer OpenGeoSuite* OthersCloud GIS andMap Services ArcGIS Online Mapbox CartoDB GIS Cloud GeoCloud2 Others*Includes GeoServerWeb MappingAPIs ArcGIS API forJavaScript Google MapsAPI Leaflet OpenLayers Many others!24
Geospatial Data Where and what somethingis Can be shown on a map If data has location info (e.g.latitude and longitude,addresses, place names, etc.)it is geospatial data Examples include counties,streams, nesting locations,hillshades25
Layers Geospatial data is arranged by layerson a map in GIS Collection of similar or thematicgeographic features All features must be the same type ofdata (point, line, polygon, raster) andshare the same set of attribute types(or fields)In GIS software, layers: Define visualization or symbologyand other essential properties Do not store data, but reference (i.e.point to) data sources26
Geospatial Data ModelsTwo Basic Types: Vector Raster27
Vector Data A coordinate‐based data modelthat represents geographicfeatures as points, lines, andpolygons Point features represented as asingle coordinate pair Line and polygon featuresrepresented as ordered lists ofvertices Attributes are associated witheach vector feature28
Features Where something is A representation of a real‐world object on a maptranslated by a coordinate system Four main components– Shape or geometry Points ci es Lines rivers Polygons (areas) countries– Location: geographic coordinates– Symbol: shape, color, pattern, outline– Attributes: describes the feature29
Attribute Information What something is Describes features Stored as a data tableconnected to thefeatures Examples include citynames, stream length, orcountry population30
Shapefile Feature Classes Simple vector format withfeatures connected to dBASEformat table Stores location, shape, andattributes of point, line, orpolygon geographic features Requires at least three and upto 16 separate files stored insame workspace (i.e. folder)Sources: Esri. 2015. “What is a Shapefile”. Accessed June m.Wikipedia. 2015. “Shapefile” Accesed June 19. https://en.wikipedia.org/wiki/Shapefile.31
Geodatabase Feature Class Similar to a Shapefile, but withmore functionality Four common types: points,lines, polygons, andannotations Optimized for analysis withbetter storage efficiency andcapacity Stored in a Geodatabase32
Geodatabases Stores feature classes and various other GIS andnon‐GIS data types, including standalone tables,raster datasets, and many others Intended to replace Shapefiles as the primarynative format for ArcGIS Three formats/types in ArcGIS– File Geodatabase – stored in a files system folder– Personal Geodatabase – stored as MicrosoftAccess data files– Enterprise Geodatabase – stored in relationalDBMS such as Microsoft SQL Server, Oracle, orPostgreSQL Generally readable in other GIS software andother formats/types exist in open‐source sphere33
Raster Data A spatial data model that definesspace as an array of equally sizedcells arranged in rows andcolumns Can be composed of single ormultiple bands Each cell contains an attributevalue and location coordinates34
Raster Data Examples Digital ElevationModels Land Cover Aerial Imagery Scanned Maps35
Raster Data Formats TIFF JPEG, JPEG2000 MrSID ArcGIS GRID GeodatabaseRaster Many others!36
Should I Use Vector or Raster Data?Is your data Discrete or Continuous? Discrete– Individually distinguishable– Phenomenon does not exist between observationsex. lakes and roads Continuous– Gradual variation across a range of values– Values exists between observations, but maybe not alwaysmeasurableex. temperature and elevation Both Vector and Raster data can model discrete andcontinuous data, but – Vector data be er for discrete data– Raster data be er for con nuous data Decision also depends on the scale or resolution of data,analysis workflow, and tools available37
Data Measurement dNominalOrdinalLand UseRoad typeRelativeAbsoluteIntervalRatioContoursRain oubleHelpful resources: hp andhttps://en.wikipedia.org/wiki/Level of measurementAdapted from: Zeiler, M. and J. Murphy. 2010. Modeling Our World: The Esri Guide to GeodatabaseConcepts. Redlands, CA: ESRI Press.38
Is Contour Data Discrete or Continuous?Elevation Contours What is beingvisualized? Are Contoursvector or rasterdata?39
Web Map/Layer ServicesTwo basic types of web map services Allows GIS data to be served to the internet and viewed in a webbrowserTypically published from traditional GIS formats to the webFeature Layers Vector Published from vector datasetsIndividual feature attribute information is always accessibleCan be used for GIS analysis on the webTile Layers Raster (or Raster‐like) Pre‐drawn map images tiled to appear seamlessGood for fast map visualization over the webGood as basemaps to give geographic contextIndividual feature attribute information NOT ALWAYS accessible40
Web Map/Layer ServicesFeature ServiceTile Service41
Acquiring Spatial DataDownload or access data from the internet
Acquiring Spatial DataGeocodingProcess oftransforming adescription of alocation—such as apair of coordinates,an address, or aname of a place—toa location on theearth's surface
Acquiring Spatial DataData CollectionGPS or surveying techniques
Acquiring Spatial DataDigitizing Using GIS software tocreate vector data Trace features fromaerial images andscanned based mapsthat have beengeoreferenced
Geography andCartography Concepts
Space vs. Place Place – meaningful or important location; can beconceptual or real Space – distance between places Spatial – Related to or existing within space Geographic – Of or relating to earth space Geospatial – Catch all term that refers to everythingabove; usually used in the context of analysis ortechnology
Scale Maps cannot show features at their actual size Scale represents the reduction between themap and the real world
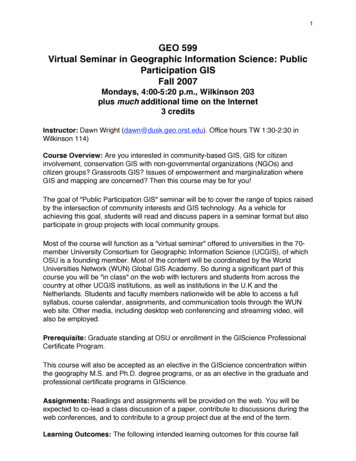
Small vs. Large Scale1:100,000 scale(small scale)1:24,000 scale(large scale)20 times no. of lines3 times total length of lines1:100,000 scale – 557 lines,1:24,000 scale – 11,338 lines,Total length 1890 kmTotal length 5559 km
Resolution In GIS and Remote Sensing: The real‐world dimensionsrepresented by each cell or pixel in a raster Example: 10 meters, 30 meters, 90 meters, etc.
ResolutionSource: http://www.geog.ucsb.edu/ html
Scale vs. ResolutionScale VectorResolu on Raster In general:Map Scale Denominator Raster resolution (in meters) * 2 * 1000 It is not good practice to perform analyses ondata intended for different scales/resolutionSource: Nagi, R. 2010. “On map scale and raster resolution”. Accessed September 25, on‐map‐scale‐and‐raster‐resolution/.
Coordinate Systems in GISTwo types in GIS: Geographic CoordinateSystems (GCS) Projected CoordinateSystems (PCS)
Geographic Coordinate Systems Based on a spheroidal model of theearth Reference lines are parallels(latitude) and meridians (longitude) Uses geographic coordinates andangular measurements (x,y – wherex is lon., y is lat) to define uniquepositions on the earth Defined primarily by a geographicdatum
Projected Coordinate Systems Portrays curved/spherical surface ofthe earth to planar or flat surface– Systematic mathematicaltransformation of the earth's lines oflongitude and latitude onto a plane– Uses length‐based units (m and ft) Introduces distortion of the mapdata, but designed to minimize:––––Distance EquidistantArea Equal areaShape ConformalDirec on Azimuthal
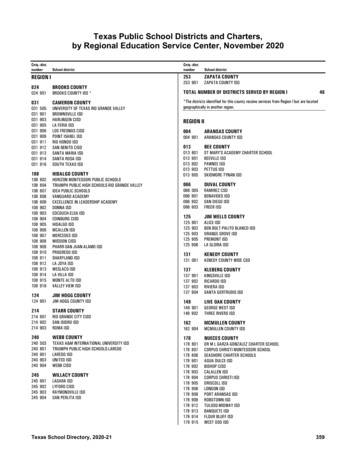
Projected Coordinate SystemsThree primary types:PlanarConicCylindrical Planar – surface istangent to the globe Conical – surfaceformed into a cone Cylindrical – surface isformed into a cylinder56
Why Coordinate Systems are Important57
Spatial Analysis and GeoprocessingSpatial Analysis Process of examining the locations,attributes, and relationships of features inspatial data through overlay and otheranalytical techniques Addresses questions to gain usefulknowledge by extracting or creating newinformation from spatial dataGeoprocessing Provide tools and framework for performingspatial analysis and managing geospatial data Allows for analysis workflows to beautomated
Spatial Analysis and GeoprocessingSpatial Measurements Coordinates Distance and Buffers Area
Spatial Analysis and GeoprocessingOverlays Intersect, Union, andSpatial Joins Clipping and ErasingIntersectUnion
Spatial Analysis and GeoprocessingSpatial Patterns Geographic Distribution Density and ClusterAnalysis Nearest NeighborAnalysis
Library GIS WorkshopsCore GIS Workshops Geographic Information Systems 101: Understanding GIS– Thurs. Feb. 4 and Fri. April 1, 2 – 3 pm, room 314 GIS for Research I: Tools, Concepts, and Geodata Management– Thurs. Feb. 11 and Fri. April 8, 2 – 4 pm, room 314 Discovering GIS Data– Thurs. Feb. 18 and Fri. April 15, 2 – 3 pm, room 314 GIS for Research II: Geoprocessing, Analysis, and Visualization– Thurs. Feb. 25 and Fri. April 22, 2 – 4 pm, room 314Special Topic GIS Workshops Forthcoming 62
Introductory Classes Geography and GIS Department––––GEOG 371: Spatial AnalysisGEOG 379: Introduction to GISGEOG 380: GIS II: Spatial Problem SolvingMany more Urban Planning– UP 418: GIS for Planners– UP 519: Advanced Applications of GIS Natural Resources and Environmental Sciences– NRES 454: GIS in Natural Resource Management– NRES 455: Advanced GIS for Natural Resource Planning63
Library Resources Scholarly Commons Data Services:– GIS data discovery and research services– GIS consultations by appointment– http://www.library.illinois.edu/sc/datagis Map Library:– Geospatial datasets, GIS reference books andjournals, aerial photos, paper maps, etc.– www.library.illinois.edu/max64
Questions?65
Thank You!James Whitacre, GIS SpecialistScholarly Commons,Room 306 University Libraryjvwhit@illinois.eduPlease feel free to contact me for furtherassistance.66
Learning Objectives Learn to think spatially about data and research Understand how to frame and ascertain research questions and methods using GIS Overview of different types of GIS software tools and data