Transcription
Example Book
Table of ContentsQI Macros Example Book 2021 by Jay ArthurQI Macros Overview 1The QI Macros Menu 1Submenus 1Help Menu 1Video Tutorials 1Free Online Training Resources 1Creating Charts With QI Macros 2Creating a Chart Using a Macro 2Create a Chart Using a Template 3Data Formatting Tips 4International, Inc.Developers of QI Macros 2696 S. Colorado Blvd., Suite 555Denver, CO 80222(888) 468-1537 or (303) 756-9144 (phone)(888) 468-1536 or (303) 753-3107 (fax)info@qimacros.comwww.qimacros.comQI Macros Wizards and Data Mining Tools 5Improvement Project Wizard 5PivotTable Wizard 6Word/Number Count Wizards 7Chart Wizard 8Control Chart Wizard 8Control Chart Templates Wizard 9Stat Wizard 10Paste Link/Paste Link Transpose 11Stack/Restack/Unstack 12All rights reserved. Permission to reprint quotes and excerpts in company or businessperiodicals (magazines or newsletters) is given and encouraged with the followingcredit line:"Reprinted from QI Macros Example Book by Jay Arthur (888) 468-1537 qimacros.com."Also by Jay Arthur:Breakthrough Improvement with QI Macros and Excel, McGraw Hill, 2014Lean Six Sigma Demystified, 2nd Edition, A Self Teaching Guide, McGraw Hill, 2011Lean Six Sigma for Hospitals, 2nd Edition, McGraw Hill, 2016Agile Process Innovation, Hacking Lean Six Sigma for Maximum Results, LifestarPublishing, 2019Free Resources: Download a fully functioning QI Macros 30-day trial: qimacros.com/trial QI Macros training resources: qimacros.com/free-resources QI Macros webinars: qimacros.com/lean-six-sigma-blog/upcoming-webinar Lean Six Sigma Yellow Belt training: qimacros.com/MoneybeltControl Charts Charts for Special Circumstances 32Capability Charts 38Box, Dot & Scatter Plot 47CUSUM Chart EWMA Chart Moving Average Chart Hotelling T2 Chart Levey Jennings Charts Capability Suite Histogram Cp Cpk (Normal) Histogram Features Frequency Histogram Weibull Histogram Capability Templates Six Sigma is a registered trade and service mark of Motorola, Inc.Box & Whisker Plot Dot Plot Rev: 06/2113Attribute Control Charts 13c Chart 13np Chart 13p Chart 14u Chart 14p’ and u’ Charts (Prime Charts) 15Variable Control Charts 16XmR Chart 16XbarR Chart 16XbarS Chart 17XmR Trend Chart 17XMedianR 18I-MR-R Chart 18Control Chart Templates 19Control Chart Dashboards 20Stability Analysis 21QI Macros Control Chart Rules 22The QI Macros Chart Menu 23Add Data to Existing Charts 23Add Target or Goal Lines to Control Charts 24Add Text to a Point on a Chart 24Process Change Wizard 25Show Process Change on a Control Chart 25Fix Control Limits 26Recalculate UCL/LCL 26Ghost or Delete Point 27Stability Analysis Options 28Show/Hide Rule Numbers 29Show/Hide Sigma Lines 29Skyline or Wave Limits 30Chart Format Tools 3032333435363839404344454748Multi Vari Chart Scatter Plot Matrix Plot Tornado Chart Values Plot 4849505151Improvement Charts and Diagrams 52Other Charts 58Statistical Tools 63Templates for Lean Six Sigma 75Pareto Chart Multiple Pareto Charts at Once Text Pareto Chart Nested Pareto Charts Fishbone Diagram Countermeasures Matrix Bland Altman Bullet Chart Stem and Leaf Plot Delta Chart Funnel Plot Kaplan-Meier Step Plot ROC Curve Speedometer Chart Youden Plot 525353545557585959606061616262ANOVA 63Single Factor 63Two Factor with Replication 64Two Factor without Replication 65Chi-Square (X2) 66F-Test 67Regression Analysis 68Equivalence Test 70t-Tests 71One-Sample 71Paired Two-Sample for Means 72Two-Sample Assuming Equal Variances 73Two-Sample Assuming Unequal Variances 74Stat Templates 74Lean Tools 75Flow Chart 75Time Tracking Tool 76Time Value Map 77Value Stream Map 78Spaghetti Diagram 79Diagrams 80Tree Diagram 80Arrow Diagram 81Relationship Diagram 82Calculators 83Sample Size Calculator 83DPMO Six Sigma Calculator 85Rolled Throughput Yield Calculator 85Improvement Tools 86Cause Effect Matrix 863 Legged 5 Whys Template 87Defect Tracking Matrix 88Hazard Analysis - Bow Tie RiskAssessment 91DOE, Gage R&R, FMEA 92Control Plan 92Design of Experiments 93FMEA - Failure Mode and Effects Analysis 95Gage R&R 96QFD House of Quality 100Planning and PM Tools 101Voice of the Customer Matrix 101Balanced Scorecard 102Your “Million Dollar Money Belt” Improvement Strategy 104
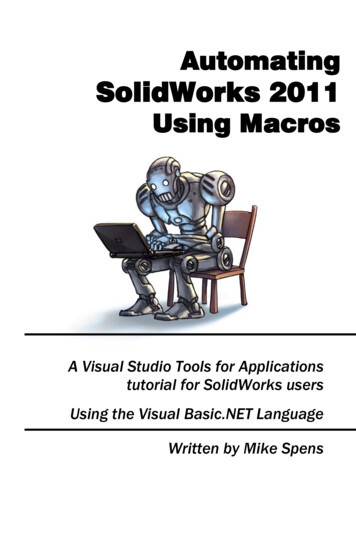
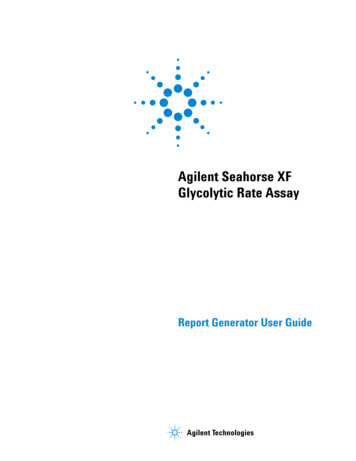
QI Macros OverviewCreating Charts With QI MacrosCreating a Chart Using a MacroThe QI Macros MenuAfter installation, the QI Macros menu appears as an additional Excel menu tab. QI Macros tools aredivided into several sections:1. Highlight your Excel data. (Refer to the Data Formatting Tipssection of this book for more information about setting up yourExcel data.)2. Select a chart from the QI Macros menu. If you areunsure about which control chart to run, select ControlChart Wizard.Submenus3. QI Macros performs the calculations and draws thechart.An arrow to the right of a menu itemindicates a sub-menu of additional tools.Help MenuAccess QI Macros Help from the Help & Training section on themenu to take a quick lesson, register your license, sign up formonthly newsletters, open sample data sets, and view free onlinetraining resources.Video TutorialsWatch how-to videos for most of the QI Macros m/training/videosFree Online Training ResourcesFurther explanations of the QI Macros tools described in this bookare available as free online videos, articles, and webinars:Note: QI Macros chart macros require you to highlight Excel dataprior to selecting them. If no data is selected, you will receive anerror oQI Macros Example Book 20211Section: QI Macros OverviewQI Macros Example Book 20212Section: QI Macros Overview
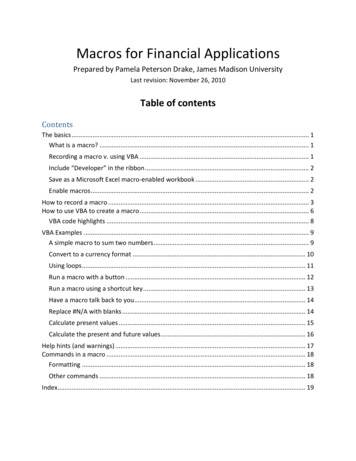
Create a Chart Using a TemplateThe QI Macros menu includes Stat Templates, Templates for Lean Six Sigma, Capability Templates,Control Chart Templates, a Fishbone template, and other Chart Templates.Data Formatting TipsMake sure to follow these guidelines when formatting your data.Format Labels as TextIf your labels are numbers, Excel treats them as part of your data. Labels in numeric format will notchart correctly.CorrectLabelFormats(text):The templates contain an input area for your data,and charts within these templates populate in realtime, as you enter your data.IncorrectLabelFormat(numeric):1. Select a template from the QI Macros menu.2. Type or paste your data into the yellow input area.To reformat numeric labels as text, type an apostrophe in front of each numeric label.Note: The format function in Excel will not reformat your labels as text.3. Template charts populate automatically.Format Data as NumbersYour data must be numeric and formatted as a number to perform the necessarycalculations. If you have data that is left justified or looks like 001, 002, 003 then it isformatted as text and the calculations may not run.Select the Right Number of ColumnsEach chart requires a certain number of data columns to run properly:Number of Columns1 column1 or more columns2 columns2 or more columnsType of ChartPareto, pie, run, c chart, np chart, XmR chartline, bar, histogramscatter, u chart, p chartbox & whisker, multi vari, XbarR chart, XbarS chartBeware of Hidden Rows or ColumnsIf your data selection includes any hidden rows and columns, QI Macros will include that hidden data.Hold the control key (Ctrl) to select data in non-adjacent rows or columns.Organize Data in ColumnsQI Macros works best if data samples are organized in vertical columns, not horizontal rows.Decimal PlacesFormat your data as numeric (1-6 decimal places) versus general (which has no precision).Sample DataFor examples of how to set up your data, or to practice running charts, select Open QI MacrosSample Data from the QI Macros help menu.Data input areaqimacros.com/training/videos/chart-templatesQI Macros Example Book ction: QI Macros OverviewQI Macros Example Book 20214Section: QI Macros Overview
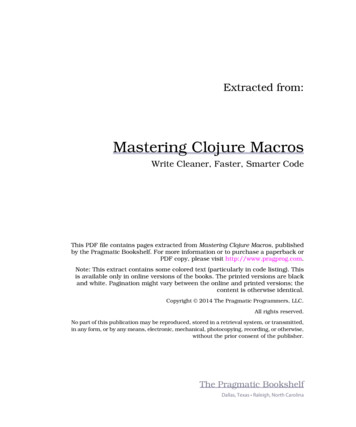
QI Macros Wizards and Data Mining ToolsPivotTable WizardImprovement Project WizardThe QI Macros PivotTable Wizard can quickly summarizelarge amounts of raw data.The Improvement Project Wizard (formerly Data MiningWizard) can quickly find the improvement project in largeamounts of data. It examines your data, summarizes it intoa pivot table, and creates control charts, Pareto charts, anda fishbone diagram.1. Make sure each column has a distinct heading. Checkfor misspellings or inconsistencies. Labels like "Hosp1"and "Hospital 1" are treated as two different values.(Tip: Use Excel's Find and Replace function to makethese consistent.)1. Make sure each column in your data sheet has aheading and that no blank rows or columns separate thedata you want in the pivot table.2. Highlight two column headings, preferably a date andcurrency, number or text.3. Select Improvement Project Wizard from the QI Macrosmenu.The Improvement Project Wizard: Summarizes your data in a pivot table Draws a control chart using the selected fields Draws Pareto charts using the remaining columns Creates a fishbone (Ishikawa) diagram from the “big bar” on thePareto Chart2. Click on one to four columns of data to include in the pivot table.3. Select the PivotTable Wizard from the Data Mining section of the QI Macros menu.4. The QI Macros PivotTable Wizard creates a pivot table for you based on the frequency of valuesin each column.Rearrange the pivot table as required, then highlight labels and data to draw QI Macros control chartsand Pareto el/data-mining-wizardQI Macros Example Book 20215Section: QI Macros Wizards and Data Mining ToolsQI Macros Example Book 20216Section: QI Macros Wizards and Data Mining Tools
"Reprinted from QI Macros Example Book by Jay Arthur (888) 468-1537 qimacros. com." Also by Jay Arthur: Breakthrough Improvement with QI Macros and Excel, McGraw Hill, 2014 Lean Six Sigma Demystified, 2nd Edition, A Self Teaching Guide, McGraw Hill, 2011 Lean Six Sigma for Hospitals, 2nd Edition, McGraw Hill, 2016