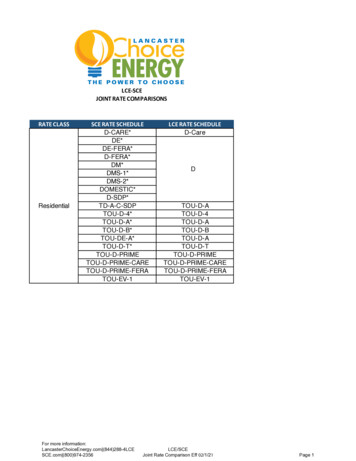
Transcription
Agilent Seahorse XFGlycolytic Rate AssayReport Generator User GuideAgilent Technologies
Notices Agilent Technologies, Inc. 2017WarrantyNo part of this manual may be reproducedin any form or by any means (includingelectronic storage and retrieval or translation into a foreign language) without prioragreement and written consent from Agilent Technologies, Inc. as governed byUnited States and international copyrightlaws.The material contained in this document is provided “as is,” and is subject to being changed, without notice,in future editions. Further, to the maximum extent permitted by applicablelaw, Agilent disclaims all warranties,either express or implied, with regardto this manual and any informationcontained herein, including but notlimited to the implied warranties ofmerchantability and fitness for a particular purpose. Agilent shall not beliable for errors or for incidental orconsequential damages in connectionwith the furnishing, use, or performance of this document or of anyinformation contained herein. ShouldAgilent and the user have a separatewritten agreement with warrantyterms covering the material in thisdocument that conflict with theseterms, the warranty terms in the separate agreement shall control.Manual Part NumberS7888-10008EditionFirst edition, March 2017Printed in USAAgilent Technologies, Inc. 2850 Centerville Road Wilmington, DE 19808-1610 USATechnology LicensesThe hardware and/or software described inthis document are furnished under alicense and may be used or copied only inaccordance with the terms of such license.Restricted Rights LegendIf software is for use in the performance ofa U.S. Government prime contract or subcontract, Software is delivered andlicensed as “Commercial computer software” as defined in DFAR 252.227-7014(June 1995), or as a “commercial item” asdefined in FAR 2.101(a) or as “Restrictedcomputer software” as defined in FAR52.227-19 (June 1987) or any equivalentagency regulation or contract clause. Use,duplication or disclosure of Software issubject to Agilent Technologies’ standardcommercial license terms, and non-DODDepartments and Agencies of the U.S. Government will receive no greater thanRestricted Rights as defined in FAR52.227-19(c)(1-2) (June 1987). U.S. Government users will receive no greater thanLimited Rights as defined in FAR 52.227-14(June 1987) or DFAR 252.227-7015 (b)(2)(November 1995), as applicable in anytechnical data.Safety NoticesCAUTIONA CAUTION notice denotes a hazard. It calls attention to an operating procedure, practice, or thelike that, if not correctly performedor adhered to, could result in damage to the product or loss ofimportant data. Do not proceedbeyond a CAUTION notice until theindicated conditions are fullyunderstood and met.WA R N I N GA WARNING notice denotes ahazard. It calls attention to anoperating procedure, practice, orthe like that, if not correctly performed or adhered to, could resultin personal injury or death. Do notproceed beyond a WARNINGnotice until the indicated conditions are fully understood and met.
ContentsIntroductionParameter Calculations6Agilent Seahorse XF Report Generator OverviewHow ToConfigure Microsoft Excel to Enable MacrosAnalyze Data in the Report GeneratorSave a Summary ReportError Bar CalculationsAdvanced OptionsInduced Assays101113141516Exclude Outliers/Groups from AnalysisNormalize Assay Results1819Frequently Asked QuestionsFeedback22Agilent XF Glycolytic Rate Assay Report Generator User Guide3
4Agilent XF Glycolytic Rate Assay Report Generator User Guide
Agilent Seahorse XF Glycolytic Rate AssayReport Generator User Guide1IntroductionParameter Calculations 6The Agilent Seahorse XF Glycolytic Rate Assay providesaccurate measurements of glycolytic rates for basal conditionsand compensatory glycolysis following mitochondrial inhibition(Figure 1). The calculated glycolytic rates accounts forcontribution of CO2 to extracellular acidification derived frommitochondrial/TCA cycle activity, and are directly comparableto lactate assays.Figure 1Agilent Seahorse XF Glycolytic Rate Assay parameters andkinetic profile.Agilent Technologies5
IntroductionThe Agilent Seahorse XF Glycolytic Rate Assay ReportGenerator is a Microsoft Excel Macro that automaticallyconverts experimentally-derived OCR and ECAR data intoGlycolytic Proton Efflux Rate (glycoPER), reported in pmolH /min (Table 1). Figures and data tables in the ReportGenerator can be easily transferred to other software programsfor additional graphing or statistical analysis. The Seahorse XFGlycolytic Rate Assay Report Generator supports assay resultdata generated by Agilent Seahorse XFe96, XFe24, XFp andXF96 Analyzers.Parameter CalculationsTable 1 outlines the parameter calculations performed in theSeahorse XF Glycolytic Rate Assay Report Generator. Eachparameter value calculated represents the average of individualwell calculations for each assay group on the plate map. Errorbars are calculated based on the individual well calculations foreach parameter.Table 1Agilent Seahorse XF Glycolytic Rate Assay parameters equations (no induced assay).Parameter nameParameter equationBasal GlycolysisLast glycoPER measurement before first injection.Basal Proton Efflux Rate (PER)Last PER measurement before first injection.% PER from Glycolysis (Basal)(Basal Glycolysis)/(Basal PER) x 100%Compensatory GlycolysisMaximum glycoPER measurement after Rot/AA injection.mitoOCR/glycoPER (Basal)[(Last OCR measurement before first injection) - (Minimum OCRafter Rot/AA injection)] /(Basal Glycolysis)Post 2-DG acidificationMinimum glycoPER measurement after 2-DG injection.Note: Definitions of PER and glycoPER can be found in theAgilent Seahorse XF Glycolytic Rate Assay Kit User Guide.Additional parameters are reported for an induced Seahorse XFGlycolytic Rate Assay in the section called Induced Assays.6Agilent XF Glycolytic Rate Assay Report Generator User Guide
Agilent Seahorse XF Glycolytic Rate AssayReport Generator User Guide2Agilent Seahorse XF Report GeneratorOverviewThe Seahorse XF Glycolytic Rate Assay Report Generatordisplays result data and other assay-related information on thefour or five tabs described below.For the optimal Report Generator data analysis experience,update to Wave 2.3. Summary printout: One-page Summary Report of the importedAgilent Seahorse XF Glycolytic Rate Assay data plotted asbar charts. Normalize: Plate map of normalization values applied in theimported result file. This tab is only displayed for result filesthat have been normalized in Wave 2.3 before Excel export.See the Wave User Guide for more info. Note: Assay result data that has not been normalized inWave 2.3 will not be display the Normalize tab. Measures sheet: Rate data plotted as kinetic graphs of ECAR,PER, OCR, and glycoPER, table of assay parameters anddata table of measurement values for the kinetic graph. Assay parameter per well: Data table of assay parameters perwell for each group in the imported file. Project information: Software License Terms, plate map layoutdisplaying group positions, excluded wells, and otherimportant assay-related information.Agilent Technologies7
Agilent Seahorse XF Report Generator Overview8Agilent XF Glycolytic Rate Assay Report Generator User Guide
Agilent Seahorse XF Glycolytic Rate AssayReport Generator User Guide3How ToConfigure Microsoft Excel to Enable Macros 10Analyze Data in the Report Generator 11Save a Summary Report 13Error Bar Calculations 14Advanced Options 15Induced Assays 16Exclude Outliers/Groups from Analysis 18Normalize Assay Results 19The following sections describe how to perform routinefunctions in the Report Generator: Analyze Data in the Report Generator Save a Summary Report Normalize Assay Results Exclude Outlier WellsAgilent Technologies9
How ToConfigure Microsoft Excel to Enable MacrosThe Seahorse XF Glycolytic Rate Assay Report Generator is aMicrosoft Excel Macro-Enabled Template and is compatible withMicrosoft Excel versions 2010, 2013, and 2016 for Windows PCs,and Microsoft Excel for Mac versions 2011 and 2015. To use thisReport Generator, Excel must be configured to allow macros torun. To enable macros once, double-click the Seahorse XFGlycolytic Rate Assay Report Generator.xltm file, then click EnableEditing and Enable Content (yellow information bar) if prompted(Figure 2).Figure 2Enable macros using the Enable Editing button as seen on the yellow information bar. This needs tobe performed once upon opening the Agilent Seahorse XF Glycolytic Rate Assay Report Generator forthe first time after download.To always enable macros (recommended for the best experienceusing Report Generators):101Open Microsoft Excel.2Click File, then click Options.3Click Trust Center, then click Trust Center Settings.4Click Macro Settings.5Select Enable all macros.Agilent XF Glycolytic Rate Assay Report Generator User Guide
How ToAnalyze Data in the Report GeneratorImport Excel file1Open the result file in Wave 2.3, then click Export.2Select Microsoft Excel and click Save (Figure 3). Optional: Modify the default file name, and save location.3Download the Seahorse XF Glycolytic Rate Assay ReportGenerator from the Agilent website: -(seahorse)/seahorse-xf-report-generators.4Unzip the compressed folder, and double-click the filecalled: Seahorse XF Glycolytic Rate Assay ReportGenerator.xltm.5Click Load New Data File.6Locate the Microsoft Excel file (exported from Wave 2.3),and click Open.Figure 3Highlighting the Excel export in the list of Wave 2.3 (Desktop &Controller) export options.Agilent XF Glycolytic Rate Assay Report Generator User Guide11
How ToSelect Groups and Display ResultsAfter assay result data has been imported to the ReportGenerator, use the Display Options dialogue window to selectgroups from the assay to display, and click Update Summary(Figure 4). The Report Generator will automatically calculatethe parameters for each group selected and display results onthe Summary Printout tab.Figure 4The Display Options window in the Report Generator showinggroups for selection. Group names must be configured inWave 2.3 before exporting to Excel.Error Bar TypeStandard Deviation is selected as the default Error Bar Type forALL graphs. The Error Bar Type applies to all graphs in the ReportGenerator.12Agilent XF Glycolytic Rate Assay Report Generator User Guide
How ToSave a Summary ReportSave/Save as1Click the Save icon (small floppy disc) to display the Save asfunction.2Select a file location, and enter a custom file name ifdesired.The saved Summary Report can be re-opened to view thecalculated parameters for the selected groups,format/customize the appearance of graphs and figures, orselect new groups from the assay to run through the ReportGenerator. The Report Generator default file type is a MicrosoftExcel Macro-Enabled Template (*.xltm) - this file cannot beoverwritten.Save As - Excel WorkbookUse the Save As function to save the customized SummaryReport as an Excel Workbook file format (*.xlsx).Save As - PDFUse the Save As function to save the customized SummaryReport as a PDF file format (*.pdf).Note: Saving the Report Generator as an Excel workbook or anyother file type than the default file type (Excel Macro: *.xlsm)will render the Report Generator macro inoperable - modifyingthe groups selected or importing additional assay result data isnot supported as an Excel Workbook file type.Agilent XF Glycolytic Rate Assay Report Generator User Guide13
How ToError Bar CalculationsError Bar Type is a universal setting and applies to ALL graphsand charts in the Report Generator. Standard Deviation is thedefault error bar type. To change the error bar type to StandardError of the Mean (S.E.M.), click Edit Current Group Selection andselect Standard Error. Error bars are calculated from each replicate of the ratemeasurement used to determine the assay parameter(Table 1 on page 6, and Table 2 on page 17). Standard deviation is calculated using the Microsoft Excelfunction. S.E.M. is calculated using the equation:14Agilent XF Glycolytic Rate Assay Report Generator User Guide
How ToAdvanced OptionsAdvanced Options (Figure 5) can be accessed by clickingAdvanced on the Display Options window. The Advanced Optionsdisplays the Buffer Factor and CO2 Contribution Factor pergroup, which are automatically imported from Wave 2.3. Forassays performed using the recommended Seahorse XFGlycolytic Rate Assay Medium formula, there is no need tomodify the Buffer Factor. The CO2 Contribution Factor shouldonly be adjusted after assessing results from your first SeahorseXF Glycolytic Rate Assay. See the Buffer Factor Protocol UserGuide or the CO2 Contribution Factor Protocol User Guide formore information.Figure 5Editable fields for Buffer Factor and CO2 Contribution Factor(C.C.F.) displayed in Advanced Options.Agilent XF Glycolytic Rate Assay Report Generator User Guide15
How ToInduced AssaysA Seahorse XF Glycolytic Rate Assay with an acute injection iscalled an induced assay. An acute injection is an injection thatoccurs following the baseline measurements but before theRotenone/Antimycin A (Rot/AA) injection, The Seahorse assaytemplate called XF Glycolytic Rate Assay (Induced Assay) isspecifically designed for this type of assay. For custom assays,the acute injection must be manually added to the InstrumentProtocol prior to starting the assay. The acute injection must be injected before Rot/AA fromPort A on the cartridge. The Report Generator automatically displays an additionalfield on the Display Options window called InjectionMapping (Figure 6). The acute injection must be identifiedusing the Injection Mapping drop-down menu beforegenerating a Summary Report. If None is selected, theposition of the Rot/AA injection must be assigned.Figure 6Injection Mapping drop-down menu is displayed afterimporting an assay result file with more than two injections.After identifying the acute injection, the Report Generatorautomatically assigns the Rot/AA and 2-DG injectionssequentially. The Report Generator will report additional assayparameters for an induced assay. Parameter names andequations are displayed in Table 2 on page 17.16Agilent XF Glycolytic Rate Assay Report Generator User Guide
How ToTable 2Agilent Seahorse XF Glycolytic Rate Assay (Induced) parameter equationsParameter nameParameter equationInduced GlycolysisAverage of the glycoPER measurements after the induced assayinjection and before Rot/AA injection.Induced PERAverage of the PER measurements after the induced assay injection andbefore next injection.% PER from Glycolysis (Induced)(Induced Glycolysis)/(Induced PER) x 100%Induced mitoOCR*(Average of the OCR measurements after induced injection and beforenext injection) - (Minimum OCR after Rot/AA injection)mitoOCR/glycoPER (Induced)(Induced mitoOCR)/(Induced Glycolysis)* Induced mitoOCR is not reported separately in the Agileny Seahorse XF Glycolytic Rate Assay Report Generator.Agilent XF Glycolytic Rate Assay Report Generator User Guide17
How ToExclude Outliers/Groups from AnalysisIndividual assay wells or entire groups/conditions can beexcluded from parameter calculations in the Report Generator.Before exporting data from Wave 2.3, click the assay well(s) onthe plate map, or double-click the group name(s) on the GroupList to exclude those wells or groups from data export. TheProject Information tab displays the plate map layout and anyassay wells or groups that have been excluded from the Excelexport (Figure 7).Figure 718XFp Plate Map on the Project Information tab. Assay well Chas been turned off in Wave 2.3 prior to export, therefore theControl group parameter calculations are based on assay wellsB and D only.Agilent XF Glycolytic Rate Assay Report Generator User Guide
How ToNormalize Assay ResultsIt is highly recommended to analyze rate data that has beennormalized to a cellular parameter as opposed tonon-normalized, raw rate data. Normalization data must beadded to the Normalize view in Wave 2.3 (Figure 8) before export- normalized rate data is used for parameter calculations, anddisplayed by default in all kinetic graphs and bar charts in theReport Generator. Click the Normalize tab to view thenormalization plate map, unit, and scale factor as entered inWave 2.3 (Figure 9 on page 20). Use the Normalize button on theSummary Printout page to toggle the data displayed on eachchart between normalized and non-normalized rate data(Figure 10 on page 20).Figure 8Example of a normalization plate map for the Agilent SeahorseXFp Analyzer in Wave 2.3.Agilent XF Glycolytic Rate Assay Report Generator User Guide19
How ToFigure 9The same normalization plate map from Wave 2.3 (Figure 8)displayed in the Agilent Seahorse XF Glycolytic Rate AssayReport Generator.Figure 10 Normalize button on the Summary Printout tab. By default,normalized rate data exported from Wave will be displayed asindicated by the Normalize ON button status (green). Click theNormalize ON button to toggle the data display to shownon-normalized rate data (Normalize OFF - red). Data exportedfrom Wave 2.3 without normalized rate data shows a grayNormalize button.Note: To preserve data integrity between Wave 2.3 and ReportGenerators, normalized data exported to a Report Generator islocked for editing. To modify the normalization values used inthe Report Generator, they first must be edited in Wave 2.3 andthen re-exported to the Report Generator. If the result data hasnot been normalized, the Report Generator will not display theNormalize tab.20Agilent XF Glycolytic Rate Assay Report Generator User Guide
Agilent Seahorse XF Glycolytic Rate AssayReport Generator User Guide4Frequently Asked QuestionsWhat rate measurements are used to calculate the parameters inthis Report Generator?Parameter equations are described in Table 1 on page 6 andTable 2 on page 17 of this User Guide.How do I remove outlier wells in the Report Generator?Outlier assay wells must be turned OFF or reassigned inWave 2.3 prior to Excel export. See the Exclude Outliers/Groupssection from Analysis, or the Wave User Guide for moreinformation.Can I use the Excel file exported from the XFp or XF96 Analyzer?Excel files exported from earlier versions of Wave (Desktop orController) and XF96/XF24 software are not compatible. If theExcel file has been exported from Wave but cannot be importedto the Report Generator, please contact Agilent SeahorseTechnical Support.If you receive an error message about Instrument Protocol (XFe96;XFe24; XF96 only)Custom Cycles are not part of the standardized assay templatefor the Seahorse XF Glycolytic Rate Assay and not supported inReport Generator analysis. A Custom Cycle refers to anadditional 'Mix' or 'Wait' command step in the InstrumentProtocol an assay. Please contact Agilent Seahorse TechnicalSupport if you have any additional questions regarding CustomCycles.Can I use baseline rate data (%) to calculate assay parameters?Normalized (or non-normalized) ECAR data is used forparameter calculations, parameter calculations using baselinerate data (%) is not supported at this time.Agilent Technologies21
Frequently Asked QuestionsWarning message(s) when the % PER from Glycolysis is less than50% and less than 10%When the % of PER from Glycolysis for a selected group is lessthan 50% or less than 10%, the Report Generator displays awarning message in the legend on the Summary Printout tab(below the Normalize button). For more information, see theAdvanced Options section.How do I analyze multiple result files in a Report Generator?The Seahorse XF Glycolytic Rate Assay Report Generatorenables the import and analysis of individual XF Glycolytic RateAssay result files. Import and analysis of multiple result files inthis Report Generator is not supported at this time.FeedbackFeedback for the Report Generator or other products is alwaysencouraged. Please direct any questions, concerns orsuggestions to Agilent Seahorse Technical Support at:seahorse.support@agilent.com22Agilent XF Glycolytic Rate Assay Report Generator User Guide
Agilent Technologies Agilent Technologies, Inc.For Research Use Only. Not for use in diagnostic procedures.Printed in USA, March 2017*S7888-10008*S7888-10008
To always enable macros (recommended for the best experience using Report Generators): 1 Open Microsoft Excel. 2 Click File, then click Options. 3 Click Trust Center, then click Trust Center Settings. 4 Click Macro Settings. 5 Select Enable all macros. Figure 2 Enable macros using the Enable Editing button as seen on the yellow information bar .