Transcription
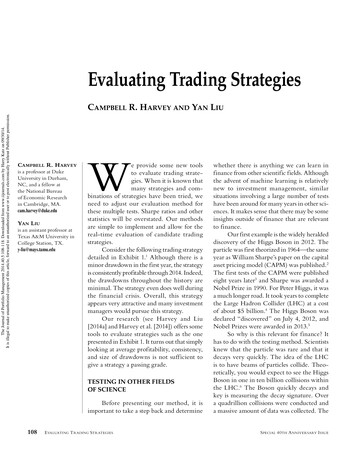
Evaluating Trading StrategiesThe Journal of Portfolio Management 2014.40.5:108-118. Downloaded from www.iijournals.com by Harry Katz on 09/30/14.It is illegal to make unauthorized copies of this article, forward to an unauthorized user or to post electronically without Publisher permission.CAMPBELL R. HARVEY AND YAN LIUCAMPBELL R. H ARVEYis a professor at DukeUniversity in Durham,NC, and a fellow atthe National Bureauof Economic Researchin Cambridge, MA.cam.harvey@duke.eduYAN LIUis an assistant professor atTexas A&M University inCollege Station, TX.y-liu@mays.tamu.eduWe provide some new toolsto evaluate trading strategies. When it is known thatmany strategies and combinations of strategies have been tried, weneed to adjust our evaluation method forthese multiple tests. Sharpe ratios and otherstatistics will be overstated. Our methodsare simple to implement and allow for thereal-time evaluation of candidate tradingstrategies.Consider the following trading strategydetailed in Exhibit 1.1 Although there is aminor drawdown in the first year, the strategyis consistently profitable through 2014. Indeed,the drawdowns throughout the history areminimal. The strategy even does well duringthe financial crisis. Overall, this strategyappears very attractive and many investmentmanagers would pursue this strategy.Our research (see Harvey and Liu[2014a] and Harvey et al. [2014]) offers sometools to evaluate strategies such as the onepresented in Exhibit 1. It turns out that simplylooking at average profitability, consistency,and size of drawdowns is not sufficient togive a strategy a passing grade.TESTING IN OTHER FIELDSOF SCIENCEBefore presenting our method, it isimportant to take a step back and determine108EVALUATING T RADING STRATEGIESwhether there is anything we can learn infinance from other scientific fields. Althoughthe advent of machine learning is relativelynew to investment management, similarsituations involving a large number of testshave been around for many years in other sciences. It makes sense that there may be someinsights outside of finance that are relevantto finance.Our first example is the widely heraldeddiscovery of the Higgs Boson in 2012. Theparticle was first theorized in 1964—the sameyear as William Sharpe’s paper on the capitalasset pricing model (CAPM) was published.2The first tests of the CAPM were publishedeight years later3 and Sharpe was awarded aNobel Prize in 1990. For Peter Higgs, it wasa much longer road. It took years to completethe Large Hadron Collider (LHC) at a costof about 5 billion.4 The Higgs Boson wasdeclared “discovered” on July 4, 2012, andNobel Prizes were awarded in 2013.5So why is this relevant for finance? Ithas to do with the testing method. Scientistsknew that the particle was rare and that itdecays very quickly. The idea of the LHCis to have beams of particles collide. Theoretically, you would expect to see the HiggsBoson in one in ten billion collisions withinthe LHC.6 The Boson quickly decays andkey is measuring the decay signature. Overa quadrillion collisions were conducted anda massive amount of data was collected. TheSPECIAL 40 TH A NNIVERSARY ISSUE
EXHIBIT 1The Journal of Portfolio Management 2014.40.5:108-118. Downloaded from www.iijournals.com by Harry Katz on 09/30/14.It is illegal to make unauthorized copies of this article, forward to an unauthorized user or to post electronically without Publisher permission.A Candidate Trading StrategySource: AHL Research.problem is that each of the so-called decay signaturescan also be produced by normal events from knownprocesses.To declare a discovery, scientists agreed to whatappeared to be a very tough standard. The observedoccurrences of the candidate particle (Higgs Boson) hadto be five standard deviations different from a worldwhere there was no new particle. Five standard deviations is generally considered a tough standard. Yet infinance, we routinely accept discoveries where the t-statistic exceeds two—not five. Indeed, there is a hedgefund called Two Sigma.Particle physics is not alone in having a tougherhurdle to clear. Consider the research done in biogenetics. In genetic association studies, researchers try tolink a certain disease to human genes and they do this bytesting the causal effect between the disease and a gene.Given that there are more than 20,000 human genes thatare expressive, multiple testing is a real issue. To make iteven more challenging, a disease is often not caused bySPECIAL 40 TH A NNIVERSARY ISSUEa single gene but the interactions among several genes.Counting all the possibilities, the total number of testscan easily exceed a million. Given this large number oftests, a tougher standard must be applied. With the conventional thresholds, a large percentage of studies thatdocument significant associations are not replicable.7To give an example, a recent study in Nature claimsto find two genetic linkages for Parkinson’s disease.8About a half a million genetic sequences are tested for thepotential association with the disease. Given this largenumber of tests, tens of thousands of genetic sequenceswill appear to affect the disease under conventional standards. We need a tougher standard to lower the possibility of false discoveries. Indeed, the identified gene locifrom the tests have t-statistics that exceed 5.3.There are many more examples such as the searchfor exoplanets. However, there is a common theme inthese examples. A higher threshold is required becausethe number of tests is large. For the Higgs Boson, therewere potentially trillions of tests. For research in bioge-THE JOURNAL OF PORTFOLIO M ANAGEMENT109
netics, there are millions of combinations. With multipletests, there is a chance of a f luke finding.The Journal of Portfolio Management 2014.40.5:108-118. Downloaded from www.iijournals.com by Harry Katz on 09/30/14.It is illegal to make unauthorized copies of this article, forward to an unauthorized user or to post electronically without Publisher permission.REVALUATING THE CANDIDATE STRATEGYLet’s return to the candidate trading strategydetailed in Exhibit 1. This strategy has a Sharpe ratio of0.92. There is a simple formula to translate the Sharperatio into a t-statistic:9T-statistic Sharpe Ratio Number of yearsIn this case, the t-statistic is 2.91. This means thatthe observed profitability is about three standard deviations from the null hypothesis of zero profitability. Athree-sigma event (assuming a normal distribution) happens only 1% of the time. This means that the chancethat our trading strategy is a false discovery is less than1%.However, we are making a fundamental mistakewith the statistical analysis. The statement about the falsediscovery percentage is conditional on an independenttest. This means there is a single test. That is unlikely tobe the case in our trading strategy and it was certainlynot the case with the research conducted at the LHC,where there were trillions of tests. With multiple tests,we need to adjust our hurdles for establishing statisticalsignificance. This is the reason why the researchers atLHC used a five-sigma rule. This is the reason whybiomedical researchers routinely look for four-sigmaevents.Multiple testing is also salient in finance—yet littlehas been done to adjust the way that we conduct our tests.Exhibit 2 completes the trading strategy example.10Each of the trading strategies in Exhibit 2 was randomly generated at the daily frequency. We assumed anannual volatility of 15% (about the same as the S&P 500)and a mean return of zero. The candidate trading strategyEXHIBIT 2200 Randomly Generated Trading StrategiesSource: AHL Research.110EVALUATING T RADING STRATEGIESSPECIAL 40 TH A NNIVERSARY ISSUE
The Journal of Portfolio Management 2014.40.5:108-118. Downloaded from www.iijournals.com by Harry Katz on 09/30/14.It is illegal to make unauthorized copies of this article, forward to an unauthorized user or to post electronically without Publisher permission.highlighted in Exhibit 1 is the best strategy in Exhibit 2(dark red curve).To be clear, all of the strategies in Exhibit 2are based on random numbers—not actual returns.Although the candidate trading strategy in Exhibit 1seemed very attractive, it was simply a f luke. Yet theusual tools of statistical analysis would have declared thisstrategy “significant.” The techniques we will offer inthis article will declare the candidate strategy, with theSharpe ratio of 0.92, insignificant.It is crucial to correct for multiple testing. Consider a simple example that has some similarities to thisexample. Suppose we are interested in predicting Y. Wepropose a candidate variable X. We run a regression andget a t-statistic of 2.0. Assuming that no one else hadtried to predict Y before, this qualifies as an independenttest and X would be declared significant at the 5% level.Now let’s change the problem. Suppose we still wantto predict Y. However, now we have 20 different Xvariables, X1, X 2, ,X 20. Suppose one of these variablesachieves a t-statistic of 2.0. Is it really a true predictor?Probably not. By random chance, when you try so manyvariables, one might work.Here is another classic example of multiple tests.Suppose you receive a promotional email from an investment manager promoting a stock. The email asks you tojudge the record of recommendations in real time. Onlya single stock is recommended and the recommendationis either long or short. You get an email every week for10 weeks. Each week the manager is correct. The trackrecord is amazing because the probability of such anoccurrence is very small (0.510 0.000976). Conventional statistics would say there is a very small chance(0.00976% this is a false discovery, that is, the manageris no good). You hire the manager.Later you find out the strategy. The manager randomly picks a stock and initially sends out 100,000 emailswith 50% saying long and 50% saying short. If the stockgoes up in value, the next week’s mailing list is trimmedto 50,000 (only sending to the long recommendations).Every week the list is reduced by 50%. By the end of thetenth week, 97 people would have received this amazingtrack record of 10 correct picks in a row.If these 97 people had realized how the promotion was organized, then getting 10 in a row would beexpected. Indeed, you get the 97 people by multiplying100,000 0.510. There is no skill here. It is random.SPECIAL 40 TH A NNIVERSARY ISSUEThere are many obvious applications. One that isimmediate is in the evaluation of fund managers. Withmore than 10,000 managers, you expect some to randomly outperform year after year.11 Indeed, if managerswere randomly choosing strategies, you would expectat least 300 of them to have five consecutive years ofoutperformance.Our research offers some guidance on handlingthese multiple-testing problems.TWO VIEWS OF MULTIPLE TESTINGThere are two main approaches to the multipletesting problem in statistics. They are known as thefamily-wise error rate (FWER) and the false discoveryrate (FDR). The distinction between the two is veryintuitive.In the family-wise error rate, it is unacceptable tomake a single false discovery. This is a very severe rulebut completely appropriate for certain situations. Withthe FWER, one false discovery is unacceptable in 100tests and equally as unacceptable in 1,000,000 tests. Incontrast, the false discovery rate views unacceptable interms of a proportion. For example, if one false discoverywere unacceptable for 100 tests, then 10 are unacceptable for 1,000 tests. The FDR is much less severe thanthe FWER.Which is the more appropriate method? It dependson the application. For instance, the Mars One foundation is planning a one-way manned trip to Mars in 2024and has plans for many additional landings.12 It is unacceptable to have any critical part fail during the mission.A critical failure is an example of a false discovery (wethought the part was good but it was not—just as wethought the investment manager was good but she wasnot).The best-known FWER test is called the Bonferroni test. It is also the simplest test to implement. Supposewe start with a two-sigma rule for a single (independent)test. This would imply a t-ratio of 2.0. The interpretation is that the chance of the single false discovery is only5% (remember a single false discovery is unacceptable).Equivalently, we can say that we have 95% confidencethat we are not making a false discovery.Now consider increasing the number of tests to 10.The Bonferroni method adjusts for the multiple tests.Given the chance that one test could randomly show upas significant, the Bonferroni requires the confidenceTHE JOURNAL OF PORTFOLIO M ANAGEMENT111
The Journal of Portfolio Management 2014.40.5:108-118. Downloaded from www.iijournals.com by Harry Katz on 09/30/14.It is illegal to make unauthorized copies of this article, forward to an unauthorized user or to post electronically without Publisher permission.level to increase. Instead of 5%, you take the 5% anddivide by the number of tests, that is, 5%/10 0.5%.Again equivalently, you need to be 99.5% confidentwith 10 tests that you are not making a single false discovery. In terms of the t-statistic, the Bonferroni requiresa statistic of at least 2.8 for 10 tests. For 1,000 tests, thestatistic must exceed 4.1.However, there are three issues with the Bonferroni test. First, there is the general issue about the FWERerror rate versus FDR. Evaluating a trading strategy isnot a mission to Mars. Being wrong could cost you yourjob and money will be lost—but it is unlikely a matter oflife and death. However, reasonable people may disagreewith this view.The second issue is related to correlation amongthe tests. There is a big difference between trying 10variables that are all highly correlated and 10 variablesthat are completely uncorrelated. Indeed, at the extreme,if the 10 tests were perfectly correlated, this is equivalentto a single, independent test.The third issue is that
Evaluating Trading Strategies CAMPBELL R. HARVEY AND YAN LIU CAMPBELL R. HARVEY is a professor at Duke University in Durham, NC, and a fellow at the National Bureau of Economic Research in Cambridge, MA. cam.harvey@duke.edu YAN LIU is an assistant professor at Texas A&M University in College Station, TX. y-liu@mays.tamu.edu W e provide some new tools to evaluate trading strate-gies