Transcription
Data VisualizationTools and ResourcesYESSICA GOMEZ, MPHOFFICE ON SMOKING AND HEALTHOSH S&E Coffee Break July 11, 2017The findings and conclusions in this presentation are those of the author and do not necessarily1represent those of the Centers for Disease Control and Prevention.
DisclaimerThis presentation includes examples of widelyused data visualization tools and resources.These are listed for the convenience of theuser and do not constitute endorsement by theCenters for Disease Control and Prevention.2
The purpose of datavisualization is tocommunicate.3
Design Process1 Who is your audience?Which chart is best for your2data and key message?3 How will you share your data?4
Ann K.EmeryThe esignprocess/5
Chart Types6
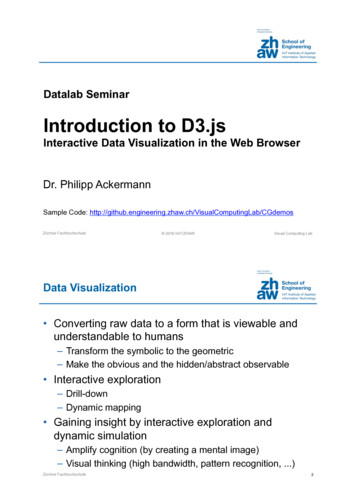
StephanieEvergreenChartChooser 3.0http://stephanieevergreen.com/Other: Stephen FewGraph Selection her7
Abela FollyChart Suggestions - A Thought /2006/09/choosing a good.html8
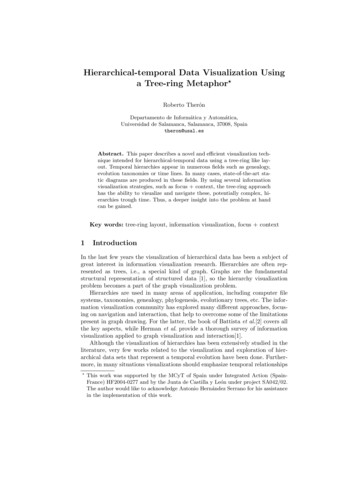
Jennifer Lyons and Stephanie EvergreenQualitative Chart Chooser -chooser/9
Jennifer Lyons and Stephanie EvergreenQualitative Chart Chooser -chooser/10
Charts &Dashboards11
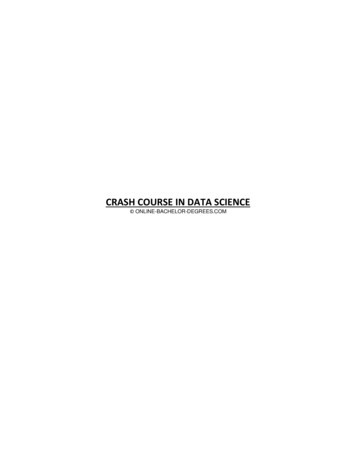
Datawrapperhttps://www.datawrapper.de12
Plot.lyhttps://plot.ly/13
Rhttps://www.r-project.org/14
Tableauhttps://www.tableau.com/15
Power BIhttps://powerbi.microsoft.com/en-us/16
Microsoft Officehttps://www.office.com/17
WordyUphttps://www.wordyup.com/18
Mapping19
ArcGIShttps://www.arcgis.com/features/index.html20
QGIShttp://www.qgis.org/en/site/21
tml22
Tableauhttps://www.tableau.com/23
Infographics24
Canvahttps://www.canva.com/25
Infogr.amhttps://infogram.com/26
t.com/27
Adobehttp://www.adobe.com/28
Resources29
Colors/FontsColorsFonts Color Brewer Adobe Kuler InstantEyedropper Font Squirrel WhatTheFont30
Colorblindness Vischeck Color Oracle Checkyourcolours31
BooksPresenting Data Effectively – Stephanie EvergreenStorytelling with Data – Cole Nussbaumer KnaflicEffective Data Visualization – Stephanie EvergreenShow me the Numbers: Designing table and graphsthat enlighten – Stephen FewNow You See It – Simple Visualization Techniques forQuantitative Analysis – Stephen fewThe Visual Display of Quantitative Information –Edward Tufte32
WebsitesAnn Emeryhttp://annkemery.com/visualization/Stephanie Evergreenhttp://stephanieevergreen.com/Stephen Fewhttps://www.perceptualedge.com/about.phpCole rd Tuftehttps://www.edwardtufte.com/tufte/33
OSH S&E ArchiveIntentional Data Visualization – Jennifer LyonsJune 15, 2017Data Visualization – Katherine RoswellOctober 23, inars/34
Questions?Contact:Yessica Gomezxca1@cdc.gov770-488-8947For more information, contact CDC1-800-CDC-INFO (232-4636)TTY: 1-888-232-6348 www.cdc.govThe findings and conclusions in this report are those of the authors and do not necessarily represent theofficial position of the Centers for Disease Control and Prevention.
For more information, contact CDC 1-800-CDC-INFO (232-4636) TTY: 1-888-232-6348 www.cdc.gov The findings and conclusions in this report are those of the authors and do not necessarily represent the