Transcription
Source Tableau User Guide – Version 2.3Public Health IntelligenceTableau User GuideSourceV2.3Page 1 of 32
Source Tableau User Guide – Version 2.3DOCUMENT CONTROL SHEETRevision HistoryVersionDateSummary of /07/1524/09/15Initial draftAmends for live serverUpgrade to Version 90.429/09/15Further edits to text0.508/10/2015Update of Screen shots1.023/10/2015Final ion of Radar Charts and BubbleCrosstabs to Chart TypesMinor amendment to include Log OutfunctionalityUpdate from HSCDIIP to Source1.318/07/2016Upgrade to Version 20172.208/09/2017Update for new Landing Page and newSource logoUpdates to available browsers for Tableaudue to upgradeLanding page no longer the first page after Amy Hyndlog in- project page is.Document changed to functionality asother guides per workbook are to beintroduced alongside this.Edits to text following changes by AHRachaelBainbridgeFurther editsRachaelBainbridgeNo1.5Amy HyndAmy shKeirRobertsonAmy Hynd2.316/05/2018Change screenshots from HSCDIIP to RachaelSource, updated landing page and remove Bainbridgesection on radar charts.NoYesNoNoNoNoNoNoNoNoNoNoApprovals This document requires the following signed approvals.NameTitleDateVersionPage 2 of 32
Source Tableau User Guide – Version 2.3ContentsDISCLAIMER. 4OTHER RELEVANT DOCUMENTS . 41ACCESSING HEALTH AND SOCIAL CARE DATA VIA TABLEAU . 61.1 USER ACCESS . 61.2 HOW TO LOG ON AND OFF . 72NAVIGATION . 82.1 LANDING PAGE . 82.2 WORKBOOKS . 102.3 NOTES . 102.4 DASHBOARDS. 112.5 STANDARD ICONS . 123FUNCTIONALITY . 143.1 REGION FILTERS . 143.2 DROP DOWN FILTERS . 153.3 SUB SECTORS . 163.4 LASSOING . 184CHART TYPES . 204.1 TREE MAP . 204.2 BUBBLE CHARTS . 214.3 MAPS . 224.4 BOX PLOTS . 234.5 HEAT MAPS . 244.6 BUBBLE CROSSTABS . 255EXPORTING DATA . 265.1 IMAGE. 265.2 DATA. 265.3 PDF . 265.4 CROSSTAB . 276PERSONALISATION . 286.1 FAVOURITES . 286.2 CUSTOM VIEWS . 296.3 SHARING . 307FAQS/TROUBLESHOOTING . 31Page 3 of 32
Source Tableau User Guide – Version 2.3DISCLAIMERAll breaches of information security that may have compromised the confidentiality,integrity or availability of Tableau or its information, actual or suspected, must be reportedto NSS PHI without delay.NSS PHI must also be notified of any access to data at a level not previously authorised(including unintentional access).Additionally all breaches of information security, actual or suspected, should be reported inline with local Information protocols and procedures.NSS contact details: NSS.Source@nhs.netAll data shown in this training manual is dummy data which has been used fortraining purposes only.OTHER RELEVANT DOCUMENTSThe following documents and materials covering Source are also available: Source Tableau User Guide – Overview of WorkbooksPage 4 of 32
Source Tableau User Guide – Version 2.3INTRODUCTIONTableau is a business intelligence visualisation interactive software package which isutilized to present Social Care data, health data and subsequent linked datasets. TheTableau Server Portal will provide access to dashboards published by ISD and workbooksthat can be analysed at Partnership level.This document will provide: An overview of the key features of Tableau. Introduction to the different charts available on Tableau How to interact with the data available.Page 5 of 32
Source Tableau User Guide – Version 2.31 ACCESSING HEALTH AND SOCIAL CARE DATA VIA TABLEAUThe Tableau Server Portal link will be provided to users once access has been granted.The Tableau Server is a web-based tool and will not require additional software to beinstalled. The Tableau server can be accessed via a mobile device or a tablet.For optimum views, the following web browsers are advised: Microsoft Internet Explorer 11 or later Mozilla Firefox 3.x or later ( not supported on mobile devices) Google Chrome , including on Android Devices Android Browser (Android 4.4 or later) Apple Safari on mac and IOS.8 or laterTableau Mobile iPad and Android Apps are available at the Apple App store and GooglePlay store.1.1 USER ACCESSAccess to Tableau is granted via local authorisers. The level of access granted to anindividual user is agreed between the user and the local authoriser. Access to multiplePartnerships must be agreed by all the Partnerships concerned.There are currently 3 access levels available. Level 1: Scotland – provides aggregated data for Scotland. The information is notbroken down to Partnership areas. Level 2: Partnership Aggregate - provides labelled data for a Partnership and theNHS Board within which that Partnership is located. Data will be unlabelled for allother partnerships. Level 3: Partnership Detail – provides data broken down below Partnership levelwith information at General Practice Level.Page 6 of 32
Source Tableau User Guide – Version 2.31.2 HOW TO LOG ON AND OFFAll authorised users will receive a username and password via email.To log in to Tableau enter the username and password in the relevant fields and click onLogin.To exit Tableau, click on the name at the top right hand corner of the window and selectSign Out.If you have forgotten, or wish to change your password, please contact Customer SupportDesk on 0131 275 7777, as indicated in the log in screen.NOTE: It is not possible to change your password within Tableau. This functionalityhas been disabled.Page 7 of 32
Source Tableau User Guide – Version 2.32 NAVIGATIONOnce logged in, you will be presented with a list of projects that you have access to on theprojects page.2.1 LANDING PAGESelecting Source Level 1 and then ‘HSC – Landing Page’ will take you toan introduction to the project with links to current workbooks available and information ontheir contents and access levels. Hovering over any icon will display information on eachworkbook.Page 8 of 32
Source Tableau User Guide – Version 2.3A user can navigate to any workbook by selecting a workbook icon. The workbook willalways open on a separate tab. Please note that you can only select one workbook toopen on a separate tab, selecting another workbook will NOT open in a new tab butreplace the first one.At the bottom of the landing page there is also a section which provides information aboutdata updates and planned future developments.Page 9 of 32
Source Tableau User Guide – Version 2.32.2 WORKBOOKSWorkbook is the term used to describe a series of charts and reports. Workbooksresemble Microsoft Office Excel spreadsheets with tabs along the top of the page allowingusers to navigate between dashboards.All workbooks have a contents page that describes the data included in each dashboardalong with links to the individual dashboards within the workbook. An example contentspage is shown below:Easy Access TabsShortcut to landing pageLink to dashboardPreview ofdashboardA separate overview document is available that provides details on all the workbooks thatare available on Source.2.3 NOTESEvery workbook contains a notes page. This page will provide important backgroundinformation to the data used, inclusion and exclusions and any disclosures that arePage 10 of 32
Source Tableau User Guide – Version 2.3required. It is imperative that these notes are read before the dashboards are used for anyreporting purposes.A Glossary of terms is included within the notes tab or in a separate tab. This dependsupon the data complexities within the workbook.2.4 DASHBOARDSEach workbook will contain a number of dashboards which contain charts and reports. Adashboard can be accessed by clicking on theicon within the contents page orselecting a tab along the top of the workbook. Each dashboard contains differenttabulations of data, which allow the user to drill further into the information. The title of adashboard will often change to reflect the selections made.The use of dashboards and how to interact with them will be explored further in thefunctionality section of this document.Page 11 of 32
Source Tableau User Guide – Version 2.32.5 STANDARD ICONSThe table below describes the different icons and shortcuts that can be seen throughout the Tableau Software.IconLocation on screenTop LeftFunctionTableau Home ButtonTakes the user back to the projects homepage.Projects Home ButtonA thumbnail view or list of the projects that auser can access.Workbooks Home ButtonLeft side screen onA thumbnail view or list of the workbooks thattableau home pagesa user can access.Views Home ButtonLeft side screen onA thumbnail view or list of the dashboards thattableau home pagesa user can access.Data sources Home ButtonLeft side screen onA list of the data tables, which provide the rawtableau home pagesdata behind the dashboards.Users will not be able to access these tables.DownloadTop right screen ofAllows the user to export the current page aslanding page andan Image or PDF. If data is selected the userworkbooks.can also export Data or a Crosstab.RevertRemoves all current filters, including theTop left screen of landing selected region from the contents page, andpage and workbooks.reverts the dashboard to the original view.You will have to reselect the region each timethis is selected.Left side screen ontableau home pagesPage 12 of 32
Source Tableau User Guide – Version 2.3Refresh DataTop left screen of landingThis updates the data within the workbook andpage and workbooks.dashboard.Landing page ButtonTop right of workbookOpens up the landing page in a new windowcontents pageTop right corner ondashboards.Contents PageShortcut to the contents page of the currentworkbook.Top right corner ondashboards.Next buttonDrops down a list of the dashboards that canbe navigated to from that page.Left hand side ondashboards below dropdown categories.Information IconProvides additional information on thecontents of the dashboard and how to use it.Selected dashboardsright hand side.Top right screen oflanding page andworkbooks.Top right screen oflanding page andworkbooks.Practice Level arrowFilters the following dashboards with thepractices selected.ShareThis allows the user to share current views ofthe dashboard with another Tableau user.Remember my changesThis allows the user to create personalizedviews.Page 13 of 32
Source Tableau User Guide – Version 2.33 FUNCTIONALITYTableau allows the user to fully interact with dashboards and to drill-down into the datapresented.3.1 REGION FILTERSDashboards can be filtered to show a selected Partnership and region. The Partnershipsthat you are able to view will be agreed with the appropriate authoriser(s).Selected workbooks will have a region filter displayed on the contents page as below. Aregion must be selected as this will filter the data throughout the workbook. If no region isselected, the dashboards will be blank. All regions are aligned to health board areas.Select RegionPage 14 of 32
Source Tableau User Guide – Version 2.33.2 DROP DOWN FILTERSAll dashboards will have drop down lists at the top of the page below the title. These listsallow you to drill further into the data. When a value is selected from the drop down list, thedashboard title will change accordingly and the changes highlighted in blue.Depending on the type of dashboard and the data that is presented, listed below are a fewexamples of filters that can be applied to change parameters: Region (only on contents page) Partnership Service Sector Year Age Group Measure (Expenditure/ Rate per capita ) Chart types Client/ Service User Type Hospital Speciality Group Location TypeDrop down selections made in one dashboard will be carried over to the remainder ofdashboards where the same filters exist within that workbook. For example, if age rangeselected is 65 on dashboard 1, and age range is presented on dashboard 2, thendashboard 2 would also be filtered on those aged 65 .Certain selections have to be made within the correct order, from left to right. If selectionsare made in the wrong order, a warning message will appear. To correct this, follow theinstructions that appear in red.Page 15 of 32
Source Tableau User Guide – Version 2.3Once selections are made in the correct order, the dashboard will reload and present thedata to reflect the chosen filters.3.3 SUB SECTORSSome charts and reports become more detailed when a chart segment is selected.Click on a segment of a chart and additional charts and data will appear below the existingcharts.Page 16 of 32
Source Tableau User Guide – Version 2.3It is important to note that to select a segment the user should click on the segment onlyonce.Tableau allows the user to select multiple segments so that multiple charts show as below.To do this hold the ctrl key whilst making your segment selections.Page 17 of 32
Source Tableau User Guide – Version 2.3To clear any selections made, simply click on the segment originally selected or away fromthe chart area to revert back to the original chart.3.4 LASSOINGTableau allows flexibility with how segments of data are selected. A user can selectmultiple selections by ‘lassoing segments’. To lasso objects simply left click on the mouseand drag, a box will appear over the sectors ‘lassoed’. This method can only be used toselect items that are already next to each other. Some examples of ‘lassoing’ are shownbelow:Page 18 of 32
Source Tableau User Guide – Version 2.3The dashboard will highlight the lassoed section:Page 19 of 32
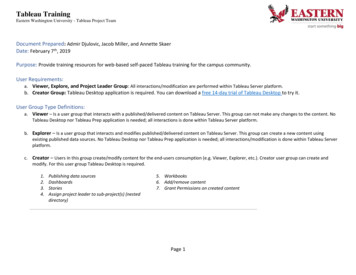
Source Tableau User Guide – Version 2.34 CHART TYPESThe data within dashboards are presented in various formats including pie charts, bargraphs and line graphs. An overview of some chart types, and how they work, is providedbelow:4.1 TREE MAPA treemap is a pictorial representation of measurable data which uses rectangles to showhow large or small the data is. The rectangles are ordered and sized, from the highestvalue or proportion, to the lowest. The treemap above shows the proportion of expenditurewithin NHS & Social Care for each sector. The first rectangle shows the sector which hasthe highest proportion of expenditure, which is within the hospital setting. The sectorwhich has the smallest proportion of expenditure is accommodation based care withinsocial care.Page 20 of 32
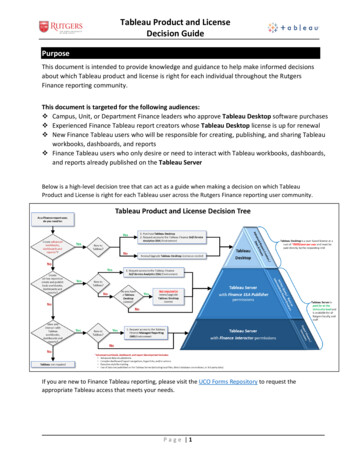
Source Tableau User Guide – Version 2.34.2 BUBBLE CHARTSA bubble plot shows the data in a cluster of circles. It is similar to a treemap as it shows alot of information in a visual way which is easy to understand. The large bubbles representthe highest proportion of what is being measured, the smallest bubbles shows where thesmallest proportion lies. Unlike the treemaps, the bubble charts are not shown in order, itis a random spread. The example above shows the total expenditure by health sub-sector.You can easily identify that: 01-Acute Inpatients – Non elective has the largest area ofexpenditure.Page 21 of 32
Source Tableau User Guide – Version 2.34.3 MAPSThe mapping function in tableau is very powerful and further development to use thefunctionality will follow in future workbook/dashboards. Choropleth maps is currently used,which utilises differences in shading, colouring and the placing of symbols which representa particular location e.g. hospital or a care home. Currently Region, Partnership andDatazone maps are available in Tableau, with plans to develop locality maps once thenecessary reference data is received. Locations can be plotted to show where hospitals,GP Practices and care homes are based.Page 22 of 32
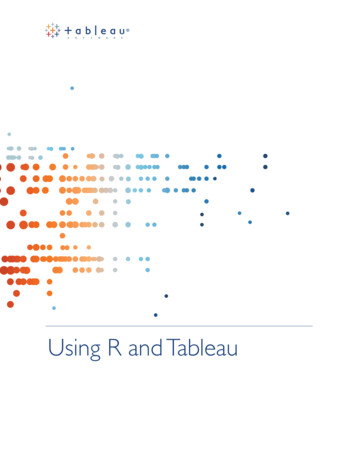
Source Tableau User Guide – Version 2.34.4 BOX PLOTSA box plot, or sometimes known as a box and whisker plot, is a type of graph that showsthe distribution of a numerical variable, such as costs. The data is first sorted from lowestto highest values. The box plot then splits the data into four sections called quartiles. Thelower section is called the “lower quartile”, where each data point is shown across the leftline (whisker) extending from the box. The data points on this line account for the lowest25% of the data. The upper section is called the “upper quartile”. Each data point is shownon the right hand line (whisker) that is extending from the box. The upper quartile showsthe range of values that lie in the top 25% (75% – 100%) The shaded box contains themid range of the data points that account for 25% to 75% of the data, this is also called theinter-quartile range (IQR). The vertical line in the box is the “median” – the middle value ofthe data points. The data points that lie outside of the box plot are called “outliers”. Theseare data points that differ greatly from the overall pattern of data.Page 23 of 32
Source Tableau User Guide – Version 2.3How to interpret box plots:The length of the box plot is comparatively short – see Partnership 2. This suggeststhat costs for each GP Practice are quite similar to each other – excluding the outlier whichwould need further investigation.The box plot is comparatively long – see Partnership 1. This suggests that the costs arequite different between each of the GP Practices within the partnership.One box plot is much shorter or longer than another – compare partnership 1 and 2 –This shows that the variation in costs between the two partnerships is very different.There is not much spread in the costs for Partnership 2 compared to Partnership 1,although there is not much of a difference between the median costs.4.5 HEAT MAPSHeat maps demonstrate, via a colour scale, how a value of proportion differs between twogroups. Here a darker colour represents a greater value, with a lighter colour representinga smaller one. In this example, those aged 85 in Partnership 2 have the highestExpenditure per 1,000, whilst those under the age of 65 in the same Partnership have thelowest Expenditure per 1,000.Page 24 of 32
Source Tableau User Guide – Version 2.34.6 BUBBLE CROSSTABSA bubble crosstab is an adaption of regular crosstabs that can visually highlight differingvalues. As with bubble plots, a larger bubble represents a higher proportion of themeasure, while a smaller bubble represents a lower proportion. A colour scale can also beused to highlight the different proportions. In this example LTCs are presented alongsidethe proportion of their additional LTCs. On the left are the given LTCs and HRI user type,and along the top are the additional LTCs. A larger bubble then will suggest that a higherproportion of individuals with the given LTC also have the additional LTC. Here we cansee that 38.7% of HRI individuals who have Parkinsons also have Cancer which is thehighest proportion on this chart, while Other Service Users with Dementia who also haveMS are the lowest proportion (0.2%). Please note that no proportion is given if anadditional LTC is the same as the given LTC as it will always be 100%.Page 25 of 32
Source Tableau User Guide – Version 2.35 EXPORTING DATAWorkbooks and dashboards can be exported to PDF or Image. If data is selected within atable or chart then this can also be exported as a text or .csv file.To export a dashboard click on thebutton at the top right of the screen asshown below. The drop down will provide a list of export options.5.1 IMAGESelecting Image will produce the following pop up window:Once downloaded, the dashboard will be exported to a .png file.5.2 DATASelecting Data will produce a pop up window including the data points selected in the chartor table. This can be downloaded as a text or .csv file.5.3 PDFSelecting PDF will produce the following pop up window:Page 26 of 32
Source Tableau User Guide – Version 2.3As you can see above, there are multiple options that are offered when exporting to PDFto ensure that the report is fit for purpose in PDF format.The content options provide the ability to export the current dashboard or multiple sheetswithin the workbook and dashboard. Selecting sheets in dashboard or workbook is notadvisable as this refers to the individual charts that sit within the dashboards and couldexport several hundred pages of information.5.4 CROSSTABSelecting Crosstab will produce the following pop up window. Once downloaded, the datawill be exported to a .csv file.Page 27 of 32
Source Tableau User Guide – Version 2.36 PERSONALISATIONTableau can be personalised and customised to the user, enabling easier navigation. Thisallows the user to save favourites and to share reports with colleagues that have the sameaccess levels within the Partnership.6.1 FAVOURITESIt is possible to create a shortcut to favourite workbooks instead of selecting them throughthe landing page. This function at the moment only allows the user to save the contentspage as a favourite and not the individual dashboards. This is due to the region filter onthe contents page.To create a favourite, click on the star next to the Workbook title at the top of the page.Once selected, the star will become yellow.To view favourite shortcuts, the user can click on the white star next to their username andselect the workbook of choice.Page 28 of 32
Source Tableau User Guide – Version 2.36.2 CUSTOM VIEWSIt is possible to create bookmarks which allow a user to save specific views/ permutationsof selections you have made in Source workbooks.A user can make selections (at any level on any dashboard) and click onat the top right hand side of the toolbar on any dashboard and type in the bespoke namefor the view and filter choices.A user can click on this in future to view and quickly access these bookmarks from theappropriate dashboard.will change when any custom view is saved tothe name of the view which is currently being viewed.Custom views allows the default to be changed, this will filter the rest of the workbook withthe same selections.When views are changed via remember my changes, the URL will change with the nameof the view at the end.Due to the data loading to the custom view, this function is often slower than the originalview.Page 29 of 32
Source Tableau User Guide – Version 2.36.3 SHARINGIt is possible to share customised filters on a dashboard with Colleagues via email. Thiscan be done by clicking on theicon located at the top right hand side of thescreen and copy and pasting the link into an email message.The dashboard can only be shared with other Tableau users with the same access levels.The functionality to embed the dashboard into another website has been disabled.Page 30 of 32
Source Tableau User Guide – Version 2.37 FAQS/TROUBLESHOOTINGTroubleshootingI have forgotten my password.Please contact the Customer Support Desk on 0131 275 7777, with details of your usernameand issue.I have forgotten my username.Please contact CSD on 0131 275 7777.Tableau is running slow and will notReturn to the landing page and reload the dashboard. If the problem persists restart yourload a dashboard.internet browser.I cannot access all of the dashboards.Dashboard access is dependent upon a users access levels and some dashboards are onlyavailable to users with level 3 access. If you have level 3 access and cannot access alldashboards please email NSS.Source@nhs.net and include the name of the dashboard(s) youare unable to access.The workbook loads however theEnsure that you have selected a region on the contents page. If the dashboards still appeardashboards appear blank.blank, please email NSS.Source@nhs.net.The region I selected on the contentsThe revert icon at the top of each dashboard will revert ALL selections made including thepage resets to “please select region”region from the contents page. To undo selections, please use the undo icon.after I revert to original.There is a delay between clicking on aThe time taken to load a workbook will be dependent upon the amount of data used within theworkbook and it loading.workbook. The first time you load a workbook it will be slower as the data is loading in thebackground.I can log in but have no projectsAccess to Source is required to renew every 6 months. An email requesting renewal will be sentPage 31 of 32
Source Tableau User Guide – Version 2.3showing.to you 2 weeks prior to the renewal date. If you do not renew your access, access will beremoved.Page 32 of 32
Source Tableau User Guide - Version 2.3 Page 7 of 32 1.2 HOW TO LOG ON AND OFF All authorised users will receive a username and password via email. To log in to Tableau enter the username and password in the relevant fields and click on Login. To exit Tableau, click on the name at the top right hand corner of the window and select Sign Out.