Transcription
2018 Building Performance Modeling Conference andSimBuild co-organized by ASHRAE and IBPSA-USAChicago, ILSeptember 26-28, 2018DIGITAL TWINS FOR EFFICIENT MODELING AND CONTROL OF BUILDINGSAN INTEGRATED SOLUTION WITH SCADA SYSTEMSAchin Jain1, Derek Nong1, Truong X. Nghiem2, and Rahul Mangharam11Flexergy AI, Philadelphia, PA2Northern Arizona University, Flagstaff, AZABSTRACTWe develop an integrated solution for incorporating “digi- taltwins” of real buildings into existing SCADA systems, whichenables real-time prediction and advanced control. Thesedigital twins are either EnergyPlus (E ) or data- driven (D )building models, whose input and output vari- ables are mappedto analogous real building OPC tags and track the real-timeoperation of the building. An E dig- ital twin can be used toprovide predictions of the build- ing’s performance indifferent weather, usage, and energy pricing scenarios, whichallows for accurate assessment of different control strategies.However, it is not suitable for optimization and predictivecontrol due to its complexity. We develop scalable D digitaltwin based on Gaussian Processes (GP) for accurateprediction and advanced con- trol. A D digital twin is mucheasier, faster, and less ex- pensive to train than developing andtuning an E model, while still providing accurate powerforecasts and being suitable for control. Data-driven ModelPredictive Con- trol (MPC) optimizes control inputs of thepredictive D model for energy curtailment with thermalcomfort guar- antees in demand response applications. TheMPC con- troller is integrated into the SCADA environment,demon- strating real-time in-the-loop control of D digitaltwins.INTRODUCTIONEfficient control of buildings requires high fidelity models thatcapture the evolution of the state of the building with time, forexample, how the power consumption and zone temperatureare affected when the chilled water or the supply airtemperature set-points are changed with time or when outsideweather conditions are different. Model Predictive Control(MPC) uses such models to predict the state of the building overa finite horizon and optimize the performance with a givenobjective like load curtailment while meeting thermal comfortand operation constraints.To this end, the classes of models that are most widelystudied in the literature use first principles based onphysics. These include the white box models typicallybased on high fidelity simulation software like EnergyPlus (E )(Deru et al. 2011) and TRNSYS (University of Wis- consinMadison 1975), and the grey box models based on ResistorCapacitance (RC) networks (Deng et al. 2010). The userexpertise, time, and associated sensor costs re- quired todevelop such models of a single building arevery high. This is because such models require detailedinformation about the geometry of a building, design andequipment layout plans, material properties, and equip- mentand operational schedules. Moreover, the model- ingprocess also varies from building to building with theconstruction and types of installed equipment. Af- terseveral years of work on using first principles based modelsfor peak power reduction and energy optimizationfor buildings, multiple authors (Sturzenegger et al. 2016; Žáčeková, Váňa, and Cigler 2014) have concluded that thebiggest hurdle to mass adoption of intelligent buildingcontrol is the cost and effort required to capture accuratedynamical models of the buildings.We take an alternative route to the physics-based approach, i.e. black box modeling based on machine learn- ingalgorithms to learn a digital twin of the underlying physicalsystem – a building in this case. Our approach re- duces the costand time to model the buildings by an order of magnitude (Jainet al. 2018a; Smarra et al. 2018; Jain et al. 2018b; Jain,Smarra, and Mangharam 2017; Jain, Behl, andMangharam 2017; Nghiem and Jones 2017; Behl,Nghiem, and Mangharam 2015). We learn data- driven (D )models using only historical data available via sensors alreadyinstalled in the buildings – thermostats, multimeters – andhistorical weather data. The D models can not only be usedfor prediction but also for real-time MPC. These models arescalable and integrate seamlessly to the existing SupervisoryControl and Data Acquisition (SCADA) systems or theBuilding Energy Management Systems (BEMS).Although expensive to build, the E models are useful tosimulate the behavior of the building. For example, build- ingoperators use E as an isolated testbed to analyze dif- ferentcontrol strategies and receive immediate feedback withouthaving to implement the strategies on the real building. Thedrawback of E models is that they can- not be used foradvanced control like MPC. On the other hand, as we willshow later, the D models are much less expensive to build andthey can be used for simulating the response of the real buildingas well as for real-time MPC. While the D models forcontrol is a novel approach in its own right, the use of D and E models as real-time digital twins is limited inpractice because of lack of inte- gration with existing SCADAsystems.In this paper, we present an end-to-end architecture799 2018 ASHRAE (www.ashrae.org) and IBPSA-USA (www.ibpsa.us).For personal use only. Additional reproduction, distribution, or transmission in either print or digital form is not permitted withoutASHRAE or IBPSA-USA's prior written permission.
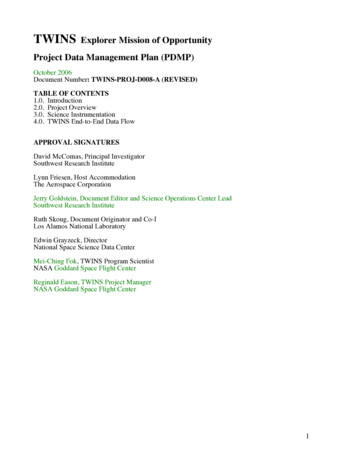
E modelEnergyPlus OPC Bridge OPC ServerMPC with D modelFigure 2: The MPC controller runs in Python using theD models and applies the optimal inputs to the E model. The communication is made possible using thepyEplibrary and the OPC connection.Figure 1: A typical architecture of a SCADA system working with a real building is shown in black, and our contributions in blue.for efficient modeling and HVAC control of large scalebuildings using machine learning, see Figure 1. Weexplain and demonstrate with examples our completepipeline starting from tools for data acquisition fromexisting SCADA/BEMS to learning accurate controloriented data-driven D models using Gaussian Processes (GP)to using D models for real-time predictive con- trol withhigh confidence. We use an EnergyPlus-OPC bridge thatconnects E models to the SCADA system through asimulated OPC server. We design a predictive controllerusing D models learned from the historical data obtainedfrom a Historian database. For testing the controller with E models, the controller communicates via the OPC server.For testing the controller on a real building, secure and directcommunication with SCADA is possible.DATA ACQUISITION & COMMUNICATIONIn a building automation system, a Supervisory Control andData Acquisition (SCADA) system is commonly used by theoperators to manage individual buildings or a cam- pus ofbuildings. It interfaces directly with building sen- sors andcontrollers through open source protocols like BACNet orOPC. SCADA software also provides a dash- board interfacefor operators to view live or historical data feeds fromsensors and an easy way for operators to change controlsetpoints remotely. Additionally, it may also offer a Historiandatabase to store historical data val- ues for future reference ordata analysis. See Figure 1 for an illustration of a typicalSCADA system.There are two main limiting factors in bridging digitaltwins with existing SCADA software. First, most SCADAsoftware are self-contained and the features are limited to thoseprovided by the vendor. Building operators cannotview the results from E /D models on the same SCADAsoftware used for real-time monitoring because it is not clearhow we can communicate between the E /D mod- els andexisting SCADA software to acquire the data tags required byE /D models for simulation and control, and to show thegenerated results on the dashboards. Second, if the digital twinis an E model, we need an external li- brary like MLE (Bernal et al. 2012) to design a controller in a scriptinglanguage such as MATLAB. This is because EnergyPlus onlyallows manually coded rule-based con- trol strategies. SincePython is a popular programming language for data scienceand machine learning, we need an alternative to MLE forPython.In this work, we use the open interface OPC to connectEnergyPlus with any existing SCADA software that sup- portsOPC for real-time data communication. We call this theEnergyPlus-OPC bridge. By representing inputs to andoutputs from EnergyPlus as OPC tag structures, we make theintegration into existing SCADA software sig- nificantlyeasier since the simulated building will appear as a realbuilding to the SCADA software. Furthermore, since ourmachine learning models are written in Python, we develop alibrary to interface Python and EnergyPlus called pyEp, anequivalent to MLE for Python. We show how this libraryallows for intelligent control of buildings using D modelsand testing on E models. The transi- tion from testing on E models to testing on real buildings can be made seamlesslythrough the SCADA system.The case studies presented later in this paper use the setup shownin Figure 2, in which a data-driven controller based on a D model acts on an E model as a plant. The EnergyPlusOPC bridge allows us to interface an E /D model to theOPC server and thus to the SCADA software for real-timemonitoring and closed-loop control of the building. Thesetpoints obtained from the controller and the correspondingresponses from the digital twin can be viewed in real time in acommercial SCADA dashboard.800 2018 ASHRAE (www.ashrae.org) and IBPSA-USA (www.ibpsa.us).For personal use only. Additional reproduction, distribution, or transmission in either print or digital form is not permitted withoutASHRAE or IBPSA-USA's prior written permission.
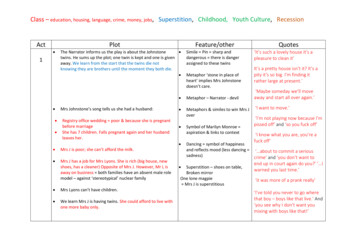
EnergyPlus-OPC BridgeOur EnergyPlus-OPC bridge provides the EnergyPlus in- putand output variables as OPC tags to be read by any OPCclient. The user is able to configure the simulation for anynumber or type of buildings and can run each in- dividually ondifferent schedules. To see the simulation in progress, theoperators only need to view the tag using an OPC client, asthey would for any other data source. By writing to one of theinput tags, the operators can change the input setpoints toEnergyPlus and see the response of the building. For moreadvanced control of the building, operators can use our MPCcontroller based on D mod- els. The service supports therunning of multiple EnergyPlus instances, creating a campus of isolated buildings. Thebuildings are simulated synchronously, so that theirsimulations are always kept at the same time. This capability can be useful when looking at aggregate powerconsumption and synthesizing control strategies involv- ingmultiple-building curtailment. For communication be- tweenEnergyPlus and Python we use pyEp.pyEp: A Python EnergyPlus InterfaceCurrently, EnergyPlus supports external programs throughthe Building Controls Virtual Testbed (BCVTB), built on topof Ptolemy II, and the Functional Mockup Interface (FMI)standard. Using BCVTB, the users can couple and definedata flows between various modeling and simulationprograms, such as TRNSYS or Simulink. These simulationenvironments, while comprehensive, are still constrained bythe capabilities of the software. MLE provides a solutionto this problem, allowing the end-users to directlycontrol the progress of an EnergyPlus simulation bywriting MATLAB code. In recent years, Python hasbecome a popular language for data science and machinelearning, in academia and especially in industry. The pyEplibrary connects the myriad of Python libraries with existingtechnologies in the building modeling and simulationcommunities. For example, in our case studies depicted inFigure 2, we obtain data from EnergyPlus to learn D models, which are used for synthesizing building controlstrategies, then evaluate these strategies in closed-loopsimulation with EnergyPlus. These steps are made possibleby pyEp.The pyEp library is designed to be lightweight andflexible. The core class is ep process, which pro- videssimple read and write capabilities with EnergyPlus. Each epprocess instance corresponds to one Energy- Plus building,and is independent of all other ep process instances. Thisallows for multiple EnergyPlus models being run togetherin a campus-like co-simulation. An example using theDepartment of Energy (DoE) provided LargeOffice buildingmodel is included in the installation. For an EnergyPlus IDFmodel file to be used with pyEp, itE modelBridge writes to E 61Bridge reads E 2Bridge writes to OPC3Controller reads OPCE -OPC BridgeBridge reads OPC5OPC ServerController writesset-points to OPC4D controllerFigure 3: Communication sequence for data exchange.must have the ExternalInterface configured, as well as anassociated variables.cfg, specifying the inputs and outputs tothe ExternalInterface. pyEp is available on the Python PackageIndex (PyPI) and can be installed with the command pip installpyEp. Its documentation tem ArchitectureThe EnergyPlus-OPC bridge requires two processes to startand control a simulation over OPC. The first is the bridgeitself, which can be started once and left in the backgroundindefinitely. The second is a controller, which determines whichsetpoints to write to the bridge at what time during thesimulation. The role of the bridge is to handlecommunication between EnergyPlus and the OPC server. Therole of the controller is to control the inputs at every time stepof the EnergyPlus co-simulation by writ- ing to the OPCserver. The communication sequence for data exchange isshown in Figure 3. The same process fol- lows for the nextbuilding, until all have been incremented forward by one timestep. The communication protocol ensures that every inputand output are read to the cor- rect EnergyPlus building, andthat delays in the network communications do not cause thecontroller and bridge to become out-of-sync with each other.The exchange of information is not real-time dependent, sohuman opera- tors can change the inputs time step by timestep at any pace. The controller can also preemptively stop asimula- tion by terminating the controller process. Changesto a prescribed schedule can also be made, and the simulationrestarted again without needing to restart the bridge pro- cess.This allows for faster and easier changes with less timeoverhead between simulation runs. Specific syntax can befound in the documentation. The bridge should only berestarted if different EnergyPlus buildings need to be used.801 2018 ASHRAE (www.ashrae.org) and IBPSA-USA (www.ibpsa.us).For personal use only. Additional reproduction, distribution, or transmission in either print or digital form is not permitted withoutASHRAE or IBPSA-USA's prior written permission.
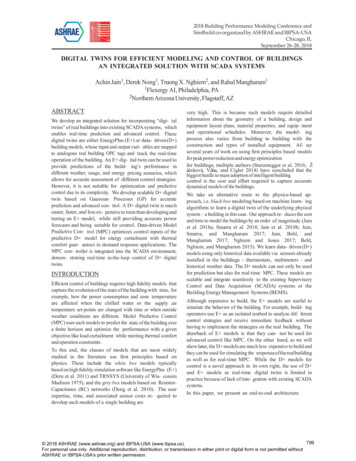
RequirementsThe provided controllers use the OpenOPC library to con- nectto an OPC server, but other methodologies may be used ifthe communications paradigm is followed. See pyEpdocumentation for more details. Additionally, the freeMatrikon OPC Server Simulator is used as the de- faultserver. Included with pyEp is a server configuration XMLgenerator that automatically creates the correct OPC Tree Tagstructure for the Matrikon Server. The pyEp core module,linking EnergyPlus to Python, is supported for Python 2.7and 3.x, while the EnergyPlus-OPC bridge re- quires Python2.7.MODELING WITH GAUSSIAN PROCESSESAs discussed in the Introduction section, conventionalbuilding modeling methods based on first principles aretime-consuming and cost-prohibitive. Data-driven mod- elingapproaches, based on machine learning techniques, have beenshown to be fast, economical, and accurate al- ternatives.This section presents a building modeling ap- proach withGaussian Process (GP), starting with a brief introduction toGP and its application in controls, and is adapted from (Jain etal. 2018a).Introduction to Gaussian ProcessDefinition 1 A Gaussian Process is a collection of random variables, any finite number of which have a jointGaussian distribution.nConsider an unknown function() f : R 1 R with noisy observations y f (x) N 0, σ 2 . An GP of y is specifiedby its mean function μ(x) and covariance function k(x,xt),μ(x; θ ) E[ f (x)]k(x, xt; θ ) E[( f (x) μ(x))( f (xt) μ(xt))] σ 2δ (x,nxt)(1)where δ (x, xt) is the Kronecker delta function. Thesefunctions are parameterized by the hyperparameter vector θ .The covariance function k(x, xt) specifies how the out- puts atx and xt are correlated. In other words, a GP modelof y specifies the relationship between the input variables,prior μ 2σprior μposterior μ 2σposterior μ400300power [kW]This bridge-controller design provides great flexibility in howthe user can make use of EnergyPlus. Users can freelymodify the controller to customize the simulationparameters. A simple schedule based controller can bemade with basic knowledge of Python. Alternatively, morecomplex model-based controllers like MPC as in Sectioncan also be implemented and evaluated. Two ex- amplecontrollers are included in the pyEp library. The firstcontroller implements a setpoint schedule in Python andshows how to read/write from the controller to En- ergyPlus.The second controller implements a setpointschedule based on a formatted csv file.2001002am4am6am8am10amFigure 4: Example of priors calculated using (1) and posteriors using (2) for predicting power consumption of abuilding for 12 hrs. Initially the mean is constant becauseμ(x) is constant, and we observe a high variance. Theposterior agrees with the actual power consumption withhigh confidence.through the covariance function, rather than a fixed struc- turalinput–output relationship from x to y.Given the regression vectors X [x 1 ,., xN ]T and theircorresponding observed outputs Y [y 1 ,., yN ]T , the distribution of the output y corresponding( to a new) inputvector x is a Gaussian distribution N y , σ 2 ,y gm (x ) : μ(x ) K K 1 (Y μ(X )): σ 2 gv(x ) K K K 1 TK ,(2a)(2b)where K [k(x , x 1 ),., k(x , xN )], K k(x , x ), andK is the covariance matrix with elements Kij k(xi, x j ). Thehyperparameters θ can be learned by maximizing thelikelihood: argmaxθ Pr(Y X, θ ). An example of GP prior andposterior is shown in Fig. 4.GP models have several advantages over other machinelearning models, that make them more suitable for identification of dynamical systems.1. GPs provide predictive variances, which carry uncertainty information of the predictions. The full predic- tivedistribution, which includes both the mean and variance,can be used in a meaningful way, e.g., to estimate a95% confidence bound for the prediction.2. GPs work well with small data sets due to its stochas- ticnature, which is generally useful for any modelingapplication.3. GPs allow incorporating domain knowledge of thesystem into the model to improve its accuracy, bydefining priors on the hyperparameters or using aparticular structure of the covariance function.More details on GPs and their applications can be found in(Rasmussen and Williams 2006).802 2018 ASHRAE (www.ashrae.org) and IBPSA-USA (www.ibpsa.us).For personal use only. Additional reproduction, distribution, or transmission in either print or digital form is not permitted withoutASHRAE or IBPSA-USA's prior written permission.
1,5001,000500systemμ 2σ yμ0error [kW]Consider a nonlinear dynamical system with control input u,exogenous disturbance input w, and output y. At a cur- renttime step t, time-delayed input and output signals are calledautoregressive, for example: yt 1, ut 1, wt 1. By feedingautoregressive inputs and outputs to a GP as re- gressors, wecan model the dynamic behavior of the sys- tem (Kocijan2016). Specifically, the regressor vector xt at time step twould bepower [kW]Gaussian Processes for Dynamical Systems20010004am8am12pm4pm8pmxt [y t l ,., yt 1, u t m ,., ut , w t p ,., wt 1, wt ].where l, m, and p are respectively the lags for autoregres- siveoutputs, control inputs, and disturbances. Note that ut and wt arethe current control and disturbance inputs. The dynamical GPyt f (xt ) can then be trained from data in the same way as anyother GPs.In a multistep simulation of a dynamical GP, the autoregressive outputs fed to the model beyond the first step arerandom variables, resulting in more and more complexoutput distributions as we go further. Therefore, it involves uncertainty propagation through the model, whichwould complicate the computation of the model significantly. (Nghiem and Jones 2017) showed that a simplesimulation method called zero-variance method, which replaces the autoregressive signals with their correspondingexpected values, could achieve sufficient prediction accu- racywhile benefitting from computational simplicity. In this paper,the zero-variance method was selected for pre- dicting futureoutputs in optimization formulations.Modeling Building’s Power Demand and Zone Temperatures with Gaussian ProcessesWe use a U.S. Department of Energy’s Commercial Reference Building (DoE CRB) simulated in EnergyPlus as thevirtual test-bed building. It is a large 12-story office build- ingconsisting of 19 zones with a total area of 498,588 sq.ft.Under peak load conditions the office can consume up to 1.4MW of power. Our aim is to model the build- ing’s powerdemand and zone temperature behavior from data that can bemeasured directly from installed sensors such as thermostats,multimeters and weather forecast. We learn two GP models:M1 for predicting the power demand and M2 for predicting thetemperature of a partic- ular zone in the building. Thefollowing feature variables are used for training: Weather variables d w: such as outside temperature and humidity, which are derived from historicalweather data. Proxy variables d p : such as time of day and day ofweek, which indicate occupancy and periodic trends. Control variables u: such as cooling, supply air temperature and chilled water setpoints – these variablesFigure 5: Rolling forecast of the power demand for oneparticular day using GP model M1 . The actual demandis almost always within the 95% confidence interval.will be optimized in MPC. Output variable y: total power consumption forM1and zone temperature for M2 – this is the output ofinterest which we will predict using all the above fea- turesin the model.Using these measurement data, we learn autoregressive GPmodels M1 and M2, and use the zero-variance method topredict the future output yt τ , where t is the current time andτ 0. Specifically,()yt τ N y t τ gm (xt τ ), σ 2 y,t τ gv (xt τ ) ,(3)xt τ [y t τ l , . . , y t τ 1 , ut τ m ,. . , ut τ ,w t τ p ,., wt τ 1, wt τ ],in which w : [dw, d p]. It is assumed that at time t, wt τ areavailable τ from forecasts or fixed rules as applica- ble. Forthe GP, we use a constant mean function and the specialcovariance function proposed in our previous work (Nghiemand Jones 2017) to capture both the temporal pattern of theenergy usage and the effect of non-temporalfeatures, such as weather conditions and temperature setpoints, on the power demand. We optimize the hyperparameters θ of the GP model using GPML (Rasmussen andNickisch 2010).The mean prediction y with 95% confidence interval y 2σyfor a particular day are shown in Figure 5. With only 3 weeksof training data, we obtain a prediction accuracy of 94% interms of normalized root mean square error (NRMSE) andan RMSE of 47kW for a building with peak demand 1400kWand mean power demand 816kW.MPC WITH GAUSSIAN PROCESSESThis section presents a data-driven predictive control approach for buildings using GPs. Suppose that GP mod- elsof a building’s power demand and zone temperatures arealready developed, as discussed in the previous sec- tion. Thepredicted power demand at any future time t τ803 2018 ASHRAE (www.ashrae.org) and IBPSA-USA (www.ibpsa.us).For personal use only. Additional reproduction, distribution, or transmission in either print or digital form is not permitted withoutASHRAE or IBPSA-USA's prior written permission.
Figure 6: Status of the LargeOffice as seen on SCADA system during Demand Tracking Control. The blue vertical lineshows the current time of operation. Power consumption: the baseline power consumption is shown in dashed line, thecurtailment is shown in solid green and the 95% confidence bounds are shown in solid red. Since a fixed curtailment istracked without thermal comfort constraints in problem (4), the zone temperature shoots up by 2 C.in a window of N time steps starting from the current timet, for τ {0,., N 1}, is given by Equation (3). Theoutput at time t τ depends upon the control inputs u t τ m ,.,ut τ . We next show the flexibility of usingthese models in different applications.Demand Tracking ControlThis predictive control formulation fits demand responseapplications where a customer – a building in this case – mustcurtail its power demand by a certain amount from itsbaseline, or must track an Area Control Signal (ACS) sentfrom the grid operator. For Demand Tracking Con- trol weonly require GP model M1. We are interested in solving thefollowing optimization problemN 1minimize (y t τ yref,t τ )2 λ σ 2τ 0y,t τ(4)subject to y t τ μ(xt τ ) K K 1 (Y μ(X )) K K K2σ y,t τut τ UPr(yt τ Y ) 1 ε 1KTwhere the constraints hold for all τ {0,., N 1}. Here, K [k(xt τ , x 1 ),., k(xt τ , xN )], K k(xt τ , xt τ ). The signalyref is a reference power demand trajectory the building shouldfollow as closely as possible. The last constraint isprobabilistic, which states that the building’s power demandmust stay inside a set Y with a probabilityof at least 1 ε. For instance, this constraint can control thequality of tracking the reference yref.We solve the optimization problem (4) to compute optimal u t ,. ., u t N 1 , apply ut to the system and proceedto time t 1. Although all the constraints in (4) are ofanalytical forms, the optimization can be computation- allyhard to solve due to the high nonlinearity and computational burden of the GP. We use the nonlinear solverIPOPT (Wächter and Biegler 2009) and the optimizationmodeling framework CasADi (Andersson 2013) to solve (4).We show the real-time results on the SCADA system inFigure 6. The dashboard is configured to show the currentpower consumption, current setpoints, current weatherconditions, a 12 hour history of the temperature of one of thezones (CoreMid), a 12 hour history of the setpoints –cooling temperature (red), supply air temperature (green),chiller water temperature (blue) – and a 12 hour history of thepower consumption (solid green) along with a 12 hourforecast of the baseline consumption (dashed). In this example, the controller follows a rule-based strategy until 3 pm.A Demand Response is scheduled between 3-5 pm when D controller based on (4) is used. The controller provides asustained curtailment of 100kW from the base- line. Since afixed curtailment is desired without thermal comfortconstraints, the zone temperature shoots up by 2 C.804 2018 ASHRAE (www.ashrae.org) and IBPSA-USA (www.ibpsa.us).For personal use only. Additional reproduction, distribution, or transmission in either print or digital form is not permitted withoutASHRAE or IBPSA-USA's prior written permission.
Figure 7: Status of the LargeOffice as seen on SCADA system during Climate Control with Minimum Energy Usage. Theblue vertical line shows the current time of operation. Power consumption: the baseline power consumption is shownin dashed line, the curtailment is shown in solid green and the 95% confidence bounds are shown in solid red. Zonetemperature: the thermal comfort constraint keeps the temperature between a desired range 23 25 C defined in theoptimization problem (5).optimization , . ,theusolveu N 1, apply u problem (5) to compute optimaltClimate Control with Minimum Energy UsageOther interesting objective for energy management is ofminimizing energy usage while meeting thermal comfortand operation constaints. This is always desired since theconsumers want to minimize their electricity bills. When thereal-time price of electricity peaks, the utilities may also asktheir customers to minimize their consumption between aspecified time based on the available flexibility. In thisexample, we require both GP models M1 and M2.Specifically, the model M2 is used to enforce thermalcomfort constraints in the optimization problem below:N 1y,t τminimize y t τ λ σ 2(5)τ 0subject toy t τ μ(xt τ ) K K 1 (Y μ(X ))GP M1 1T K K K2Kσ y,t τ T t τ μ(xt τ ) K K 1 (Y μ(X )) 2 K K K 1K TGP M2σ T,t τ Pr(Tt τ T ) 1 εut τ UHere, y , σ 2y denote the mean and variance of the GP M1 ,and T , σT2 of the GP M2 . The goal is to optimize the inputs u that minimize the power consumption while maintaining thermal comfort with high probability. We againt t to the system and proceed to timet 1.We consider a Demand Response scenario when the utility company notifies this building to minimize the powerconsumption between 11am - 2pm. Between 2pm - 3pm, thecontroller switches to tracking the baseline consump- tionbased on (4) to prevent a sudden kickback. The sta- tus ofthe SCADA system at 3pm is shown in Figure 7. Thecontroller exploits the available energy flexibility inproviding maximum curtailment while ensuring that the zonetemperature is always between the prescribed range23 25 C.CONCLUSIONThis paper presented a set of methods and tools to incorporate “digital twins” of real buildings into existingSCADA systems. We proposed a data-driven modelingapproach using Gaussian Process to quickly and inexpensively capture a model of a building solely from its measurement data. This type of models, called D models,together with EnergyPlus (E ) models of buildings serve as“digital twins” of the buildings. In addition to requiringsignificantly lower cost and effort to develop, compared toE models, D models are more suitable for Model Predictive Control (MPC) and
Building Energy Management Systems (BEMS). Although expensive to build, the E models are useful to simulate the behavior of the building. For example, build- ing . machine learning models are written in Python, we develop a library to interface Python and EnergyPlus called pyEp, an equivalent to MLE for Python. We show how this library