Transcription
Lifecycle ofmachine learningmodels
1IntroductionMachine learning is an area that enterprisesare increasingly investing in or identifying as apotential area of growth. There are many reasonsenterprises invest in machine learning, from beingable to leverage data to find insights about theircustomers to making processes more efficient. Inthis book, we break down how machine learningmodels are built into six steps: data access andcollection, data preparation and exploration,model build and train, model evaluation, modeldeployment, and model monitoring.Steps of building machine learning modelsData access and collectionIIIModel monitoringData preparation and explorationVIBuilding a machine learning model is an iterativeprocess. Many of the steps needed to builda machine learning model are reiterated andmodified until data scientists are satisfied withthe model performance. This process requires agreat deal of data exploration, visualization andexperimentation as each step must be explored,modified and audited independently.IIIModel deploymentVIVModel evaluation2/Model build and train
I. Data accessand collectionThe first step to a machine learning problem isaccessing the data. Typically, data scientists willobtain the data for the business problems theyare working on by querying the databases wheretheir companies store their data. In addition, thereis a lot of value in unstructured datasets that donot fit well into a relational database (e.g. logs,raw texts, images, videos, etc.). These datasetsare heavily processed via Extract, Transform, Load(ETL) pipelines written by data engineers anddata scientists. These datasets either reside in adata lake or in a database (either relational or not).When data scientists do not have the data neededto solve their problems, they can get the data byscraping data from websites, purchasing data fromdata providers or collecting the data from surveys,clickstream data, sensors, cameras, etc.3/
II. Data preparation and explorationAfter getting the data, data scientists have toprepare the raw data, perform data exploration,visualize data, transform data and possibly repeatthe steps until it’s ready to use for modeling. Datapreparation is cleansing and processing raw databefore analysis. Before building any machinelearning model, data scientists need to understandthe available data. Raw data can be messy,duplicated or inaccurate. Data scientists explorethe data available to them, then cleanse the databy identifying corrupt, inaccurate and incompletedata and replacing or deleting it.In addition, data scientists need to determine ifthe data has labels or not. For example, if youhave a series of images and you want to developa detection model to determine whether thereis a car in the image, you need to have a set ofimages labeled whether there is a car in themand most likely need bounding boxes around thecars in the images. If the images lack labels, datascientists will have to label them. There are opensource tools and commercial vendors that provideplatforms for data labeling, as well as humanlabelers for hire.After data is cleansed, data scientists explorethe features (or the variables) in their dataset,identify any relationship between the featuresand make decisions about any necessary data4/transformations. There are various tools datascientists can use for exploratory data analysis inopen source libraries and analytics/data scienceplatforms. A tool that performs statistical analysisof the dataset and creates data visualizations togenerate plots of the features is useful in this step.It is important to see what types of features arein the dataset. Features can be numerical, whichcan be a floating point or integer. Categoricalfeatures have a finite number of possible values,typically assigning data into groups. For example,if you have a dataset from a customer survey,the respondent’s gender (male or female) isa categorical feature. Ordinal features are acategorical feature with a set order or scale. Forexample, customer satisfaction response: verysatisified, satisfied, indifferent, dissatisfied, andvery dissatisfied has a set order to it. You canconvert that ordering into an integer scale (1- 5).After determining what kind of features there are,obtaining a distribution of values that each of thefeature has and getting summary statistics of eachfeature would be next. Doing so would help answerthe following questions about the dataset: Are there missing values or invalid values suchas null? If so, how many are there? Are there outliers in the dataset?taking the mean value, the median, the mode,nearby entry’s value and average of nearbyentries’ values.During the data exploration step, it is helpfulto plot the features and also plot the featuresagainst each other to identify patterns in thedataset. This helps to determine the need for datatransformation. Some of the questions you needto answer are: How will you handle outliers? How do you handle missing values? Do youwant to fill in the values and if so, what approach do you plan to take to fill in for themissing value? Some approaches include What is your approach to a long tail of categorical values? Do you use them as-is, group themin some meaningful way or ignore a subset ofthem altogether? Are some of your features correlated witheach other? Do you need to normalize the dataset or perform some other transformation to rescale thedata (e.g. log transformation)?Summary statistics and visualization of features in a dataset of three types of wine and features of each wine. Is the dataset skewed towards a range of valuesor a subset of categories? What are the minimum, maximum, mean, median and mode values of the feature?Source: Scikit Learn Library https://scikit-learn.org/, Visualizationperformed with Oracle CloudInfrastructure Data Science nce/using/data-science.htm
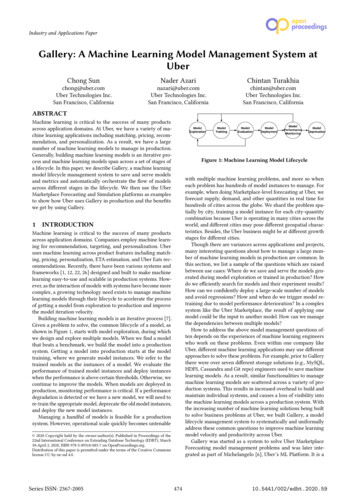
Heatmap of how correlated the features are to each other, from a dataset with three types of wine and features of each wine.— 0.30target —alcohol —— 0.25malic acid —ash —— 0.20alcalinity of ash —magnesium —— 0.15total phenols —flavanoids —— 0.10nonflavanoid phenols —proanthocyanins —— 0.05color intensity —hue —— 0.00od280/od315 of diluted wines —5/proline —od280/od315 of diluted wines —hue —color intensity —proanthocyanins —flavanoids —total phenols —magnesium —alcalinity of ash —ash —malic acid —nonflavanoid phenols —Source: Scikit Learn Library https://scikit-learn.org/,Visualization performed with Oracle Cloud InfrastructureData Science ce/using/data-science.htmalcohol —target —proline —During the data exploration step, you can identifypatterns in your dataset for ideas about how todevelop new features that would better representthe dataset. This is known as feature engineering.For example, if you have a traffic dataset for thenumber of vehicles passing through a majorintersection at every hour, you might want tocreate a new feature categorizing the hour intodifferent parts of the day, such as early morning,mid-morning, early afternoon, late afternoon,and nighttime.For categorical features, often it is necessary toone hot encode the feature. One hot encodingmeans turning a categorical feature intobinary features, one for each of the categories.For example, suppose you have a dataset ofcustomers, and we have a feature on which statesthe customer comes from: Washington, Oregon,and California. One hot encoding would producetwo binary features where one feature is whethera customer is from Washington state or not, andthe second feature is whether a customer is fromOregon or not. It is assumed that if the customeris not from Washington or Oregon, he / shewould be from California, so there is no need fora third feature.
III. Model build and trainModel build consists of choosing the correctmachine learning models to solve the problemsand features that go into the models. In the firststep of model build, data scientists need to decidewhat might be the appropriate machine learningmodel to solve the problem. There are two maintypes of machine learning models: supervisedand unsupervised. Supervised learning involvesmodeling a set of input data to an output or alabel. Classification and regression are supervisedlearning problems. Unsupervised learninginvolves modeling a set of input data without alabel. For example, customer segmentation is anunsupervised learning problem. You do not know apriori what customer segment a customer belongsto. The segment will be assigned by the model.Different classes of machine learning modelsare used to solve unsupervised and supervisedlearning problems. Typically, data scientists willtry multiple models and algorithms and generatemultiple model candidates. Data scientists do notknow a priori what model will perform best onthe dataset, so they experiment with several ofthem. During the model training, a data scientistmight do feature selection which is the process ofselecting only a subset of features as input to themachine learning model. The benefits of reducing6/the number of input variables are to reducecomputational cost of model training, make themodel more generalizable and possibly improvemodel performance.During the model training, the dataset is split upinto training and testing sets. The training datasetis used to train the model, and the testing datasetis used to see how well the model performs ondata it has not seen. Model evaluation will bediscussed in more detail below.Model hyperparameter tuning is a major task inthe model training process. Models are algorithms,and hyperparameters are the knobs that a datascientist can tune to improve the performance ofthe model. For example, the depth of a decisiontree is a hyperparameter.You can choose to have a very deep or veryshallow decision tree. This will affect the bias andvariance of your model. Bias is the error fromunderfitting or the error from not capturing therelation between the features and the outputs.Variance is the error from overfitting where themodel does well in the training dataset but doesnot perform well to unseen data. Tuning thehyperparameters of a model can be partiallyautomated, although data scientists should alwaysbe involved in the process.Data scientists also have to decide what kind ofcompute resources they need for training theirmodels. You can prepare the data and train themodels locally on your computer. However,depending on how much data there is to prepareand then used to train the model, your computermay not be enough. You may have to transition theworkload to the cloud where you can have accessto a broader selection of computing resourcesincluding GPUs.Some models can be trained faster on specializedhardware (e.g., training perceptrons/deepneural network models on GPUs.) You may alsoexplore distributed training environments thatcan speed up the process, especially when theamount of data cannot fit in the memory of thelargest machine available, through splitting anddistributing the data across multiple machines,or when you want to simultaneously trainmultiple model candidates in parallel onseparate machines.
AutoMLAutoML has garnered quite a bit of attention overthe past few years due to the promise of beingable to make machine learning more accessible toa larger audience. AutoML stands for automatedmachine learning. It automates the process offeature selection, model/algorithm selection,and hyperparameter tuning. It is a feature thatall major data science platforms have. Userscan feed a dataset to AutoML, and it will trainmultiple machine learning models, tune thehyperparameters for those models, and evaluatetheir performance against each other.AutoML can improve the productivity of datascientists by automating the training process.It also allows data analysts and developers tobuild machine learning models without tweakingevery aspect of the model training process thatcomes with data science expertise. Most AutoMLcapabilities support tabular data for classificationand regression problems while others have moreadvanced offerings that support images and textdata, as well as time series forecasting.The drawback to AutoML, or any complicatedmodel, is it can seem like a blackbox solutionmaking it difficult for users to understand how themodels arrive at the predictions. Users should lookto the model explainability offering of the AutoMLsystem to see what capability exists to help usersinterpret the models and understand how theselected models arrive at the predictions.7/Model explanations typically fall into globalexplanation and local explanation. Globalexplanation is understanding the general behaviorof a machine learning model as a whole. Thisincludes explaining how important each featureis in contributing to the model predictions. Localexplanation provides an understanding on whythe machine learning model made a particularprediction for one data sample. For example, whydid a fraud detection algorithm predict a particulartransaction as fraudulent?
IV. Model evaluationROC curve for multiclass classification constructed for the results from a randomforest model on predicting the type of wine from a dataset containingthree types of wine and features of each wine.ROC curveclass 1 —1.03040.00.][1780.][000.0][21.0 —][0][28700.True Positive Rateclass 0 —1][10.8 —0.6 —0.4 —0.2 —Predicted Label1.06]False Positive Rateclass 0 (AUC: 1.000)class 1 (AUC: 0.990)class 2 (AUC: 0.990)Youden’s J StatisticSource: Scikit Learn Library https://scikit-learn.org/, Visualization performed with Oracle Cloud Infrastructure Data Science nce/using/data-science.htm8/1.0 —[10.8 —][00.6 —00.0.4 —]0.2 —[0class 2 —00.class 1 —class 2 —0.0 —0.0 —class 0 —For classification problems, one can use accuracyfor model evaluation, but sometimes it mightnot be the optimal metric choice. If a probleminvolves detecting whether someone has a rareillness, a better metric might be how many peoplewith the illness are accurately diagnosed dividedby all the people with the illness. In that case, itwould be more useful to look at a confusion matrixwhich shows the number of true positives, truenegatives, false positives, and false negatives,and calculate precision and recall. For regressionproblems, you can use metrics such as root-meansquare error, mean absolute error or calculate thecoefficient of determination r2. For unsupervisedproblems, a set of clusters with high cohesionwithin the clusters and separation between theclusters is considered ideal. This can be measuredwith metrics such as silhouette score and CalinskiHarabasz coefficient.Confusion matrix for multiclass classification for the results from a random forestmodel on predicting the type of wine based on the features of a wine, from a datasetcontaining three types of wine and features of each wine.True LabelThere are many open source tools that help datascientists calculate the metrics for evaluatingmachine learning models and help them visualizethe metrics (e.g., AUC-ROC curve, gain and liftcharts.) When evaluating machine learningmodels, data scientists need to decide whichmetrics are important for the business problemthey are trying to solve.
V. Model deploymentAfter the model training and evaluation processesare complete, the best candidate models aresaved. Models are usually saved in Pickle, ONNXand PMML format. Depending on the objectives,data scientists might work on a machine learningproblem for proof of concept, experimentationor to deploy it to production. Model deploymentis consuming the predictions made by themachine learning model in some way. Most likely,the pipeline of data transformations have to bedeployed also. Typically, data scientists will workwith engineers on model deployment.Depending on how you intend to consume thepredictions, you can deploy for batch consumptionor real time consumption. For batch consumption,the predictions can be scheduled (e.g., every hour,every day.) The predictions can then be stored ina database and consumed by other applications.Typically, the amount of data you process is largerthan for real-time prediction. A use case wouldbe if you run an e-commerce site and you wantto send a weekly email to the customers aboutrecommended products for them based on pastpurchases. The machine learning models can bescheduled to run ahead of time.9/For real-time consumption, a trigger would initiatethe process of using the persisted model to servea prediction. For example, deciding whether atransaction is fraudulent or not when payment isinitiated, requires real-time prediction. You haveto consider how quickly you have to serve thepredictions (milliseconds, seconds?), the volumeof demand for the service, and the size of data torun predictions on. Minimizing latency to serveprediction is important. You can improve theserving latency by using a smaller model in size,using accelerators such as GPU and improvinghow features related to the entity are retrieved forreal-time prediction (e.g. If you are recommendingproducts to a user as the user is browsinga site, improvements on how informationon past purchases of the user is fetchedcan improve the latency.)There are different tools and cloud platformofferings for model deployment such asFunctions-as-a-Service (FaaS) platforms,fully managed deployment of modelsas HTTP endpoints, DIY with flask orDjango in a container orchestrationplatform such as k8 and dockerswarm, etc.
VI. Model monitoringModel monitoring is a challenging step that issometimes forgotten by organizations withoutmature machine learning and data scienceinitiatives. Model retraining and redeploymentrequires time from the data science andengineering team and compute resources. Modelmonitoring helps the team decide if and when itis necessary to retrain the model and redeploy.Model monitoring can be broken down into twocomponents: drift/statistical monitoring of themodel performance and ops monitoring.After models are deployed, the metrics by whichthe models were measured and trained go down inproduction. This is because data is non-stationary.The non-stationarity can manifest in many ways:features in production data can take values outsideof the range in the training dataset; there can be aslow drift in the distribution of the values, etc.Because of the model degradation, the qualityof the models need to be monitored to decideif and when to retrain the model and redeploy.Sometimes, it is not possible to immediatelyobtain the prediction accuracy of live data goingto a production system. For example, it mighttake some time before you can decide whether a10/churn prediction model or a fraud detection modelprovided an accurate prediction. However, it ispossible to look at the statistics and distributionof the training data compared to live data and alsocompare the distribution of the model predictionswith training and live data. For example, if youare working with a customer churn model, youcan compare the features of your customers usedto train your model compared to the features ofcustomers in the production system. Also, you canlook at the percentage of customers predicted tochurn in the training sample compared to the liveproduction.Ops monitoring of the machine learning system willrequire partnership between the data scientists andengineering team. Things to monitor include servinglatency, memory/CPU usage, throughput and systemreliability. Logs and metrics need to be set up fortracking and monitoring. Logs contain records ofevents, along with the time when they occurred.They can be used to investigate specific incidentsand figure out the cause of the incident. Kibana isan open-source tool used for searching and viewinglogs. Metrics measure the usage and behavior ofthe machine learning system. Prometheus andGrafana are tools for monitoring metrics.
ConclusionWe hope this has been a useful guide on the stepsit takes to build a machine learning model. It isimportant to remember that machine learning isa very iterative process, and the steps outlined inthis book will be reiterated and improved uponmany times.There are many resources available that divedeeper into each of the steps covered in this book,and you can learn more about them as you makedecisions about your enterprise’s data sciencestrategy. If you’re ready to get started, Oracleoffers hands-on labs so you can experiment withbuilding your own data science models.11/
Oracle corporationWorldwide headquarters500 Oracle Parkway, Redwood Shores, CA 94065, USAWorldwide inquiriesTele 1.650.506.7000 1.800.ORACLE1Fax 1.650.506.7200oracle.comConnect with usCall 1.800.ORACLE1 or visit oracle.com. Outside North America,find your local office at .com/oracletwitter.com/oracleAuthorWendy Yip, Data Scientist.Copyright 2020, Oracle and/or its affiliates. All rights reserved. This document is provided for information purposes only, and the contentshereof are subject to change without notice. This document is not warranted to be error-free, nor subject to any other warranties or conditions,whether expressed orally or implied in law, including implied warranties and conditions of merchantability or fitness for a particular purpose.We specifically disclaim any liability with respect to this document, and no contractual obligations are formed either directly or indirectly bythis document. This document may not be reproduced or transmitted in any form or by any means, electronic or mechanical, for any purpose,without our prior written permission.Oracle and Java are registered trademarks of Oracle and/or its affiliates. Other names may be trademarks of their respective owners.Intel and Intel Xeon are trademarks or registered trademarks of Intel Corporation. All SPARC trademarks are used under license and aretrademarks or registered trademarks of SPARC International, Inc. AMD, Opteron, the AMD logo, and the AMD Opteron logo are trademarksor registered trademarks of Advanced Micro Devices. UNIX is a registered trademark of The Open Group 05.10.19.
this book, we break down how machine learning models are built into six steps: data access and collection, data preparation and exploration, model build and train, model evaluation, model . deployment, and model monitoring. Building a machine learning model is an iterative process. Many of the steps needed to build a machine learning model are .