Transcription
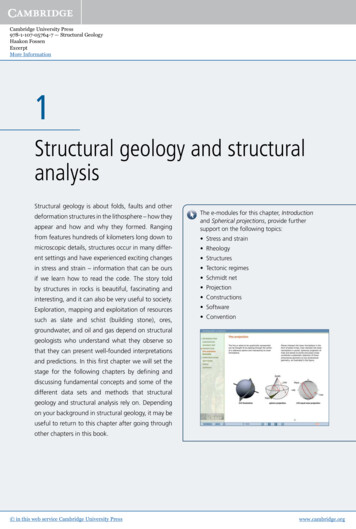
Cambridge University Press978-1-107-05764-7 — Structural GeologyHaakon FossenExcerptMore Information1Structural geology and structuralanalysisStructural geology is about folds, faults and otherappear and how and why they formed. RangingThe e-modules for this chapter, Introductionand Spherical projections, provide furthersupport on the following topics:from features hundreds of kilometers long down to Stress and strainmicroscopic details, structures occur in many differ- Rheologyent settings and have experienced exciting changes Structuresin stress and strain – information that can be ours Tectonic regimesif we learn how to read the code. The story told Schmidt netby structures in rocks is beautiful, fascinating and Projectioninteresting, and it can also be very useful to society. ConstructionsExploration, mapping and exploitation of resources Softwaresuch as slate and schist (building stone), ores, Conventiondeformation structures in the lithosphere – how theygroundwater, and oil and gas depend on structuralgeologists who understand what they observe sothat they can present well-founded interpretationsand predictions. In this first chapter we will set thestage for the following chapters by defining anddiscussing fundamental concepts and some of thedifferent data sets and methods that structuralgeology and structural analysis rely on. Dependingon your background in structural geology, it may beuseful to return to this chapter after going throughother chapters in this book. in this web service Cambridge University Presswww.cambridge.org
Cambridge University Press978-1-107-05764-7 — Structural GeologyHaakon FossenExcerptMore Information2Structural geology and structural analysis1.1 Approaching structural geologyWhat can today be defined as modern structural geologywas born out of field observations. Today indirect observations can also be made from remote data such as seismic data and satellite data, but the fact that observationstrigger questions in the mind of the open-minded studentremains the same. Answers can be sought through morecareful and systematic observations, which commonly involve field measurements, thin section studies, plotting andanalyzing structural data, utilize more advanced methodssuch as radiometric dating, and so on. In addition, we canset up physical experiments in the lab or use numericalmodeling to further explore and test our hypotheses.Each of the different methods that structural geologistsuse in their pursuit of a satisfactory answer has its advantages and limitations. Observations of structures, be it inthe field or from remote sensing imagery, portray the finalresults of deformation processes, while the actual deformation history is, in most cases, unknown. The evolutionof structures through progressive deformation can be observed in laboratory experiments, but how representativeare such minute-, hour- or perhaps week-long observations of geologic histories that span thousands to millionsof years in nature? And how well do meter-scale modelsreproduce kilometer-scale natural examples? Numericalmodeling, where we use computers, physics and mathematical equations to model deformation, is hampered bysimplifications required for the models to be runable withtoday’s codes and computers. Besides, input parameterssuch as material properties or preexisting heterogeneitiesmay be uncertain. Nevertheless, by combining differentapproaches we are able to obtain realistic models of howstructures can form and what they mean. Field studieswill always be important, as any modeling, numerical orphysical, must be based directly or indirectly on accurateand objective field observations and descriptions. Objectivity during fieldwork is both important and challenging,and field studies in one form or another are the main reason why many geologists choose to become geoscientists!1.2 Structural geology and tectonicsThe word structure is derived from the Latin word struere, to build, and we could say:A geologic structure is a geometric configuration ofrocks, and structural geology deals with the geometry,distribution and formation of structures.It should be added that structural geology onlydeals with structures created during rock deformation, in this web service Cambridge University Pressnot with primary structures formed by sedimentary ormagmatic processes. However, deformation structurescan form through the modification of primary structures, such as folding of bedding in a sedimentary rock.The closely related word tectonics comes from theGreek word tektos, and both structural geology and tectonics relate to the building and resulting structure of theEarth’s lithosphere, and to the motions that change andshape the outer parts of our planet. We could say that tectonics is more closely connected to the underlying processes that cause structures to form:Tectonics is connected with external and often regionalprocesses that generate a characteristic set of structuresin an area or a region.By external we mean external to the rock volume that westudy. External processes or causes are in many cases platemotions, but can also be such things as forceful intrusionof magma, gravity-driven salt or mud diapirs, flowing glaciers and meteor impacts. Each of these “causes” can create characteristic structures that define a tectonic style,and the related tectonics can be given special names. Platetectonics is the large-scale part of tectonics that directly involves the movement and interaction of lithosphericplates. Within the realm of plate tectonics, expressionssuch as subduction tectonics, collision tectonics and rifttectonics are applied for more specific purposes.Glaciotectonics is the deformation of sediments andbedrock (generally sedimentary rocks) at the toe of an advancing ice sheet. In this case it is the pushing of the icethat creates the deformation, particularly where the baseof the glacier is cold (frozen to the substrate).Salt tectonics deals with the deformation caused bythe (mostly) vertical movement of salt through its overburden (see Chapter 20). Both glaciotectonics and salttectonics are primarily driven by gravity, although salttectonics can also be closely related to plate tectonics. Forexample, tectonic strain can create fractures that enablesalt to gravitationally penetrate its cover, as discussedin Chapter 20. The term gravity tectonics is generallyrestricted to the downward sliding of large portions ofrocks and sediments, notably of continental margin deposits resting on weak salt or overpressured shale layers.Raft tectonics is a type of gravity tectonics occurring insuch environments, as mentioned in Chapter 20. Smaller landslides and their structures are also considered examples of gravity tectonics by some, while others regardsuch surficial processes as non-tectonic. Typical nontectonic deformation is the simple compaction of sediments and sedimentary rocks due to loading by youngersedimentary strata.www.cambridge.org
Cambridge University Press978-1-107-05764-7 — Structural GeologyHaakon FossenExcerptMore Information1.2 Structural geology and tectonicsNeotectonics is concerned with recent and ongoingcrustal motions and the contemporaneous stress field.Neotectonic structures are the surface expression of faultsin the form of fault scarps, and important data sets stemfrom seismic information from earthquakes (such as focalmechanisms, Box 10.1) and changes in elevation of regions detected by repeated satellite measurements.At smaller scales, microtectonics describes microscaledeformation and deformation structures visible under themicroscope.Structural geology typically pertains to the observation, description and interpretation of structures that canbe mapped in the field. How do we recognize deformation or strain in a rock? “Strained” means that somethingprimary or preexisting has been geometrically modified,be it cross stratification, pebble shape, a primary magmatic texture or a preexisting deformation structure. Hencestrain can be defined as a change in length or shape, andrecognizing strain and deformation structures actuallyrequires solid knowledge of undeformed rocks and theirprimary structures.steeper dips down section. There is also a facies variation,with the coarsest-grained deposits forming near the fault,which can be attributed to the fault-induced topographyseen in Figure 1.1.Another close relationship between tectonics and rockforming processes is shown in Figure 1.2, where forcefulrising and perhaps inflating of magma deforms the outerand oldest part of the pluton and its country rock. Forceful intrusion of magma into the crust is characterized bydeformation near the margin of the pluton, manifested byfolding and shearing of the layers in Figure 1.2. Ellipsesin this figure illustrate the shape of enclaves (inclusions),and it is clear that they become more and more elongatedas we approach the margin of the pluton. Hence, the outer part of the pluton has been flattened during a forcefulintrusion history.RimsynclineBeing able to recognize tectonic deformation depends onour knowledge of primary ratigraphicthinningMesoproterozoicThe resulting deformation structure also depends onthe initial material and its texture and structure. Deforming sandstone, clay, limestone or granite results insignificantly different structures because they responddifferently. Furthermore, there is often a close relationship between tectonics and the formation of rocks andtheir primary structures. Sedimentologists experiencethis as they study variations in thickness and grain size inthe hanging wall (down-thrown side) of syndepositionalfaults. This is illustrated in Figure 1.1, where the gradualrotation and subsidence of the down-faulted block givesmore space for thicker strata near the fault than fartheraway, resulting in wedge-shaped strata and progressively3Archaean?3 kmFigure 1.2 Structural geology can be linked to processes andmechanisms other than plate stresses. This illustration of agranodioritic pluton southwest of Beijing, China, portrays theclose connection between forceful intrusion of magma, strainand folds in the country rock. Black ellipses indicate strain,as discussed in Chapters 2 and 3. The strain (deformation)pattern within and around the pluton can be explained in termsof diapirism, where the intrusion ascends and squeezes andshears its outer part and the surrounding country rock to createspace. Based on He et al. (2009).Half-graben igure 1.1 Illustration of the close relationship between sedimentary facies, layer thickness variations and syndepositional faulting(growth faults) in an area of active crustal extension. in this web service Cambridge University Presswww.cambridge.org
Cambridge University Press978-1-107-05764-7 — Structural GeologyHaakon FossenExcerptMore Information4Structural geology and structural analysisMetamorphic growth of minerals before, during, andafter deformation may also provide important information about the pressure–temperature conditions duringdeformation, and may contain textures and structuresreflecting kinematics and deformation history. Hence,sedimentary, magmatic and metamorphic processes mayall be closely associated with the structural geology of alocality or region.These examples relate to strain, but structural geologists, especially those dealing with brittle structures ofthe upper crust, are also concerned with stress. Stress isa somewhat diffuse and abstract concept to most of us,since it is invisible. Nevertheless, there will be no strainwithout a stress field that exceeds the rock’s resistanceagainst deformation. We can create a stress by applying aforce on a surface, but at a point in the subsurface stressis felt from all directions, and a full description of sucha state of stress considers stress from all directions andis therefore three-dimensional. There is always a relationship between stress and strain, and while this relationshipmay be easy to establish from controlled laboratory experiments, it may be difficult to extract from naturallyformed deformation structures.Structural geology covers deformation structuresformed at or near the Earth’s surface, in the cool, upperpart of the crust where rocks have a tendency to fracture,in the hotter, lower crust where the deformation tendsto be ductile, and in the underlying mantle. It embracesstructures at the scale of hundreds of kilometers down tomicro- or atomic-scale structures, structures that form almost instantaneously, and structures that form over tensof millions of years.A large number of subdisciplines, approaches andmethods therefore exist within the field of structuralgeology. The oil exploration geologist may be consideringtrap-forming structures formed during rifting or salt tectonics, while the production geologist worries about subseismic sealing faults (faults that stop fluid flow in porousreservoirs; Section 8.7). The engineering geologist mayconsider fracture orientations and densities in relationto a tunnel project, while the university professor mayuse structural mapping, physical modeling or computermodeling to understand mountain-building processes.The methods and approaches are many, but they serve tounderstand the structural or tectonic development of aregion or to predict the structural pattern in an area. Inmost cases structural geology is founded on data and observations that must be analyzed and interpreted. Structural analysis is therefore an important part of the field ofstructural geology.Structural data are analyzed in ways that lead to a tectonic model for an area. By tectonic model we mean a in this web service Cambridge University Pressmodel that explains the structural observations and putsthem into context with respect to a larger-scale process,such as rifting or salt movements. For example, if we mapout a series of normal faults indicating E–W extension inan orogenic belt, we have to look for a model that can explain this extension. This could be a rift model, or it couldbe extensional collapse during the orogeny, or gravitydriven collapse after the orogeny. Any kind of relevantdata, such as relative age relations, radiometric dates, evidence for magmatism, and stratigraphic thickness andfacies variations, are used as we search for the model thatbest fits the data. It may be that several models can explain a given data set, and we should always look for andcritically evaluate alternative models. In general, a simplemodel is more attractive than a complicated one.1.3 Structural data setsPlanet Earth represents an incredibly complex physical system, and the structures that result from naturaldeformation reflect this fact through their multitude ofexpressions and histories. There is thus a need to simplifyand identify the one or few most important factors thatdescribe or lead to the recognition of deformation structures that can be seen or mapped in naturally deformedrocks. Field observations of deformed rocks and theirstructures represent the most direct and important sourceof information on how rocks deform, and objective observations and careful descriptions of naturally deformedrocks are the key to understanding natural deformation.Indirect observations of geologic structures by means ofvarious remote sensing methods, including satellite dataand seismic surveying, are becoming increasingly important in our mapping and description of structures andtectonic deformation. Experiments performed in the laboratory give us valuable knowledge of how various physical conditions, including stress field, boundary condition,temperature or the physical properties of the deforming material, relate to deformation. Numerical models,where rock deformation is simulated on a computer, arealso useful as they allow us to control the various parameters and properties that influence deformation.Experiments and numerical models not only help usunderstand how external and internal physical conditionscontrol or predict the deformation structures that form,but also give information on how deformation structuresevolve, i.e. they provide insights into the deformation history. In contrast, naturally deformed rocks represent endresults of natural deformation histories, and the historymay be difficult to read out of the rocks themselves. Numerical and experimental models allow one to controlrock properties and boundary conditions and explorewww.cambridge.org
Cambridge University Press978-1-107-05764-7 — Structural GeologyHaakon FossenExcerptMore Information1.4 Field datatheir effect on deformation and deformation history.Nevertheless, any deformed rock contains some information about the history of deformation. The challengeis to know what to look for and to interpret this information. Numerical and experimental work aids in completing this task, together with objective and accurate fieldobservations.Numerical, experimental and remotely acquired datasets are important, but should always be based on fieldobservations.1.4 Field dataIt is hard to overemphasize the importance of traditionalfield observations of deformed rocks and their structures.Rocks contain more information than we will ever be ableto extract from them, and the success of any physical ornumerical model relies on the quality of observation of realrock structures. Direct contact with rocks and structures5that have not been filtered or interpreted by other people’sminds or computers is invaluable (Figure 1.3).Unfortunately, our ability to make objective observations is limited. What we have learned and seen in thepast strongly influences our visual impressions of deformed rocks. Any student of deformed rocks shouldtherefore train himself or herself to be objective. Onlythen can we expect to discover the unexpected and makenew interpretations that may contribute to our understanding of the structural development of a region and tothe field of structural geology in general. Structures canbe overlooked until the day that someone points out theirexistence and meaning, upon which they all of a suddenstart to appear “everywhere”. Shear bands in strongly deformed ductile rocks (mylonites) are one such example(Figure 16.25). They were either overlooked or consideredas cleavage until the late 1970s, when they were properlydescribed and interpreted. Since then, they have been described from almost every major shear zone or mylonitezone in the world.Figure 1.3 Direct contact with rocks is important. Make sure you enjoy many days in the field every year where you allow for opendiscussions and new ideas. Here Donna Whitney and Christian Teyssier are discussing gneissic structures in the ScandinavianCaledonides. in this web service Cambridge University Presswww.cambridge.org
Cambridge University Press978-1-107-05764-7 — Structural GeologyHaakon FossenExcerptMore Information6Structural geology and structural analysisFieldwork starts with visual observations and sketching(Figures 1.3 and 1.4). It then involves the use of basic toolssuch as a hammer, measuring device, topomaps, a hand lensand a compass, a camera, and the data collected are mainlystructural orientations and samples for thin section studies.Global positioning system (GPS) units and high-resolutionaerial and satellite photos are important tools, and more advanced and detailed work may involve the use of a portablelaser-scanning unit, where pulses of laser light strike thesurface of the Earth and the time of return is recorded.MappingA topographic map onto which geologic contacts, locality numbers and orientation measurements can be added has always been essential to the field geologist. Themodern field geologist is more likely to take advantage ofdigital maps and high-resolution digital satellite imagesand aerial photos that let you map structures and collect,plot and evaluate data more effectively by means of smartphones, tablets and more specialized digital devices withGPS capabilities. This makes for accurate positioning andmore efficient data collection. However, the basic concepts remain the same.Sketching and photographingIn many cases, the most important way of recording fielddata is by making careful field sketches aided by photographs, orientation measurements and other measurements that can be related to the sketch. Sketching alsoforces the field geologist to observe features and detailsFigure 1.4 Sketching is an important field activity that serves several purposes. It makes you a better observer, gives you ideas,and helps you remember the outcrop. A sketch can be a reproduction of an outcrop where geologic structures are emphasized overuninteresting features (such as vegetation), or more of a principle sketch that illustrates concepts and models. This student sketch (byGijs Henstra) is an example from a field trip to southern Utah. in this web service Cambridge University Presswww.cambridge.org
Cambridge University Press978-1-107-05764-7 — Structural GeologyHaakon FossenExcerptMore Information1.4 Field datathat may otherwise be overlooked. Even making a drawing from a good field photograph can reveal features thatwould otherwise have gone unnoticed. Another use ofsketches is to emphasize relevant information and tonedown or neglect irrelevant details. Many of us find it useful to make an overview field sketch in order to get theoverview of an outcrop. A more detailed drawing of particularly interesting structures or parts of the outcrop canthen be made. It is always a good idea to back up sketches with pictures, most conveniently with a camera with abuilt-in or external GPS unit. Field sketching is, largely, amatter of practice.Taking measurementsThere are a variety of manual compasses available tomeasure planar and linear structures, and we will not gothrough the details of how to use them here. In addition,there are several apps for smartphones that can be veryuseful (see online resources for more information). Theseapps allow you to easily measure, plot and directly orindirectly present measurements on maps or images, but they have their own shortcomings with respectto accuracy, battery power, etc. that must be taken intoaccount. Unfortunately, different notations are being usedfor orientation measurements. In particular, planes canbe represented by their strike/dip values, or by dip anddip direction (dip azimuth), and although conversion issimple, unambiguous field notes are important to avoidconfusion.Many geologists denote the orientation of a plane by itsstrike and dip. Strike is the intersection between our planeand the horizontal plane, and the strike value is the anglebetween the strike and north. This can be representedby either of two conjugate angles, which in the exampleshown in Figure 1.5 are 060 and 240, respectively. I use the(American) right-hand rule, which says that when youlook in the “correct” strike direction, the plane should bedipping to the right. Or, with respect to your right hand; ifyour right-hand thumb is pointing in the strike direction,your fingers should be pointing in the direction of dip.In our example, the plane dips to the right when lookingtoward 060, not toward 240. Hence, the orientation of theplane can be denoted 060/30. We always use three digitsfor strike to avoid confusion with the dip value. It may alsobe a good idea to denote the direction of dip, in our caseto the SE. Now our plane is denoted 060/30 SE. Addingdirection (SE) also distinguishes it from a lineation measurement. You may also see this orientation written as N060 E/30 SW, meaning that the strike direction is 60 E ofN. Planar structures are plotted as great circles or as polesto planes in spherical projection diagrams (Appendix B).Strike directions are sometimes represented by means ofrose diagrams, particularly for fractures (see Appendix B).A plane can also be described by its dip direction. Thedip value is the same as above, but the strike value is nowexchanged for dip azimuth, or the horizontal directionin which our plane is dipping. So if our plane is dippingtoward 150 (to the SE), its orientation is denoted 150/45or 45/150. Basically this adds 90 to our strike angle, soit is easy to go between the two, but also easy to confuseif you get data from other geologists. Dip directions areplotted as poles in spherical projections, since they areeffectively lines.Linear structures are represented by their trend andplunge, where the trend is the projection of the linear structure onto the horizontal plane, and the plunge is the angleBedding, inclinedProjection of lineationonto horizontalplaneTrend (190)Bedding, invertedPlunge (24 )Bedding, verticalDip azimuth:horizontal lineperpend.to strike(150)Bedding, horizontalDipdirection(150/30)Strike(060)Dip (30 )Foliation, inclinedFoliation, verticalCleavage, inclinedNLineation7Figure 1.5 Description offoliation and lineation inan outcrop, together withsome commonly used mapsymbols. The box shows howthe foliation and lineationin the figure may appearon a map and as equal-areaprojections.Cleavage, verticalLineationNThrustfaultN06030 Normalfault (alternativenotations)Fol.24 Lin.Lineation, horizontalFoliation and lineation,same plane of beddingFoliation and lineation,same plane of foliationFold axis, inclinedAnticline in this web service Cambridge University PressSynclineFold axis, horizontalwww.cambridge.org
Cambridge University Press978-1-107-05764-7 — Structural GeologyHaakon FossenExcerptMore Information8Structural geology and structural analysisbetween this line and the lineation. In some cases pitch ismeasured, as explained in Appendix B. Linear structuresare represented by poles in spherical projections.Magnetic declination is the difference between trueand magnetic north, which can be quite significant insome places and must be accounted for. It can be doneby adjusting your manual compass (but remember toreadjust when moving to a different area) or the measurements can be adjusted later (in a spreadsheet or byrotating the data in a spherical projection program). Ifyou are using a smartphone app, it may or may not automatically correct for declination.Spherical projectionsOrientation data are plotted on spherical projections(equal angle or area) and rose diagrams, and smartphonecompass apps automatically plot data on the screen so thatwe can immediately evaluate the results and, if necessary,add measurements. Convenient plotting applications areavailable into which data can be entered or imported fromhandheld devices. However, it is absolutely necessary tounderstand spherical projections in order to make full useof the plots that they produce. Hence, review the basicsof plotting orientation data on equal angle and areadiagrams, as presented in Appendix B and the e-moduleSpherical projections.ScanlinesScanlines are lines across structures such as fractures ordeformation bands, where the location of each structureor number of structures per meter is recorded. Scanlinedata can be collected by stretching out a measuring tapeacross the structures of interest, or from cores or boreholeimage data. Such data can be plotted in frequency graphssuch as that shown in Figure 9.13. Note that it is commonly desirable to measure perpendicular to structures,and where this is not possible, to make a simple geometriccorrection so that true spacing, for example of a joint set,can be found.Geologic mapsGeologic maps are important presentations of structuresas they are supplied with symbols representing variousplanar and linear structures. The use of symbols differs,and some common ones are shown in Figure 1.6. Eachgeological survey seems to have their own set of symbols,in addition to the great variation between individual authors. Hence, the symbols used must be explained in thelegend of the map.While mapping used to involve paper and pencils, manygeologists now draw contacts and add measurements in this web service Cambridge University Pressdigitally on handheld devices in the field. Also, geologicfield data are commonly presented on three-dimensional(3-D) models (such as Google Earth), where geologiccontacts and orientation data are projected onto elevationmodels aided with remote sensing images.Cross-sectionsA geologic map is not complete without one or morecross-sections (Figure 1.6), which is constructed by making a topographic profile with surface information fromfield observations. Usually the section is chosen in thedip direction of important lithologic boundaries or thefoliation, or perpendicular to major faults or fold hinges,which in many cases captures the tectonic transport direction. The topographic profile is usually constructedfrom digital elevation data. Then, with the aid of geophysical data and well information, the surface informationis extended downward into the subsurface. The sectionshould be restorable to a reasonable pre-deformationalsituation, as discussed in Chapter 21.Collecting oriented samplesIt may be important to know the orientation of a sample, for example for kinematic analysis or for orientedthin sections. To collect an oriented sample, put thesample back in place, draw a strike and dip symbol ona dipping surface of the sample while it is in place, andwrite the strike and dip values on the sample, as shownin Figure 1.7. If there is a lineation it may be useful toalso mark it with an arrow and its trend/plunge, butnote that a lineation by itself does not contain sufficientinformation to reorient the sample. Also add samplenumber and position information, and take a picture ofthe sample in place before putting it into a well-markedsample bag.1.5 Remote sensing and geodesySatellite images, such as those shown in Figure 1.8a and c,are now available at increasingly high resolutions and area valuable tool for the mapping of map-scale structures.An increasing amount of such data is available on theWorld Wide Web, and may be combined with digital elevation data to crea
1.2 Structural geology and tectonics e word structure is derived from the Latin word stru-ere, to build, and we could say: A geologic structure is a geometric con guration of rocks, and structural geology deals with the geometry, distribution and formation of structures. It should be added that structural geology only