Transcription
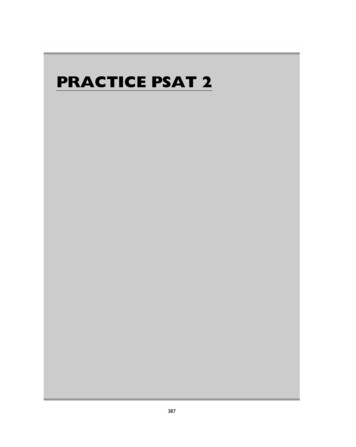
UnderstandingScores2020-21
Contact UsAbout College BoardCollege Board is a mission-driven not-for-profit organization thatconnects students to college success and opportunity. Founded in1900, College Board was created to expand access to higher education.Today, College Board’s membership is made up of over 6,000 of theworld’s leading educational institutions and is dedicated to promotingexcellence and equity in education. Each year, College Board helpsmore than seven million students prepare for a successful transition tocollege through programs and services in college readiness and collegesuccess—including the SAT and the Advanced Placement Program.The organization also serves the education community throughresearch and advocacy on behalf of students, educators, and schools.For further information, visit collegeboard.org.About National Merit ScholarshipCorporation (NMSC)NMSC is an independent, not-for-profit organization that operateswithout government assistance. NMSC conducts the National Merit Scholarship Program, an annual academic competition for recognitionand college scholarships.CONTACTS FORSTUDENTS AND PARENTSpsathelp@info.collegeboard.org866-433-7728 1-212-713-8105 (International)8 a.m. to 7 p.m. ET, Mon.–Fri.GENERAL CONTACTSPSAT/NMSQTP.O. Box 6720Princeton, NJ 08541-6720CONTACTS FOR SAT (7728) 1-212-237-1335 (International)8 a.m.–8 p.m. ET, Mon.–Fri.The Preliminary SAT/National Merit Scholarship Qualifying Test(PSAT/NMSQT ) is the route of entry to the National Merit ScholarshipProgram. Requirements for participation, steps in the competition, andawards offered are explained in the PSAT/NMSQT Student Guide andon NMSC’s website. Further information is provided in the Guide to theNational Merit Scholarship Program.Questions about the scholarship program not answered in thepublished materials should be directed to:National Merit Scholarship Corporation1560 Sherman Avenue, Suite 200Evanston, IL 60201-4897847-866-5100www.nationalmerit.orgAbout the PSAT/NMSQTThe PSAT/NMSQT is cosponsored by College Board and National MeritScholarship Corporation. It is administered for College Board and NationalMerit Scholarship Corporation by Educational Testing Service (ETS). 2020 College Board. College Board, Advanced Placement, AP, SAT, and the acorn logo are registered trademarks of College Board. AP Potential and PSAT are trademarks ownedby College Board. PSAT/NMSQT is a registered trademark of College Board and National Merit Scholarship Corporation. National Merit and the corporate “Lamp of Learning”logo are federally registered service marks of National Merit Scholarship Corporation. All other marks are the property of their respective owners. Visit College Board on the web:collegeboard.org.Khan Academy is a registered trademark in the United States and other jurisdictions.01702-206
PSAT/NMSQTScore Report ResourcesThank you for administering the 2020-21 PSAT/NMSQT at your school.Enclosed are your students’ score reports, with information foryou, your students, and their parents.What’s IncludedWhat’s OnlineThere is one copy each of your students’ score reports forhanding out to your students. Students can use the accesscode on the front cover of their score reports to get theirll report online at psat.org/myscore.At ables-technical-resources (Understanding Scores:PSAT/NMSQT Score Information,) you can find:PSAT/NMSQT Understanding Scores 2020-21This brochure delves deeper into the meaning of yourstudents’ scores, including what the assessment measures,how it is scored, and how you can use the data to monitoryour students’ progress.The brochure also provides:§ An explanation of the NMSC Selection Index score andhow National Merit Scholarship Corporation (NMSC)uses it to determine entry into the National MeritScholarship Program.§ A Sample Score Report and Score Report Case Studyso you can interpret your students’ score reports.§ Percentile tables for total and section scores andinformation about projected SAT scores.§ Answer keys and score conversion tables for theOctober 14 and 29, 2020, tests only (after theOctober 2020 testing period ends). For some test formsgiven in 2020-21, the actual questions, answers, andanswer explanations will not be provided, and the scorereport will not include the correct answer column.At psat.org/resources, you can find:§ An online version of the PSAT/NMSQT UnderstandingScores 2020-21 brochure (Especially for Educators:Scores.)§ Parent Tutorial flyers in English and Spanish (Sharewith Students and Families: Scores)—hand themout to inform parents and students about students’score reports.1
2
The PSAT/NMSQTand the SAT Suiteof AssessmentsThe SAT Suite of AssessmentsThe SAT Suite of Assessments is an integrated system of teststhat includes the SAT (for students in grades 11 and 12), thePSAT/NMSQT and the PSAT 10 (for grades 10 and 11), andthe PSAT 8/9 (for grades 8 and 9).The tests measure the same skills and knowledge in gradeappropriate ways. They work together to show collegereadiness over time so educators, students, and parents canmonitor student progress. Their content reflects the kind ofmeaningful, engaging, and challenging work that studentsfind in the best middle school and high school coursestaught today.What the PSAT/NMSQT MeasuresThe PSAT/NMSQT measures the skills and knowledge thatresearch shows are the most important for success in collegeand career. The Reading Test measures comprehension andreasoning skills and focuses on close reading of passagesin a wide array of subject areas. The Writing and LanguageTest measures a range of skills, including command ofevidence, expression of ideas, and the use of standardEnglish conventions in grammar and punctuation. The MathTest covers a range of math practices, with an emphasis onproblem solving, modeling, using tools strategically, and usingalgebraic structure.How the PSAT/NMSQT Is ScoredStudents receive a total score that is the sum of their scoreson the two sections (Evidence-Based Reading and Writingand Math).To calculate section scores, we first compute the student’sraw score—the number of questions correctly answered—foreach section. Nothing is deducted for incorrect answers or forunanswered questions.Next we convert each of the raw Math scores to a scaledsection score of 160 to 760. We also convert each of the rawReading scores and the raw Writing and Language scoresto scaled test scores of 8 to 38, and then combine theseto produce Evidence-Based Reading and Writing sectionscores of 160 to 760. This conversion process adjusts forslight differences in difficulty among versions of the test andprovides a score that is consistent across different versions.The scaled scores are the scores provided on score reports.How You Can Use theStudent Score ReportThe student score report clearly summarizes a student’scurrent achievement levels and encourages next stepsto increase college and career readiness. You can helpstudents by going over their score reports and helping themunderstand what their scores mean. Here’s how.TALK WITH STUDENTS ABOUT COLLEGE READINESSFor each section, the score report includes an indicatorthat shows whether the student’s score meets the gradelevel benchmark. These benchmarks allow students andeducators to understand how students are progressingtoward college readiness.§ If a student is meeting the benchmark for a section,remind them to continue to take rigorous courses andwork hard to stay on track for college success.§ If a student is not meeting the benchmark for a section,connect them to classroom work that is focused onareas that need improvement. Khan Academy can helpsupplement this work.3
USE STUDENT SCORES TO IDENTIFY STRENGTHSAND WEAKNESSES§ Use test scores, as well as the cross-test scores andsubscores online, to evaluate a student’s relativestrengths and weaknesses and to determine whichskills need practice.§ Use the red/yellow/green coding on section scores toevaluate how your student is performing relative to otherstudents who are meeting or exceeding the benchmark.w Highlight the areas in green as the student’sstrengths.w Prioritize areas in the red range for additional workand practice.HELP STUDENTS DECIDE ON NEXT STEPS§ Work with your students to think of ways to developeach of the skills you have identified for focus andimprovement.§ Encourage students to go online for more details and tolink their College Board account to Khan Academy for afree, personalized study plan.For further guidance on interpreting score reports, see theProfessional Development modules for K–12 educators atsat.org/educators.Score-Reporting FeaturesOn pages 9–10 of this booklet, you’ll find an annotatedsample score report that includes detailed explanations of theinformation that students receive about their college readinessskills. Students can access their online reports to obtain moreinformation and guidance, including free, personalized KhanAcademy instruction and practice based on their results.NOTE: Score reports for schools testing on Saturday,October 17, 2020, testing on Tuesday, January 26, 2021, orparticipating in the test administration study won’t includequestion-level details.The online reporting portal at k12reports.collegeboard.orgoffers you an array of powerful tools to assess your students’progress and plan instruction that delivers what they need.The tools include:§ Flexible reports that can be sorted and filtered by keydemographics.§ Instructional planning support using test subscoresin specific content areas, benchmarks, informationfor cross-subject tasks, and data for prescribinginterventions when students are behind or ahead.§ Question Analysis Report that helps educators connectsubscores to state standards, analyze students’strengths and weaknesses, learn which mistakeswere the most common, and look for opportunities toreinforce skills. (The Question Analysis Report won’t beavailable to schools testing on Saturday, October 17, 2020,testing on Tuesday, January 26, 2021, or participating inthe test administration study.)§ Access to the AP Potential tool to pinpoint studentswho are likely to succeed in more challenging courses.4
PSAT/NMSQTScoresTotal ScoresSubscoresONLINE AND PAPER SCORE REPORTSONLINE SCORE REPORT ONLYThe total score is the sum of the two section scores; its rangeis 320–1520.Section ScoresONLINE AND PAPER SCORE REPORTSYour students receive scores in the range of 160–760 foreach of two sections. The Evidence-Based Reading andWriting section score combines the scores for the ReadingTest and the Writing and Language Test. The Math sectionscore is derived from the Math Test score, including thecalculator and no-calculator portions.Test ScoresONLINE AND PAPER SCORE REPORTSThe range for the following test scores is 8–38:§ Reading§ Writing and Language§ MathCross-Test ScoresONLINE SCORE REPORT ONLYThe range for cross-test scores is also 8–38. These scoresrepresent student performance on select questions acrossthe three tests and show a student’s strengths in thefollowing domains:Subscores in the range of 1–15 offer feedback on studentperformance in the following skill areas:§ Command of Evidence§ Words in Context§ Expression of Ideas§ Standard English Conventions§ Heart of Algebra§ Problem Solving and Data Analysis§ Passport to Advanced MathScore RangesONLINE SCORE REPORT ONLYA student’s ability is better represented by score ranges thanpoints. Score ranges are derived from the standard error ofmeasurement and show how much a student’s scores wouldlikely vary if they took a different administration of the testunder identical conditions.From recent administrations of the PSAT/NMSQT, theseranges are approximately:§ Total: 40 points§ Section: 30 points§ Test scores, subscores, and cross-test scores: 2 points§ Analysis in History/Social StudiesSelection Index§ Analysis in ScienceONLINE AND PAPER SCORE REPORTSReported on a scale ranging from 48 to 228, the SelectionIndex score is calculated by doubling the sum of the Reading,Writing and Language, and Math Test scores. See page 8 formore information.5
Score Scalesand Score ChangesUsing PSAT/NMSQT Scoresto Project SAT ScoresThe SAT Suite—from the PSAT 8/9 through the SAT—uses acommon score scale for the total, section, test, and crosstest scores. The ranges reported for each assessment reflectgrade-level appropriateness within the common scale. Thus,while the total range for the SAT is 400–1600, the total rangefor the PSAT/NMSQT is 320–1520.This common score scale means that a student who took thePSAT/NMSQT and received a Math section score of 500 wouldbe expected to also get a 500 on the SAT or the PSAT 8/9 ifthey had taken either of those tests on that same day; a scoreof 500 represents the same level of academic achievementon all three assessments.This also means that student growth across the SAT Suite iseasy to determine. If a student takes the PSAT/NMSQT thisyear and receives a 500 Math section score, and then takesthe SAT next year and earns a 550 Math section score, thatstudent has shown a growth of 50 points, which likely resultedfrom hard work both in and out of school.The total, section, test, and cross-test scores have beenvertically scaled to allow the accurate measurement ofgrowth from test to test. Encourage students to focus on thesection scores if they are curious about the growth they canexpect to see in their scores over the next year. They shouldlook at the set of projected score ranges provided (only inonline score reports) for students that reflect typical growth.Of course, a student’s individual growth will be shaped bythe courses taken and by the practice the student undertakesbetween assessments.6Subscores (available online only) aren’t on a vertical scale,and therefore comparing performance year after year shouldbe based on relative performance rather than by calculatingstudent growth across tests.Students who wish to improve their performance on the SATshould follow these guidelines:§ Develop academic skills through challengingcoursework.§ Read extensively and develop strong writing skills.§ Engage in deliberate practice in the three math areasthat are emphasized the most in the assessments.§ Take practice tests and upload their results toKhan Academy for free, personalized practice of theskills they need to improve. To learn more, go topsat.org/practice.
Benchmarks andRed/Yellow/Green PerformanceThe PSAT/NMSQTGrade-Level BenchmarksThe SAT Suite offers grade-level benchmarks that canbe used to gauge whether students are on track forbecoming college ready each year in grades 8–12. Gradelevel benchmarks represent the section scores on eachassessment that students should meet or exceed to beconsidered on track to be college ready.The PSAT/NMSQT reports separate benchmarks for 10th and11th graders to help them understand their level of readinessfor college and career training programs. The benchmarkshelp educators better understand how many students andalso which students are on track to have the skills necessaryfor college-entry, credit-bearing courses. Equipped with thisinformation, educators can support students who need extrahelp while there is still time for improvement. Teachers canalso accelerate the progress of students who meet or exceedthe benchmarks.RECOMMENDED USESGrade-level benchmarks can help educators:§ Identify students who are on track for success incollege and career readiness.§ Identify students who may need extra supportwhile there is still time for improvement.§ Find students who may be ready for morechallenging coursework.Grade-level benchmarks shouldn’t be used to assignacademic tracks, to discourage students from pursuingcollege, or to keep students from participating in challengingcourses. Rather, the benchmarks are intended to help allstudents better prepare for life after high school.What the Benchmarks MeanThe College and Career Readiness Benchmarks for thecurrent SAT predict a 75% likelihood of achieving a C orhigher in related first-semester, credit-bearing collegecourses. The benchmarks are set at the section level, so thereis a benchmark for Evidence-Based Reading and Writing anda benchmark for Math.Score reports for the PSAT/NMSQT, PSAT 10, and PSAT 8/9include grade-level benchmarks based on how students growfrom year to year toward the SAT benchmarks.PSAT/NMSQT Grade-Level BenchmarksEvidence-BasedReading and WritingMath10th GradePSAT/NMSQT43048011th GradePSAT/NMSQT460510Additional Information Providedto Help You Understand ProgressToward College ReadinessThe student score report provides further context forunderstanding scores by showing a color-coded bar chartfor the section scores. Students who met or exceeded thebenchmark will be in the green portion of the score band.If students didn’t meet the benchmark but were close(within one year’s growth), their scores will be in the yellowportion. Students who have a score indicating more than ayear’s growth below the grade-level benchmark will have ascore in the red portion of the score band. Additionally, foreach of the test scores and subscores, we have provided acolor-coded guide to a student’s relative strengths (green)and weaknesses (red).7
NMSCSelection IndexThe National Merit Scholarship Program is an annualacademic competition among high school students forrecognition and college scholarships. The program isconducted by National Merit Scholarship Corporation(NMSC), a not-for-profit organization that operates withoutgovernment assistance.The NMSC Selection IndexReported on a scale ranging from 48 to 228, the SelectionIndex score is calculated by doubling the sum of the Reading,Writing and Language, and Math Test scores. For example, aReading score of 23, a Writing and Language score of 20, anda Math score of 26.5 would result in a Selection Index score of139 [2(23 20 26.5)].How NMSC Uses the Selection IndexNMSC uses the Selection Index score to designate groupsof students to receive recognition in the National MeritScholarship Program. Entry to NMSC’s competition forscholarships to be offered in 2022 is determined by students’responses to program entry questions on the 2020PSAT/NMSQT answer sheet. Both the printed PSAT/NMSQTstudent score report and the online report show the student’sSelection Index, the student’s responses to entry items,and whether the student meets participation requirements.Currently, about 1.5 million test takers meet requirements toenter NMSC’s competition each year. Almost all entrants arein their third year (grade 11, junior year) of high school.Of the 1.5 million NMSC program entrants, about 50,000will earn 2020 PSAT/NMSQT scores high enough to qualifythem for recognition. These students will be notified of theirstanding through their high schools in September 2021.Students who qualify to continue in the competition forscholarships to be offered in 2022 must then meet academicand other requirements specified by NMSC to be consideredfor awards.8A detailed description of the National Merit ScholarshipProgram is published in the Guide to the National MeritScholarship Program, mailed to high school principalseach fall. For students and parents, information about thecompetition is given in the PSAT/NMSQT Student Guideand at www.nationalmerit.org.For inquiries about any aspect of the National MeritProgram—including entry requirements, the selectionprocess, and awards to be offered—contact NMSC directly:www.nationalmerit.org847-866-5100National Merit Scholarship Corporation1560 Sherman Avenue, Suite 200Evanston, IL 60201-4897
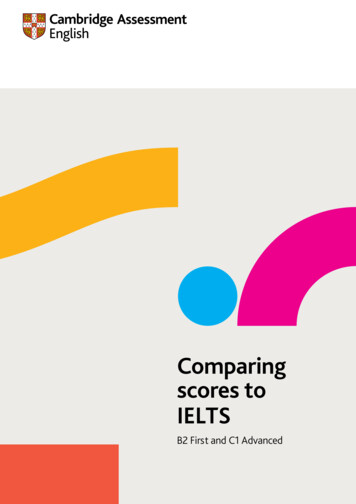
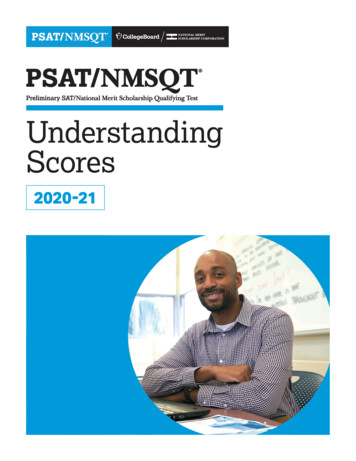
The PSAT/NMSQTScore ReportA Case Study: Ima B. Student’s PSAT/NMSQT Score ReportTake a look at Ima B. Student’s sample score report below and on the next page. Use the corresponding information to help youinterpret your student’s PSAT/NMSQT Score Report.What are Ima’s scores?YOUR SCORE TODAYYour Total Score960You are in theHi, Ima320 to1520Yo
subscores to state standards, analyze students’ strengths and weaknesses, learn which mistakes were the most common, and look for opportunities to reinforce skills. (The Question Analysis Report won’t be available to sc