Transcription
Chemical, Elemental andStructural Analysis of BatteriesApplication Compendium
ContentsImaging techniques for2D/3D morphologyContentsRaman Ex situ Raman Analysis of Lithium Ion Batteries3In situ Raman Analysis of Lithium Ion Batteries6Raman Analysis of Lithium-Ion Battery Components – Part I: Cathodes10Raman Analysis of Lithium-Ion Battery Components – Part II: Anodes14Raman Analysis of Lithium-Ion Battery Components – Part III: Electrolytes19SEM Investigate batteries with a SEM for better performancemicroCT Uncovering Internal Structure Defects in Lithium Ion Battery FoilsBulk analysisXPS Analysis of Electrode Materials for Lithium Ion BatteriesIon Chromatography Determination of Electrolyte Solution from Lithium Ion Battery22252730Determination of Dissolved Manganese in Lithium/Manganese Oxide Battery Electrolyte 35ICP-OES Simultaneous Determination of Impurities and Major Elements in Lithium-ionBattery CathodesGC-MS Orbitrap GC-MS Technology Provides New Insight intoLithium Ion Battery DegradationThe global lithium-ion battery market is expected to reach93.1 billion USD by 2025. This is largely driven by increasedusage in electric vehicles, grid storage, and portable consumerelectronics where the higher energy density of the lithium-ionbattery offers a clear advantage.Increases in battery performance requires the developmentof new battery components as well as understanding andaddressing the mechanisms that result in performancedegradation with repeated charging and discharging cycles.Evaluation of batteries and battery components requiresa variety of analytical methods that study materials andcomponent surfaces at various scales.As the world leader in advancing science, Thermo FisherScientific provides the widest range of analytical instrumentationfor battery analysis and product formulation, including X-rayphotoelectron spectroscopy (XPS/ESCA), electron microscopy(SEM, TEM and FIB-SEM), vibrational spectroscopy (FTIR,Raman and NIR), mass spectrometry (GC-MS, HPLC, LC-MS,HREMS-MS, ICP-MS), microCT, nuclear magnetic resonance(NMR), X-ray diffraction, X-ray fluorescence, rheometry,viscometry, extrusion and torque rheometry.Imaging techniques such as Raman, microCT, and electronmicroscopy cover the full length scale from the cell level withRaman and microCT down to the atomic scale with TEM. Ramanimaging can be used to observe the distribution of componentsand to monitor how these components change during thecharging/discharging cycles. MicroCT and electron microscopy3944are mainly used to study the 2D and 3D morphology of batterycomponents at different stages in the life cycle. 3D imagingprovides complete geometric evolution of the cathode microstructure upon cycling. Geometric parameters such as volumefraction, surface area, particle size distribution and tortuosityare typically assessed using a combination of microCT and FIB–SEM techniques.Spectroscopy, NMR, X-ray diffraction and mass spectrometryare key to studying the evolution of structural and chemicalchanges and the defect formation in battery electrodes. Thesetechniques permit the analysis of electrode materials as theychange during the redox reactions; and give information on bothcrystalline and amorphous phases. Local differences in Ramanspectral changes can create a state-of-charge (SOC) distributionmap showing the composite electrode. The composition of thesolid electrolyte interface (SEI) is commonly studied with ex situXPS and in situ FTIR and Raman spectroscopy to monitor theSEI formation.Rheology and viscometry systems measure the dispersivenessand coating capability of battery materials in an electrode slurry.Torque rheometers deliver information about melting behavior,influence of additives on processability and temperature orshear stability; all critical parameters for the production ofpolymer separators.This compendium of application notes provides in-depthreports on analyses aimed at improving the performance oflithium-ion batteries.Find out more about Thermo Fisher Scientific capabilities for batteries at thermofisher.com/energy
Ex situ Raman Analysis of Lithium Ion BatteriesAPPLICATION NOTEEx situ Raman Analysis ofLithium Ion BatteriesAuthorDick Wieboldt, Ph.D., Thermo Fisher Scientific, Madison, WI, USAKey WordsAnodes, Ex Situ Analysis, Lithium Ion Battery, RamanMicroscopy, Raman ImagingAbstractThe needs of the Li-ion batterycustomers can be segmented into in situand ex situ modes of analysis. Ex situanalysis lets researchers study batterycomponents removed from the operatingbattery cell.IntroductionAnalysis of battery materials with Raman spectroscopy hasbeen around for quite some time. During the 1960s, researchersused Raman to elucidate many of the fundamental spectralfeatures of the minerals and inorganic materials widely used inbattery research today.1,2 Raman is a good fit for these materialsbecause many of the characteristic vibrational and rotationalmodes occur in the low-wavenumber region of the spectrumtypically accessible only by far-infrared measurements. In thatday and age, both Raman and far-infrared measurementswere time consuming and difficult experiments.Analysis Techniques: In situ Versus Ex situThe term in situ is used to describe experiments where thebattery components are studied in an assembled cell underoperating conditions. Think of in situ as a window on the caseof a battery which lets you see the chemistry of what goes onwhen you charge and discharge a battery.While in situ cells provide valuable information, their useis generally targeted at research and development of newmaterials for Li-ion batteries. Once a formulation is designed, acandidate battery is scaled up through pilot production to actualproduct samples. At this stage of development, researchersare most interested in characterizing failure modes and a betterunderstanding of performance differences. For example, whatmakes one production run work better than another, and why didone battery fail yet its siblings from the same batch worked fine.To answer these questions, researchers carefully disassemblea battery cell so the individual components can be examined.This type of analysis is termed ex situ because the batterycomponents are removed from the operating battery cell. Thegoal is to prepare the samples for analysis in as close to a nativestate as possible.Battery disassembly for ex situ analysis is carried out in an inertenvironment such as an argon filled glove box to protect thebattery components from moisture and oxidation. For example,the anode, separator, cathode sandwich must be carefullyseparated and rinsed to remove excess electrolyte.
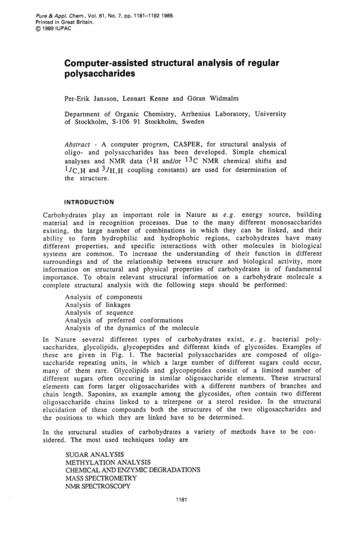
Once the samples are prepared, they must be kept in an inertenvironment to protect against changes during analysis. Whenspace is available, instruments are installed inside the glove boxso the samples can be analyzed. In most cases, the samplemust be removed from the glove box and transferred to anexternal instrument for analysis. This is where an ex situ transfercell becomes a key component of the workflow. It preserves theinert environment around the sample so it can be studied.As you might expect, it is a messy business to extract electrodesfrom a used battery so the SEI can be studied. It takes great careto prepare the sample so as to preserve its integrity for ex situanalysis. This is usually achieved by working in an argon filledglove box to prevent sample degradation due to atmosphericexposure. A transfer cell with window is used to seal the samplein the inert argon environment so it can be removed from theglove box for analysis using a Raman microscope.From Single Point Measurements toRaman ImagingThe majority of published research on Li-ion battery Ramanwork is based on single point measurements acquired over timeduring charge/discharge cycles. Single point measurementscan be misleading because there is no way of knowing if thesampled point is representative of the entire electrode. It isimportant to make multiple measurements to be sure. Becausethe Raman signals are weak, it takes many minutes to generateenough signal-to-noise ratio at each measurement point. Acomplete, multi-point experimental can be quite time consumingto complete.ExperimentalAnode samples from a disassembled Li-ion battery were cut andmounted in a Thermo Scientific transfer cell so that a crosssection of the anode could be imaged.Today, Raman imaging is a viable alternative which lets youquickly makes thousands of measurements overan area of the electrode rather than just single pointmeasurements. Each pixel in a Raman image is a completeRaman spectrum. This technique provides confidence inunderstanding if changes are heterogeneous or hot spots.The following experimental results demonstrate the flexibility ofusing Raman imaging for the ex situ analysisof Li-ion batteries and their components.Characterization of Li-ion AnodesAfter safety concerns, a leading area of interest in Li-ionbattery research is understanding the cause of performancedegradation over time. Research indicates the solid electrolyteinterphase (SEI) layer formed on the surface of the electrodeis key to performance. The SEI layer is formed by depositionof organic and inorganic compounds during the first severalcharge/discharge cycles.4 It stabilizes the electrode fromfurther decomposition and promotes reversible capacity.Because of the complexity of the SEI layer, results from anyand all analytical techniques contribute to an incrementalunderstanding of its behavior.The transfer cell (Figure 1) maintains an inert environmentsurrounding the sample so it can be analyzed using instrumentsoutside a glove box. The cell body acceptsa variety of industry standard sample holders (stubs) developedfor scanning electron microscope (SEM) analysis. A 90 stubwas used to hold the cut edge of the anode facing the window.A cap containing a calcium fluoride (CaF2) window seals thesample under an argon blanket. The cap is screwed on untilthe window height is just above the sample. This provides aminimum working distance between a microscope objective andthe sample. A short working distance is an advantage becauseit allows the use of high magnification objectives having a largenumerical aperture (N.A.).Raman spectra were collected over a single 76 µm 160 µmarea at spatial resolution of 1.0 µm per pixel using a ThermoScientific DXR xi Raman imaging microscope. Laser powerat the sample was 2.0 mW at 532 nm with a 0.2 sec exposuretime and 4 image scans. An Olympus 50 long workingdistance, 0.5 N.A. microscope objective was used to focusthrough the transfer cell window. Higher laser powers and/orlonger exposure times were avoided because they can heatthe sample causing changes which mask the native state ofthe electrode.Figure 1: Transfer cell maintains sample in an inert environment for ex situ analysis of Li-ion battery materials
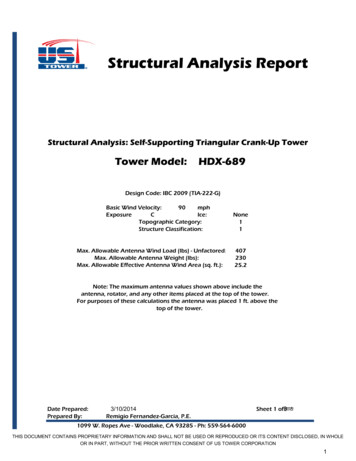
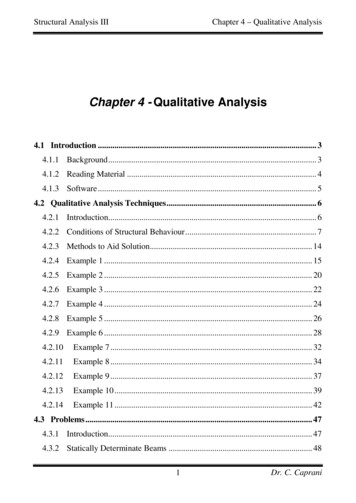
ResultsA Raman image is a hyperspectral data set with each pixel inthe image being a complete Raman spectrum. Using a varietyof spectral processing techniques, this hyperspectral Ramandata generates image contrast pertaining to specific chemicalfeatures. This capability is used to visualize minute differenceswithin a sampled area.A variety of chemical images can be created from each data setshowing changes within the sampled area. For this experiment,image contrast is generated by multivariate curve resolution(MCR) analysis. MCR finds the major components withineach image and a different color is assigned to each. This isanalogous to the use of dyes in biological fluorescence imagingwhich tag different parts of a cell.Alternatively, multiple regions of the sample can be imaged andthe Raman spectral data within each region can be averaged toproduce a single spectrum. In this mode, the Raman imagingdata set is used as a means of homogenizing any differences inthe electrode area. This average spectrum represents a singlepoint measurement yet each point represents a 30 µm squarecompared with the typical 1 µm sample area from a standardRaman microscope.Figure 2 is a micrograph of the anode cross section. The coppercurrent collector is in the center with anode material coated onboth surfaces. Superimposed is the Raman image created fromthe spectral differences shown by the inset Raman spectra.The Raman image clearly shows that the coating on one side ofthe copper current collector is dominated by carbon black (red)whereas the other side has a much greater density of the activegraphite phase (blue).This example demonstrated the advantage of Raman imagingover traditional single point measurements. The majordifferences in the two coatings could easily have been missedby single point measurements depending on where the pointswere measured.Figure 2: Cross section view of a Li-ion battery anode. Raman image indicatesa difference in the anode coating on each side. Inset Raman spectra are colorcoded to the areas in the Raman image.ConclusionThe high sensitivity of Raman imaging is a benefit for Li-ion batteryanalysis. Ex situ Raman imaging measurements give results with ahigher degree of confidence compared to single points.References1. P. Tarte, J. Inorg. Nucl. Chem. 29(4) 915–923 (1967). .B. White, B.A. De Angelis, Spectrochimica Acta Part A2. W23(4) 985–995 (1967).3. R . Baddour-Hadjean, J.P. Pereira-Ramos, Chemical Reviews110(3) 1278–1319 (2010).4. A. Chagnes and J. Swiatowska, Electrolyte and SolidElectrolyte Interphase Layer in Lithium-Ion Batteries, LithiumIon Batteries – New Developments, Dr. Ilias Belharouak(Ed.), ISBN: 978-953-51-0077-5, InTech, (2012). Availablefrom: teinterphase-layer-in-lithium-ion-batteries .Find out more at thermofisher.com/energy 2019 Thermo Fisher Scientific Inc. All rights reserved. All trademarks are the property of Thermo Fisher Scientific and its subsidiariesunless otherwise specified. AN52677-EN-03-2019
In situ Raman Analysis of Lithium Ion BatteriesAPPLICATION NOTEIn situ Raman Analysis ofLithium Ion BatteriesAuthorDick Wieboldt, Ph.D., Thermo Fisher Scientific, Madison, WI, USAInes Ruff, Ph.D., Thermo Fisher Scientific, Dreieich, GermanyMatthias Hahn, Ph.D., El-Cell GmBH, Homburg, GermanyKey WordsElectrodes, In Situ Analysis, Lithium Ion Battery, RamanMicroscopy, Raman ImagingAbstractThe needs of the Li-ion batterycustomers can be segmented into insitu and ex situ modes of analysis. Insitu analysis allows researchers to followchanges in a battery cell during itscharge and discharge cycles. Recentimprovements in Raman sensitivityenable these changes to be imaged ona dynamic time scale.IntroductionThe use of Raman spectroscopy for analysis of battery materialshas been around for years. During the 1960s, researchers usedRaman to elucidate many of the fundamental spectral featuresof the minerals and inorganic materials widely used in batteryresearch today.1,2 Raman is a good fit for these materialsbecause many of the characteristic vibrational and rotationalmodes occur in the low-wavenumber region of the spectrumtypically accessible only by far-infrared measurements. In thatday and age, both Raman and far-infrared measurements weretime consuming and difficult experiments.Advances in instrumentation have greatly increased the ease-ofuse of Raman making it a much more approachable technique.New areas of application ensued such as the exploding interest inrechargeable lithium ion batteries. Many researchers are involvedand have published careful studies of materials specifically relatedto Li-ion batteries as well as next generation batteries. A reviewarticle by Baddour-Hadjean published in 2010 is an excellentresource for those wishing to get up-to-speed in this field.3The focus of this application note is on the in situ application ofRaman spectroscopy as it pertains to battery research.Analysis Techniques: In situ Versus Ex situThe term in situ is used to describe experiments where thebattery components are studied in an assembled cell underoperating conditions. Think of in situ as a window on thecase of a battery which lets you see the chemistry of whatgoes on when you charge and discharge a battery. There arevery few commercially available cell designs compatible withspectroscopic measurements. Researchers have resorted tobuilding their own cells to meet the needs of their experimentalapparatus. Examples of such designs have been publishedalong with experimental results.4-10
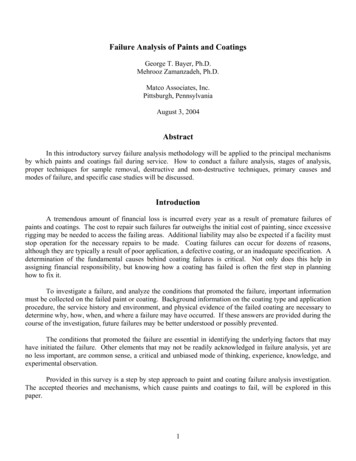
In situ cells analysis is generally targeted at research anddevelopment of new materials for Li-ion batteries. Once aformulation is designed, a candidate battery is scaled up throughpilot production to actual product samples. At this stage ofdevelopment, researchers are most interested in characterizingfailure modes and a better understanding of performancedifferences. For example, what makes one production run workbetter than another, and why did one battery fail yet its siblingsfrom the same batch worked fine.To answer these questions, researchers carefully disassemblea battery cell so the individual components can be examined.This type of analysis is termed ex situ because the batterycomponents are removed from the operating battery cell. Thegoal is to prepare the samples for analysis in as close to a nativestate as possible. Please see the companion application note fordetails on ex situ analysis.From Single Point Measurements toRaman ImagingThe majority of published research on Li-ion batteryin situ Raman work is based on single point measurementsacquired over time during charge/discharge cycles. An exampleis the excellent work done by Kostecki’s group at LawrenceBerkeley National Lab.11Single point measurements can be misleading because there isno way of knowing if the sampled point is representative of theentire electrode. It is important to make multiple measurementsto be sure. Because the Raman signals are weak, it takesmany minutes to generate enough signal-to-noise ratio at eachmeasurement point. A complete, multi-point experiment can bequite time consuming to complete.Today, Raman imaging is a viable alternative which lets youquickly makes thousands of measurements over an area ofthe electrode rather than just single point measurements. Eachpixel in a Raman image is a complete Raman spectrum. Thistechnique provides confidence in understanding if changes areheterogeneous or hot spots.The following experimental results demonstrate the flexibility ofusing Raman spectroscopy for in situ analysis of Li-ion batteriesand their components.Lithiation of GraphiteGraphite is widely used as an anode material for rechargeableLi-ion batteries.During the Li-ion battery charging cycle, positively chargedLi ions move from cathode through the electrolyte, acrossa separator into the anode to balance the flow of electrons inthe external circuit (Figure 1). This process of Li ions enteringthe graphitic structure of the anode is called intercalation.Intercalation causes changes in the anode structure – primarily aswelling of the graphite structure.ExperimentalThe experimental setup for this example consists of a ThermoScientific DXR xi Raman imaging microscope and an ELCELL ECC-Opto-Std optical electrochemical cell. This cellenables the investigation of batteries in a so-called sandwichconfiguration where the working electrode (WE) material isplaced under a sapphire (Al2O3) window. Electrode material(graphite powder in this example) is spread onto a copper gridserving as the current collector. This WE is sandwiched frombelow, with a glass fiber separator soaked with the electrolytesolution and lithium metal as the counter electrode (CE).The Raman beam from the microscope objective impinges ontothe backside of the WE material through the sapphire window(Figure 2). The advantage of investigating the backside of theelectrode is that the pathway for the Raman beam is minimized,allowing the use of high magnification objectives, optimizingspectra quality. The drawback is the gradient of lithiationconcentration along the depth of the electrode. Accordingly, theelectrode must be charged very slowly in order to minimize thisunwanted gradient.Figure 1: Movement of Li ions balance electrons during the charge anddischarge cycles of a Li-ion batteryThe graphite electrode was cycled at a constant rate ofapproximately 0.06 C. The C-rate is measure of how rapidly abattery is charged/discharged. This rate of 0.06 C correspondsto 33 hours for a full charge/discharge cycle between 1.5 and0.005 V against Li/Li . Raman imaging was carried out duringthe initial 480 minutes of the charging (lithiation) process only.Raman spectra were collected over a 30 µm 30 µmarea at 1 µm pixel spacing using 2 mW of 532 nm laserexcitation, a 0.01 sec exposure time for each pixel, and50 scans per image. Higher laser powers and/or longerexposure times resulted in burning of the graphite and boiling ofthe electrolyte.Figure 2: Experimental setup for the in situ example showing theelectrochemical cell mounted on the stage of a Raman imaging microscope
ResultsA Raman image is a hyperspectral data set with each pixel inthe image being a complete Raman spectrum. Using a varietyof spectral processing techniques, this hyperspectral Ramandata generates image contrast pertaining to specific chemicalfeatures. It is this capability that visualizes minute differenceswithin a sampled area. By collecting a sequence of Ramanimages, we now have the ability to monitor changes in bothspace and time. As mentioned earlier, a variety of chemicalimages can be created from each data set showing changeswithin the sampled area. Alternatively, the Raman spectraldata within each data set can be averaged to produce a singlespectrum for each time slice. In this mode, the Raman imagingdata set is used as a means of homogenizing any differences inthe electrode area. This average spectrum represents a singlepoint measurement yet each point represents a 30 µm squarecompared with the typical1 µm sample area from a standard Raman microscope.Figure 3: Different views rendered from the time lapse hyperspectral Ramandata provide a wealth of experimental informationIn Figure 3, the 3D view (bottom left) shows changes in theRaman spectrum as a function of time over 8.3 hours (1–500min). During this time, the battery cell is in the charging (lithiation)process only. This portion of the electrochemical cycle is shownin the lower right of Figure 3.The spectrum of graphite exhibits a prominent peak at 1580cm-1 attributed to the E2g2 mode (G band). At potentialsbetween 0.42 and 0.31 V (specific charge 33 and 45 mAh/g),the band gradually disappears along with the simultaneousemergence of a peak centered at 1590 cm-1. This peak shift isattributed to the Li ions intercalated into the graphite structure.This is more easily seen in the center, 2D Raman image. Theinset shows Raman spectra before and after the change.Towards the end of the charge cycle at 8.3 hours (496 min),where the voltage is less than 0.15 V (specific charge greaterthan 146 mAh/g), a strong Raman band centered at 154 cm-1begins to appear. This Raman band has not been previouslyreported so its assignment is not conclusive. Strong Ramanbands in this region have been attributed to TiO2, Sb, and metalchlorides.The type of views shown in Figure 3 are “spectrum-centric”because they show changes in the Raman spectra capturedat different times during a time based analysis. Figure 4 showsanother way of exploring the same Raman imaging data set froman alternative “image-centric” point-of-view. Here, we are not asinterested in the Raman spectrum itself but rather its use as atool to enhance differences within the image (image contrast).In Figure 4, Raman images are presented in which the imagecontrast is generated by multivariate curve resolution (MCR)analysis. In this case, MCR finds the differences not only withineach image but also across the entire time sequence. A differentcolor is assigned to each resolved component. This is analogousto the use of dyes in biological fluorescence imaging whichtag different parts of a cell. Each image is from the same 30µm square portion of the anode. The blue MCR component isindicative of the 1580 cm-1 band; green the 1590 cm-1 band;yellow the 154 cm-1 band; red represents carbon black, aconductivity enhancer.Figure 4: Raman images from different time slices in the graphite lithiationexperimentIt can be challenging to visualize the information content withsuch a massive wealth of data. Figure 4 shows just three framesto demonstrate this type of analysis. The changes are easier tograsp using a time lapse viewer of the complete time sequence: 3D time lapse: http://youtu.be/Ic0MFAB5U4M Time lapse: http://youtu.be/geq6mbYVARE
ConclusionThe high sensitivity of Raman imaging is a benefit for Li-ionbattery analysis. In situ Raman imaging techniques show thespatial distribution of phase changes in electrodes over time.This is a capability that was not possible with single pointmeasurements using traditional Raman microscopy.References1. P. Tarte, J. Inorg. Nucl. Chem. 29(4) 915–923 (1967).2. W .B. White, B.A. De Angelis, Spectrochimica Acta Part A23(4) 985–995 (1967).3. R . Baddour-Hadjean, J.P. Pereira-Ramos, Chemical Reviews110(3) 1278–1319 (2010).4. T. Gross, C. Hess, J Power Sources 256, 220–225 (2014).5. P. Novák, D. Goers, L. Hardwick, M. Holzapfel, W. Scheifele,J. Ufheil, A. Wursig, J Power Sources 146, 15–20 (2005).6. C.M. Burba, R. Frech, Applied Spectroscopy 60(5), 490–493(2006).7. E . Markevich, V. Baranchugov, G. Salitra, D. Aurbach, M.Schmidt, J Electrochem Soc 155(2), A132–A137 (2008).8. Y. Luo, W.B. Cai, X.K. Xing, D.A. Scherson, Electrochem.Solid-State Lett. 7(1), E1–E5 (2004).9. T. Gross, L. Giebeler, C. Hess, Rev. Sci. Instrum. 84(7),073109-1–073109-6 (2013).10. K . Hongyou, T. Hattori, Y. Nagai, T. Tanaka, H. Nii, K. Shoda,Power Sources 243, 72–77 (2013).11. J. Lei, F. McLarnon, R. Kostecki, J. Phys. Chem. B, 109(2),952–957 (2005).Find out more at thermofisher.com/energy 2019 Thermo Fisher Scientific Inc. All rights reserved. All trademarks are the property of Thermo Fisher Scientific and its subsidiariesunless otherwise specified. AN52676-EN-03-2019
Raman Analysis of Lithium-Ion Battery Components – Part I: CathodesAPPLICATION NOTE AN52443Raman analysis of lithium-ion battery componentsPart I: CathodesAuthorRobert Heintz, Ph.D., Thermo Fisher ScientificMadison, WI, USAKeywordsDXR 2 Microscope, cathodes, lithium-ion battery,RamanIntroductionIn recent years the increasing demand for poweringportable electronic devices from laptops to smart phoneshas driven the need for improved battery performancebut the emergence of electric and hybrid vehicles iscreating additional interest in new battery technologies.The expanding use of portable energy storage introducesadditional factors beyond just improving battery capacity.Cost, safety, and environmental impact are importantconsiderations as the use of battery technology evolves.Lithium-ion batteries offer the highest energy density andoutput voltage among commercial rechargeable batterysystems.1 Even though lithium-ion batteries are now anestablished technology there is still considerable interest inimproving the current technology and the development ofnew battery components.Evaluation of batteries and battery componentsrequires a variety of analytical methods not only for thedevelopment of new materials but also for gaining agreater understanding of the mechanisms involved incharge/discharge cycles. Bulk analysis of componentsis important but it is also important to understandsurface interactions and interfaces. Electrochemicalevaluation of cells includes conductivity measurements,electrochemical stability of components, cell capacity, ionmobility, discharge rates, and cycling behavior Materialscharacterization of the various cell components caninclude many different analytical techniques (examples:XRD, SEM, TEM, TGA, DSC, EDS) but one techniquethat is rapidly growing in popularity for the analysis ofmaterials is Raman spectroscopy. Raman spectroscopyhas many advantages but the most important for batteryapplications are ones that involve subtle changes inmolecular structure or local chemical environments.The spectral results can usually be correlated with theelectrochemical performance.There have been significant improvements in commercialRaman instrumentation over the last several years.Important advances in both hardware and softwarehave made modern Raman instruments much moreuser friendly and removed many of the obstacles thatin the past made routine use of Raman spectroscopyarduous for users with limited expertise. Advancesin instrumentation also include integration of lightmicroscopes with Raman instrumentation which allowsspectroscopic analysis of samples at the microscopiclevel. Modern Raman instruments, like the ThermoScientific DXR 2 Raman microscope, are fullyintegrated, high performance research grade instrumentsthat have incorporated extensive automation to simplifythe collection of Raman spectra. For example, automatedon-demand alignment and calibration present on theDXR 2 microscope, is designed to eliminate the needfor manual realignment and calibration and results in aninstrument that is easy to use and maintain at its highestlevel of performance. This ease of use means it is muchquicker to get started and straightforward to get accurateresults. This opens up the use of Raman spectroscopy forall types of users.
Raman has been used for the analysis of many differenttypes of battery components. This includes analysis ofcathode materials, anode materials, and electrolytes.2,3Part one of this series will focus on some examplesof how Raman spectroscopy has been utilized for theanalysis of cathode materials. This article is in no waymeant as a complete review of the literature. That isbeyond the scope of this application note. I
This type of analysis is termed ex situ because the battery components are removed from the operating battery cell. The goal is to prepare the samples for analysis in as close to a native state as possible. Battery disassembly for ex situ analysis is carried out in an inert environment such as an argon filled glove box to protect the