Transcription
MASTERS IN FINANCEEQUITY RESEARCHUNDER ARMOURCOMPANY REPORTAPPAREL & FOOTWEAR08 DECEMBER 2015STUDENT: LARS VAJEN23272@novasbe.ptCapitalizing on the Athleisure trendRecommendation:BUYVs Previous Recommendation-UA’s growth machine keeps on churningPrice Target FY16:92.82 Vs Previous Price Target-We initiate the coverage of Under Armour (UA) with aBUY recommendation and a target price of USD 92.82 YEPrice (as of 9-Jan-16)78.00 2016. Given the puny performance of the share, 22.88%Reuters: NYSE: UA, Bloomberg: UA:USdecrease in the last 3 months, we see a window of opportunity to52-week range (USD)buy into a burgeoning growth story. 105.89-63.77Market cap (USD m)16,833.6Outstanding shares (m)Share: Historically, the share has performed remarkablywell outperforming the S&P 500 by 187% in the last 3 years. Thestrong market performance of the share was justified, as UAcould increase its revenue growth in each of these years,215.8Free float83%3.293.09Avg. Daily Volume (last 3M, m)Expected Total Return19.15%Expected Share Price Return19.00%Source: Bloomberg, Analyst’s estimatesachieving a CAGR of 28% while also improving margins. ational”, “Women’s Apparel” and “Connected Fitness”leave “ample runway for continually high growth for the nextyears. However, this growth is capital intensive and is pressuringfree cash flow and margins short term. Valuation: Our price target is derived from a discountedcash flow analysis of UA. We feel, although the P/E multiple isin % based on 100% at 1st December 2014Source: Bloomberg(Values in USD TDA426548686and has over-amplified short term retail concerns believed to beNet Income208289355responsible for the decrease in the last month. Thus, our targetEPS (USD)0.941.321.63P/E (x)47.9high at 59x, the market is still not reflecting the full potential of UAprice is a 19.00% mark-up to the current share price.82.959.2Dividends)---EV/EBIT (x)514437EV/EBITDA (x)Company descriptionUnder Armour develops, markets and distributes brandedperformance apparel, footwear and accessories. The companyuses innovative heat regulating and moisture wicking fabricationsto keep the athlete comfortable during exercise. The company’sproducts are used by athletes and sports enthusiasts at all levels,from professional to amateurs. The company was founded in1996 in Baltimore, USA.433428Net Debt(313)719771Net Debt/EBITDA (x)(0.74)1.210.99ROIC (%)22.3219.2917.13WACC (%)6.626.626.62Source: Bloomberg, Analyst’s estimatesTHIS REPORT WAS PREPARED BY “LARS VAJEN”, A MASTERS IN FINANCE STUDENT OF THE NOVA SCHOOL OF BUSINESS ANDECONOMICS, EXCLUSIVELY FOR ACADEMIC PURPOSES. THIS REPORT WAS SUPERVISED BY ROSÁRIO ANDRÉ WHO REVIEWED THEVALUATION METHODOLOGY AND THE FINANCIAL MODEL. (SEE DISCLOSURES AND DISCLAIMERS AT END OF DOCUMENT)See more information at WWW .NOVASBE.PTPage 1/31
UNDER ARMOURCOMPANY REPORTTable of ContentsCOMPANY OVERVIEW . 4COMPANY DESCRIPTION .4 Company evolution .4 Shareholder structure and key personnel .5 Value Chain.7PRODUCT CATEGORIES .8 Apparel .8 Footwear.9 Accessories & Licensing . 12 Connected Fitness . 12KEY DRIVERS . 14 Athleisure trend . 14 Women’s . 15 International . 16 Digital . 17 Brand. 18ECONOMIC DRIVERS . 20COMPETITION. 22COMPETITIVE POSITIONING . 23VALUATION .24FORECASTS . 24COST OF CAPITAL . 27FINANCIAL STATEMENTS .30RESEARCH RECOMMENDATIONS . 31PAGE 2/31
UNDER ARMOURCOMPANY REPORTExecutive summaryUnder Armour is a US-basedapparel & footwear companygenerating revenues of USD3,084m with mid-twentiesrevenue growthUnder Armour is a branded performance apparel, footwear and accessoriescompany, which was founded 1996 in Baltimore, United States, went public in 2005and has since become one of the leaders in the US apparel & footwear market.The company is listed at the New York Stock Exchange (NYSE) under the tickerNYSE:UA and is a constituent of the index S&P 500.North America is generatingmore than 90% of revenues,international exposure will beparamount to UA’s growthprojectionsConsumer’s economiccondition, the development ofthe global apparel & footwearmarket and internationalexpansion are key to UA’ssuccessThe major share of the company’s revenue is generated in North America (91%),whereas only 8% is coming from International 1. The main product category soldis Apparel (74%), but newer categories e.g. Footwear and Connected Fitness areincreasing their share and provide ample runway for growing revenues.Going forward, we anticipate the key factors for the company’s success to be: (i)macroeconomic conditions, mainly global GDP growth, household’s disposableincome and consumer confidence (ii) the development of the global apparel andfootwear market and the ability of Under Armour to gain market share (iii) theexecution of Under Armour’s international expansion.Our forecasts see revenue growing at a CAGR of 26% and EPS at 23% fromRevenue forecast shows a26% CAGR (2014-2018) andstrong free cash flowgeneration after 20162014 until 2018. Margins are believed to be pressured in the short term due tofirst-time investments, lower efficiencies in the nascent product categories andcurrency headwinds. The free cash flow potential is immense, although highcapital expenditures lead to negative FCF in 2015/2016. However, mid-to-longterm free cash flow generation is strong (CAGR 83% 2017-2020).UA’s current P/E multiple is high at 59x compared to its peers average of 31xUA has high growthexpectations implied by theshare price (59x P/E), we seean even higher markupjustified(90% premium), also in terms of EV/EBITDA2 UA is at a premium of 164% (37 vs14) to its peers. This shows that high growth for the company is already expectedby the market. However, we believe that long term growth and foremostincreasing free cash flow not only justify that premium, but also should berewarded with an even higher markup.We initiate the coverage of Under Armour with a BUY recommendation and aCoverage of UA is initiatedwith a BUY recommendationand a target price of USD92.82, a 19% upsidetarget price of USD 92.82, representing a 19.00% upside to the current shareprice. Given the company’s strong past success, the management’sconcentration on sustainable growth and the implications of a further growingglobal apparel & footwear market, we see the current state as a good opportunityto buy into a winning company for years to come.12as of FY 2014Last twelve monthPAGE 3/31
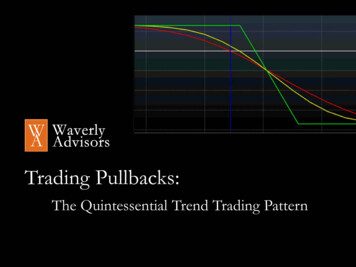
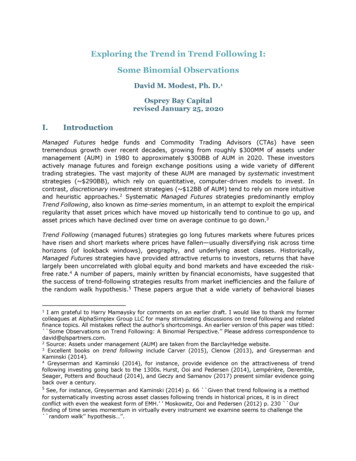
UNDER ARMOURCOMPANY REPORTCompany overviewUnder Armour is a branded performance apparel, footwear and accessoriesUA is a branded sportsapparel & footwear companywith HQ in Baltimore, USAcompany, which was founded 1996 in Baltimore, United States, went public in 2005and has since become one of the leaders in the US apparel & footwear market.The company is listed at the New York Stock Exchange (NYSE) under the tickerNYSE:UA and is a constituent of the index S&P 500.Company descriptionFigure 1: Revenue by productcategory in 2014 (%)11%1%Under Armour is engaged in the development, production and distribution ofbranded sportswear, designed to keep athletes comfortable while exercising andthereby possibly enhancing their performance. To address customer’s needs thecompany is using several product lines, which aim at solving particular issues.14%Among others the offering includes compression, fitted and loose apparel that ismade to be either worn in cold, hot or in between temperatures regulating the74%athlete’s temperature and keeping him comfortable while exercising. The productcategories are “Apparel”, “Footwear”, “Accessories & Licensing” and the newlyApparelFootwearAccessories & LicensingConnected FitnessSource: Company dataestablished “Connected Fitness” category (see Figure 1 for the sales compositionby product category). The revenue mix by segments shows 90% of net revenuesare originated in North America, 9% in International and 1% in the ConnectedFitness segment in 2014. The production processes of Under Armour are mostlyoutsourced to third-parties in developing economies, making use of theirsubstantially lower labor costs, while only the brand-building processes e.g.research & development, design of new products, marketing and all strategicplanning is made in-house in Baltimore. Company evolutionUnder Armour grew out of an idea of founder Kevin Plank, a former AmericanFootball collegiate athlete at the University of Maryland, who was bothered byconstantly having to change t-shirts in training sessions, because they were sweatsoaked and became heavy. After extensive research of very light synthetic fibershe developed a t-shirt, which would regulate the athlete’s temperature, keep himUA is the market leader forsynthetic performanceapparel in the US ( 70%)dry due to its moisture wicking fabrication and thus enhances the comfort in whichthe athlete could exercise. Athletic apparel with this kind of characteristics werecompletely new to the market and where only imitated by competitors like Nike andAdidas years later. Under Armour thus ruled the synthetic performance apparelmarket and still owns a market share of roughly 70%3. By approaching manyuniversities athletic programs and meeting their athletes and gear coordinators3United States Synthetic Performance Apparel market, Source: ForbesPAGE 4/31
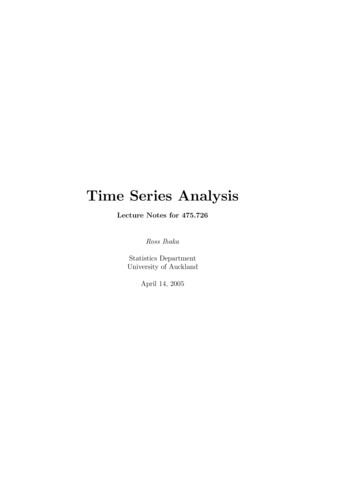
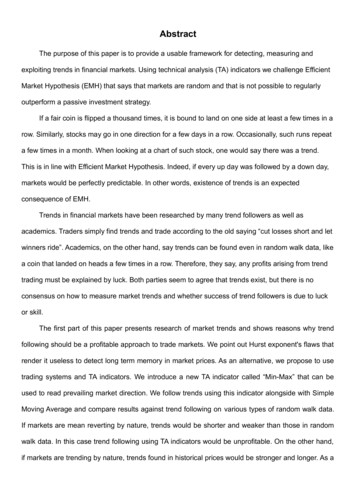
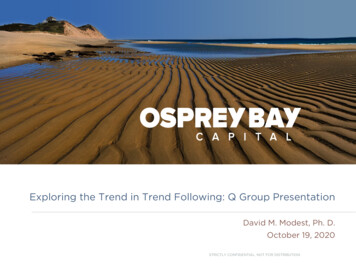
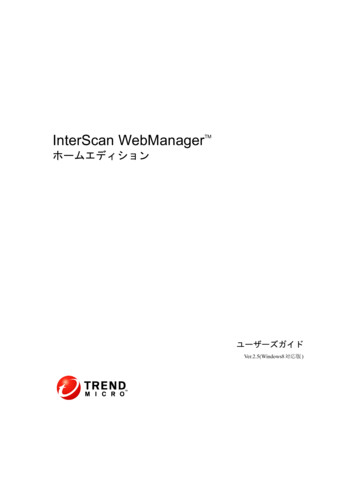
UNDER ARMOURCOMPANY REPORTpersonally, demonstrating the benefits of using the newly developed t-shirts, KevinPlank achieved to make USD 17,000 in sales the first year. From day one, UnderRevenues grew from USD17,000 to USD 3,084m with 21consecutive quarters of 20% growthArmour was geared towards performance gear for professional athletes and untilthis day the company is still using the brand image of enhancing athleticperformance at the highest levels to cater to the needs of and sell to amateur andcasual athletes at all levels who aspire to be as great as professional athletes.Since its start in 1996, the company has grown from the aforementioned USD17,000 in revenue to USD 3,084m in 2014 and has shown 21 consecutive quartersof 20% and plus growth, being only one of two companies in the S&P 500 to haveaccomplished that feat.Figure 3: Ownership structure asof 3rd December 2015Investors are certainly aware of this growth story and have made the company oneof the main success stories in recent years. One the day of first issue on November17%18, 2005 the share price doubled and since then the share price has increased36%7%1,359% compared to 69% for the S&P 500 or 508% for one of its main competitors6%5%4%25%Nike during the same time-span.Figure 2: UA’s share performance against peers and S&P 500 based to 100% at1st of December 2010 (in %)Plank, Kevin A. (Founder & CEO)800Fidelity Investments600The Vanguard Group, Inc.400Jennison Associates200BlackRock, Inc.0Dec-10Jun-11Other Institutional InvestorsPublic and individual investorsSource: BloombergDec-11Jun-12 Dec-12Under ArmourJun-13 Dec-13 Jun-14S&P 500NikeDec-14 Jun-15AdidasDec-15Source: Bloomberg Shareholder structure and key personnelThe ownership structure of Under Armour is made up of institutional investorsholding 64.27% of total shares outstanding and individual investors 35.73%. Thetop holders in both of these categories are Kevin A. Plank, the founder and CEOof the company with 16.59%, Fidelity Investments (6.52%), The Vanguard GroupFigure 4: Plank’s share count(in millions of shares)80(6.47%) and Jennison Associates (5.51%). The free float amounts to 83%.Until 2015 the company had issued two types of shares, the Class A CommonStock and Class B Convertible Stock. Holders of both Classes have identical rights,60except that Class A Common Stock holders are entitled to one vote per share,40whereas Class B Convertible Stock holders are entitled to 10 votes per share and0they can only be held by the founder Kevin Plank or one of his relatives. As a 20Source: BloombergKevin Plank has the majority of voting rights and thus is in control of the company 4.In the last years howe
Under Armour is a branded performance apparel, footwear and accessories company, which was founded 1996 in Baltimore, United States, went public in 2005 and has since become one of the leaders in the US apparel & footwear market. The company is listed at