Transcription
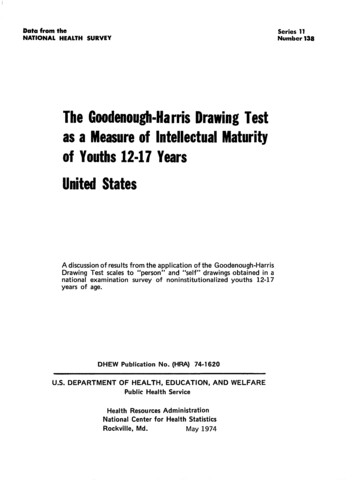
Data from theNATIONAL HEALTH SURVEYSeries 11Number 138The Goodenough-llarris Drawing Testas a Measure of Intellectual Maturityof Youths 12-17 YearsUnited StatesA discussion of results from the application of the Goodenough-HarrisDrawing Test scales to “person” and “self” drawings obtained in anational examinationsurvey of noninstitutionalizedyouths 12-17years of age.DHEWU.S. DEPARTMENTPublicationOF HEALTH,No. (HRA)74-1620EDUCATION,ANDPublic Health ServiceHealthNationalRockville,Resources AdministrationCenter for Health StatisticsMd.May 1974WELFARE
IISeries 11 reports present fklings from the Natiord Health Examination Survey, whichobtains data through direct examination, tests, and measurements of samples of the U.%population. Reports 1 through 38 relate to the adult program, Cycle 1 of the Health Examination Survey. The present report is one of a number of reports of findings from the childrenand youth programs, Cycles 11and 111of the Health Examination Survey. These latter reportsfrom Cycles II and 111&e being published in Series 11 but are numbered consecutivelybeginning with 101. It is hoped this will guide users to the data in which they are interested.Library of Congrets Cataloging in Publication DateThe Goodenough-Harris drawing test as a measure of intellectwd maturity of youths 12-17years, United States.(Natiomd Center for Health Statistics. Data from the Natiorud Health Survey. Series 11,no. 138) (DHEW.publication no. (HRA) 74-1620)“This report presents data obtained from a modified version of the Goodenough-Harrisdrawing test adrninktered to a national probability sample of youths 12-17 years of age inthe United States.”Bibliography: p.Supt. of Dots. no.: HE 20.6209: 11/138,1. Draw-a-person test–Statistics.2. Inte ect–Statistics.3. Maturation (Psychology)Statistics. 4. Adolescent psychology-statistics.L Pinder, Glenn D., joint author. II. Tide.111.Series: United States. National Center for Health Statistics. Vital and health statistics.Series 11: Data from the National Health Survey. Data from the health examination survey,no. 138. IV. Series: United States. Dept. of Health, Education, and Welfare. DHEW publication no. (HRA) 74-1620.RA407.3.A347 no. 138 [BF698.8.D7] 153.9’324 73-20471For saleby the Superintendentof Documents,U.S. GovernmentPrfnting Otlice,Washington,D.C. 20402-Prfce 6ilcents
NATIONALCENTERFOR HEALTHSTATISTICSEDWARD B. PERRIN, Ph.D., DirectorPHILIP S. LAWRENCE, SC.D., Deputy DirectorDEAN E. KRUEGER, Acting AssocLzte Director for AnalysisGAIL F. FISHER, Assoczhte Director for the Cooperative Health Statktics SystemELIJAH L. WHITE, Associate Director for Data SystemsIWAO M. MORIYAMA, Ph. D., Associate Director for International Statistical ProgramsEDWARD E. MINTY, Associate Director for ManagementROBERT A. ISRAEL, Associate Director for OperationsQUENTIN R. REMEIN, Associate Director for Program DevelopmentPHILIP S. LAWRENCE, SC.D., Acting Associate Director for ResearchALICE HAYWOOD, Information OfficerDIVISIONOFHEALTHEXAMINATIONSTATISTICSARTHUR J. McDOWELL, DirectorGARRIE J, LOSEE, Deputy DirectorPETER V. V. HAMILL, M.D., Medical Advisor, Ch!ldren and Youth ProgramHENRY W. MILLER, Chief Operations and Quality Control BranchLINCOLN 1. OLIVER, Chiej psychologicalStatistics BranchHAROLD J. DUPUY, Ph.D., psychologicalCOOPERATIONAdvisorOF THE BUREAU OF THE CENSUSIn accordance with specifications established by the NationalCenter for Health Statistics, the Bureau of the Census, under acontractual agreement, participated in the design and selection ofthe sample, and carried out the fwst stage of the field interviewingand certain parts of the statistical processing.Vital and Health Statistics-SeriesDHEWPublicationNo.1 l-No.(HRA)Library of Congress CWalog Card Number13874-162073-20471
ield Administration andScoring --------------------------” g -------- ----------.---”Study of Children --------------------------Drawings in the Psychological3---.--.----”---------Results -------- -“- ---- ----------------------------------------------Raw Scores -------- -------------------------------.“ComparisonWith Harris’Norms ----.-” ------------------------------------------Standard Scores and Percentiles ummary ----------------References -------List of --1516-------------Appendix1. Technical Notes --”----------TheSurveyDesign -----------------ReliabilityMissing Test Results and Imputation Procedures ------------------------------ ---Sampling and Measurement Error ------Hypothesis Testing --------------------------------------Small Categories ----------------------Standard Scores4141434445454646Appendix47II. Cycle III Drawing Test Instructions -----------------------.m
SYMBOLSData not bailable ---------------------------Category not applicable -------------------.Quantity zero ---------------------------Quantity nore than O but less than O.05---Figure doesnot meet standards ofreliabilityorprecision ------------------iv0.0*
THE GOODENOUGH-HARRISDRAWINGTESTAS A MEASURE OF INTELLECTUAL MATURITY OF YOUTHS*Dale B. Harris, Ph. D., The Pennsylvania State Univwsity, andGlenn D. Pinder, Division of Health Examination StatisticsINTRODUCTIONThis report presents data obtained from amodified version of the Goodenough-Harris Drawing Test administered to a national probabilitysample of youths 12-17 years of age in the UnitedStates in the Health Examination Survey of 196670. Information presented here is essentially acontinuation of that reported for children ages 6-11in a previous publication of the Vitul and HealthStatistics series This is the first report on testfindings among adolescents and is limited to consideration of age and sex differentials.The Health Examination Survey is a programof the National Center for Health Statistics in whichdata are collected by direct examination of representative samples of the noninstitutionalized population of the United States. Since 1960 the Surveyhas been carried out in a series of separate programs (called “cycles”) concerned with segmentsof the total population and focused on certain aspects of the health of that subpopulation. The datapresented here were obtained in the third cycle, asurvey of the Nation% youths aged 12-17 years.This program was a continuation of the previouscycle in which children 6-11 years old were givenbasically the same examination and which focusedon health factors related to growth and development. Details regarding the surveys can be obtained in comprehensive reports on the children’spro&ram2 and that of the youths.3 Further information regarding the Cycle III survey design canbe found in appendix I.The survey of youths was started in March1966 and field collection operations were completed in March 1970. Of the 7,514 youths se-lected for the sample, 6,768 (90 percent) wereexamined. This national sample may be considered representativeof the roughly 23 million noninstitutionalizedyouths 12-17 years of age in theUnited States at the time of the survey.A standardized 3-hour, single-visitexamination of each youth was given by the examinationteam in specially designed mobile units used forthe survey. Along with the physician’s and dentist’s examination and a variety of tests and measurements done by technicians, a 70-minute psychological test battery was administered by a psychologist. This battery contained the followingprocedures administered in the order listed: WideRange Achievement Test, arithmetic and readingsections; Wechsler Intelligence Scale for Children, Vocabulary and Block Design subtests; fivecards from the Thematic Apperception Test; amodified version of the Goodenough-Harris Drawing Test requesting a person and a self drawing,the Brief Test of Literacy; and a questionnairecovering certain health-relatedattitudesandbehaviors. A critical evaluation of the tests andprocedures selected, including a literature reviewof previous research and evaluations, was done oncontract by S.13. Sells of Texas Christian University. The results have been published in the methodological series of Vital and Health Statistics.4Before sample youths were examined, information was obtained from their parents. The information included demographic and socioeconomic data on household members as well as amedical history and behavioral data about the sample youth. Information regarding scholastic performance and adjustment was requested in a questionnaire sent to the youth’s school.
FIELDTestingADMINISTRATIONAND SCORINGProceduresTwo human figure drawings were obtainedfrom each youth during individual testing ses.sions. All tests were administered by psychologists who had obtained at least master’s degreesand who had had previous experience administering tests. There were two psychologists with theexamining team at all times. The examiners wereselected, trained in field testing procedures, andsupervisedby the psychological advisory staffof the Health Examination Survey. In all trainingand supervision,strong emphasis was placed onuniform methods of test administration,scoring,and recording of data. During the course of theyouths’ survey, 12 psychologists worked in thefield.In the planning stages for Cycle 111it wasdecided that instructionsfor the drawing testshould provide for drawings of both a “person”figure and a “self” figure. It was also decided,as with the children’s drawings from the previoussurvey, that all drawings would be scored in accordance with the 1963 Goodenough-Harris Drawing Test scales 5 in order to obtain a measure ofintellectual maturity. During pilot testing o thesurvey examination it was found that the adoles.cent age group tended to take more time in completing the drawings than could be allowed withinthe time constraintsimposed by the entire examination. Through observation it was determinedthat most youths could produce a complete andscoreable product within a period of 5-7 minutesbut would then continue to make changes and additions which appeared to serve no noticeablyconstructiveend. A further modification of thetest instructions was then introduced. Each youthwas told he would have 5 minutes to complete eachdrawing. In addition, examiners were instructed toallow a youth up to 7 minutes for completion ofthe drawing if it seemed necessary. (The instructions as they appeared in the Cycle 111examiner’smanual are presented in appendix II.) The drawings were made on forms specially printed for thesurvey; these forms provided the same size drawing area as those published for the 1963 Goodenough-Harristest. All drawings which were ob-2viously incomplete at the end of the time allowedand any drawings which a youth said were notcomplete were judged to be invalid and so designated on the test form by the examiner. All invalid drawings were reviewed by supervisorypersonneland the designation changed to validwhen a drawing was judged to be complete enoughfor accurate scoring.Because setting limits on the time allowed todraw is an important modification of the usual instructionsfor administeringthe GoodenoughHarris test, a special study was undertaken tocompare the scores resulting from the evaluationof timed drawings versus untimed.6 A group of 102eighth grade students was tested in a counterbalanced design to assess the effects of group andindividual administrationof the tests. The effectof mode of administrationwas not statisticallysignificant (p. .05), and there was no interactioneffect between mode of administration and orderof presentation. This point being settled, the testwas given to samples of secondary school studentsat ages 12, 14, and 16 in classroom groups for thepurpose of assessing the effects of timed testingprocedurescompared to untimed. Two hundredstudents were selected at each age, so as to berepresentativeof youths in the United States withrespect to father’s occupation as presented in the1960 U.S. Bureau of the Census publications. Halfof the youths in each age sample were tested underuntimed conditions and half were tested accordingto the instructions designed for the Health Examination Survey. Although the difference in meanscores obtained under time and untimed modes ofpresentation was not significant at 12 years of age,it was significant at the .05 level for the 14- and16-year-oldgroups.The results under the Goodenough-Harris(untimed) mode of presentation were generallycomparable with national norms, while those underthe limited time fell below the conditions for thestandard groups from 2-9 points; in half of thecomparisons (by sex of child, sex of drawing, andinstructions)the difference between means exceeded 3 points, but in only two conditions didthe difference exceed 6 points. It was concludedthat while limited time conditions may requiredifferent norms, the effect of the changed testingconditions would not necessarilyinvalidate thetest.
ScoringEach drawing was scored independently by twoscorers using the appropriate Man or Woman scaleof the Goodenough-Harristest. One total score foreach drawing was then obtained by taking the average of the two scores. If the average score was nota whole number, the fraction was dropped.Scoring was done under the direction of JamesL. McCarey at the University of Houston. A totalof 17 scorerswere trained and supervised byMcCarey while scoring the youths’ human figuredrawings. Survey staff members and Dale B.Harris acted as consultants in the solution of problems regarding particular items in the scales.The supervisor of the scoring project was responsible for implementing quality control procedures in an effort to assure valid and reliableresults.Inter scorer reliability coefficients areall 0.86 or almve (appendix I).DRAWINGSIN THE PSYCHOLOGICALSTUDY OF CHILDRENFor many years psychologists, teachers, andperceptive parents have observed that young children use drawings as a “language” to express theirknowledge and ideas. Presumably, then, a child’sdrawings obtained under prescribedcircumstances might be used in the scientific study ofthe child’s thought and behavior. In 1921 Sir CyrilBurt7 included the drawing of a man as one of thetests of individual differences in abilities and performances of school children. He included thisdrawing because he had noted that there is a steadyimprovement with age in the detail and complexityof drawings. He also observed the extraordinarycrudity of drawings by mentally retarded children,although they too tended to show some development with age. His hypothesis was that the abilities required by school work, notably absent inretarded children, might be reflected in the drawing performance.To arrive at an appropriatescore in Burt’s procedure, a child’s drawing wascompared with a set of examples considered asstandards. This score was, however, only one of anumber of components used in assessing abilityand intelligence.In 1926 Florence Goodenough published herDraw-A-Man Test,8 which offered the first ex-plicit, standardized instructions for administeringand scoring a human figure drawing. She used thedrawing of a man because the male figure is commonly found in collections of children’s free drawings and is one of the first subjects spontaneouslyattempted by young children when they begin representativedrawing at about age 3 or 4. She believed the male figure to be preferable to the female because the male garb, being less subjectto fashion and stylistic change, represents a uniform stimulus which can be executed in varyingdegrees from the most simple schematic form tothe most detailed representation.Goodenough used the point score system; thatis, she credited a single point for each of a seriesof features or parts described explicitly in thescoring instructions.These features were selected empirically to meet two criteria: in eachsuccessiveage group a greater percentage ofchildren included the feature, and duller childrenwere less likely than brighter children to haveincluded the feature. The latter criterion of intelligence was assessed very simply; children heldback in school were considered to be relativelydull while those who were accelerated in schoolgrade placement were thought to be the brighterchildren.A total score was achieved by summing theindividual points attained. This point score wastransferred nto a mental age (expressed in yearsand months) by plotting the mean point score valuesmade by children in successive year age groupsand interpolating intermediate values. Accordingto proceduresused at that time, the intelligencequotient (IQ) for a given child was calculated bytaking the ratio of mental age in months to chronological age in months and multiplying by 100.The Goodenough Draw-A-Man Test has beenwidely accepted in the repertoire of the child psy chologist’s tests. From the psychologist’s pointof view the test has many desirable features. Thesimple instructions to “draw a man, make the verybest man you can” are not particularly intimidat-ing. The child seldom thinks of his drawing as atest or examination; young children like to drawand frequntly draw as a means of entertainment.Working on a “test” which resembles a familiaractivity, a child usually behaves naturally andcomfortably, setting the stage for the more formaltesting which follows. Thus a drawing is a simple.3
device for establishing goodrapport. Scoring canbe deferred because theproduct rather than aspectsof the performance is scored.In addition tothese aspects the Draw- A-ManTest has other virtues. It is apevYomnance test;the child is doing something rather than sayingsomething. This isanobviousadvantageforachildwith speech or hearing difficulties. The test isreadily used in situations where complex verbalinstructionsmay not be easily translated. Thusit can be used with children possessing languagehabits with which the psychologist may be unfamiliar.Moreover, this simple test has consistentlyyielded substantialcorrelationswithcomplex verbal and individual measures of intellectual ability.5Under the scrutiny of widespread use, however, Goodenough’s test soon showed certainlimitations. It tended to give decreasing IQ’s in10-, 11-, and 12-years-olds,suggesting that increments in mental age were not sufficiently calibrated and that the test was not adequately measuring abilities in the older age range of childhood.Furthermore,the original standardizationwasaccomplishedbefore modern concepts of sampling and representativenesshad been developed.Goodenough’s norms were clearly not adequatefor contemporary use.During the decade following World War II,a renewed interest in drawings focused on theiruse in assessingpersonality qualities such asaggressiveness,hostility, and insecurity and onfeatures of psychological adjustment such as thefeelings toward self and other people and the direction of sexual urges. There arose a widelyaccepted hypothesis that when the stimulus wasan undesignated “person” rather than a “man,”the sex of the figure drawn was significant inindicating unconscious sex role identification.Consequently, clinical psychologistsmore andmore frequently collected human figure drawingsin which sex was not designated by instructionfor the first drawing. This practice is commontoday. A second drawing of the opposite sex tothat of the first is usually requested. Frequentlyqualitative comparisonsof the two figures areused to interpret personality dynamics.No objective standards for scoring or evaluating such drawings were forthcoming and considerable experimentationby psychologists took4place. A review of the literatureby Cassel,Johnson, and Burns9 in 1958 placed the reliability of such interpretationsat a very low level.considering theThis fact is not surprising,Eventuallylack of standardsfor evaluation.several methods of evaluation were published.Machover 10 described her method in very generalterms in 1949. Buck’s House-Tree-PersonTest(H-T-P),ll-12 published in 1948 and revised in1966, is more specifically described, and somediagnostic features are made quite explicit bymeans of examples. The scoring manual gives abasis for estimating general intellectual leveland goes into some detail concerning the assessment of personalityand adjustment dynamics.Jollesl 3 published his method for the H-T-P in1952. Hammer’s 14 suggestions concerning theH-T-P first appeared in 1954 and he collaboratedin Buck’s revision of 1969. Urban’sl 5 manual ofsigns (1963) for interpreting human figure drawings is limited entirely to personality characteristics. A recent addition to the use of human figure drawings is found in the Kenetic FamilyDrawing Manual published by Burns and Kaufman. 16 This procedure has the virtue of requiringthe subject to draw figures “doing something,”which increases the variety of material availablefor study.Most of these methods of assessmentorevaluation are based on the inspection of printedexamples, sometimesarranged roughly by ageand sometimesby psychiatricor psychologicdiagnosis with a more or less brief descriptionof the individual who produced the drawing. TheKoppitz monograph17 applies a more explicit anddetailed method exclusively to children, and whilethe interpretationof intellectuallevel derivedfrom the children’s drawings is qualitative andhence does not yield as precise and reliable anindex as might by wished, it does offer an empirically derived and data-supported method forinterpreting signs of emotional disturbance whichmay appear in drawings.Harris restandardizedtheGoodenough Draw.A-Man Test in the 1950’s and published his workas the Goodenough-HarrisDrawing Test in 1963.5He also developed a scale for evaluating the drawing of a woman as an alternate form. In both scalesitems were selected for scoring by three criteria:(1) if they were items included by progressively
larger percentages of children through successiveage groups, (2) if they were included signifi cantlymore often by intellectually bright children than byintellectually dull children in each age sample, (3)if the items were included significantly more oftenby children in each age group scoring high on thetest as a whole (less the contribution of the itemconcerned and other points based on that feature)than by children with low total test scores (lesssuch contribution). A fourth criterion, extendingthe second, was furnished by substantial samplesof mentally retardedchildren from educablecla,sses. The percent of these children in each agegroup passing each item was well below that ofdull children in regular school classes.For the second criterion, bright children wereconsidered to be all those in each age groupscoring among the highest 25 percent on intelligence tests in school records and dull childrenwere those scoring in the bottom 25 percent ofeach age group. The raw scores on the tests inschool records were converted to standard scoresto rule out differences in variability of scoresamong various tests. Because of the widespreaduse of “social promotion” in American schools inthe 1950’s, the simpler criterion of age-for-gradeacceleration or retardation as an index of intellectual level was abandoned.Considerable effort, described in some detail in Harris’ text, was expended to extend thescale beyond 12 years, where Goodenough hadterminated it. From Harris’ work it is clear thatthe drawing test discriminatesbest among elementary school age children. The test revealsdecreasing increments in growth after age 12 andthese become minimal by midadolescence. Consequently Harris published norms only throughage 15 and, even at this age, the distribution suggests that a “ceiling-effect” may seriously limitthe variance in the upper portion of the curve.The drawing of a woman can be assessed toyield a score which correlates substantially withthe drawing of a man but not sufficiently to assert that this figure yields an identical estimateof intellectual maturity.The restandardizationconfirmedGoodenough’s earlier finding that girls do somewhatbetter than boys on the test, especially on thedrawing of the woman. Harris concluded that thissex difference was more than a sampling effectand must be recognized as a “real” one, due probably to maturational, cultural, and perhaps drawing proficiency factors. Because sex differencesappeared in many items throughout the scales, hedid not eliminate such items but developed separate norms for boys and girls for each drawing.In the revision the intelligence quotient concept defined as mental age divided by chronological age was abandoned. In keeping with more recent practice,a standard score method (sometimes called a deviation IQ) based on each agewas substituted.In Harris’ revision,a lineartransformationof the distribution of raw scoresinto a distribution of standard scores with a meanof 100 and a standard deviation of 15 was employedwithin each year of age. In this process raw scoremeans and standard deviations serve as the basisfor the transformation(appendix I).For psychologicalpurposesthe standardscore has considerable descriptive and diagnostic value. The exceptionality of a particular scorewithin the distribution for a selected age is givendirectly and the scores are statisticallycomparable from age to age. Moreover a standardscore can be directly converted to a percentilescore, which is more easily understood. For example, a drawing test (man) raw score of 62achieved by a 13-year-oldgirl converts to astandard score of 127. Such a score is exceededonly by 4 percent of 13-year-old girls. It is clearlyan exceptional score. It looks like an IQ, for anIQ of 127 is also superior, but this score is not aratio of mental to chronological age and therefge not an IQ.This standard score is perhaps more readilyunderstood when converted to a percentile score,in this case 96. A percentile score of 96 on thedrawing test is directly comparable with a percentile score of 96 achieved on an arithmeticachievement test. It expresses exactly the samedegree of exceptionality when such scores arebased on the performancesof representativesamples of children. Of course,each test ismeasuring different aspects of ability.The Goodenough-Harrisprocedure includesthe drawing of a woman as well as one of a manto supply a second estimate of ability, but thedrawing of a man is always made first. In theHealth Examination Survey, w ch began beforethe publication of the Harris volume, the more5
general instruction to “draw a person” was used.As indicated earlier, in each case the scoringinstructionsappropriate to the sex of the figuredrawn were used to score that figure. Thus inthis report, four sets of data ,are presented—drawings of a man and of a woman by boys anddrawings of a man and of a woman by girls.An earlier report in this series presentedsimilar data on the drawing test from Cycle 11of the Health Examination Survey for childrenaged 6-11 years. 1 The findings of that study arebriefly summarizedhere as a basis for considering the data on the adolescent population.Harris’ conclusion that there are sex differences in raw scores on drawings of aman seems unwarranted, although girls appear to obtain higher scores than boys ondrawings of a woman.Harris’ original findings of a steady progression of drawing score with age are amply confirmed.The age curves portraying mean raw scoreperformance for Harris’ original standardization sample and for the sample of theHealth Examination Survey diverge steadilyfrom age 6 to age 11, with Harris’ meanscores being greater. This finding is truefor both sexes and for Imth drawings.Discussion of this latter finding consideredpossible effects, such as the facilitating effect ofthe group settings (school classrooms) in whichHarris’ data were gathered compared to the greater control exercised in the individual test situationof the HES. Also pointed out was the obvious factthat the two tests are not the same--Harrisaskedfor three drawings (man, woman, and self) in aprescribed sequence while in Cycle 11only a “person” drawing was requested. Other factors considered in the discussion of the divergent findingswere the effect of time constraint in the Cycle 11procedure, differences in rigor of scoring, andthe possibility that noncognitive factors are’ ‘projected” into human figure drawings, perhaps increasingly with age, and that these factors mayconfound the attempt to measure an imellective6or cognitive factor. Finally, the differences between the sampling procedures used in the twostudies were considered with the possibility thatHarris’ sample, drawn from a school population,contained persons already selected on the basisof intellectual ability.RESULTSRaw ScoresThe data from the present study can be presented briefly. Table A, based on the populationestimates from the survey, shows the percentages of youths of each sex who drew a male or afemale figure in response to the instructions todraw a person. It was found that each sex showeda preference for drawing a figure of their ownsex. Adolescent boys were somewhat more likelyto draw male figures than were younger boys.Over the age spans of 6-11 years and 12-17 years,percentages of own-sex drawings were 84.0 and88.6, respectively.Adolescent girls, however,were less likely than younger girls to draw a female figure. Here the percentages for childrenand adolescents were 80.8 and 75.0, respectively.Table 1 presents raw score means and standard deviations for each type of drawing and eachage and sex group. a Table 2 and figure 1 presentthe same informa
draw is an important modification of the usual in-structions for administering the Goodenough-Harris test, a special study was undertaken to compare the scores resulting from the evaluation of timed drawings versus untimed.6 Agroup of 102 eighth grade students was tested in a counterbal-anced design to assess the effects of group and


