Transcription
Crane Loads & Wharf Structure Design:Putting the Two TogetherAAPA Facilities Engineering SeminarJanuary 2006 – Jacksonville, FloridaArun Bhimani, S.E.PresidentLiftech Consultants Inc.Erik Soderberg, S.E.PrincipalLiftech Consultants Inc.www.liftech.net1 of 85
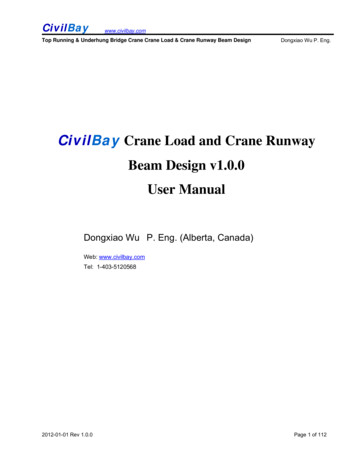
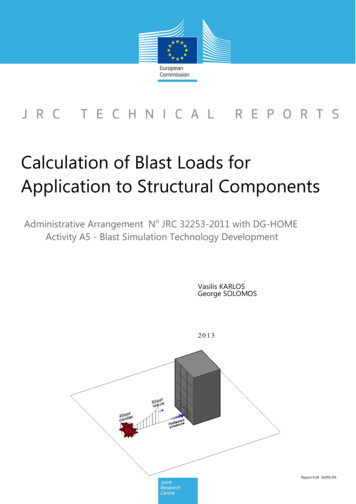
Crane Size Growth:1st Container Crane & Jumbo Crane2 of 85
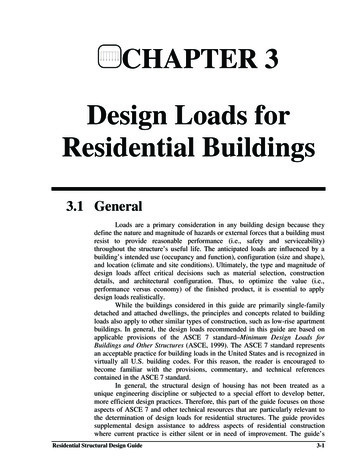
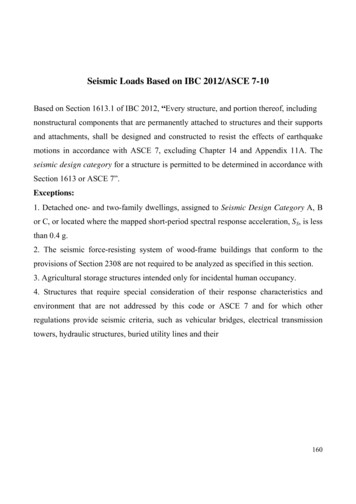
Crane Service Wheel LoadsWaterside Operating Wheel Loads10090Wheel Load(t)807060504030201001960197019801990Year Manufactured3 of 852000
Crane LoadsCrane loads increasingCodes becoming more complexConsequences of misapplication moresevereChance of engineering errors increasing4 of 85
Presentation OutlineThe Problem – OverviewWharf Designer’sPerspectiveCrane Designer’sPerspectivePutting the Two TogetherQ&A and Feedback5 of 85
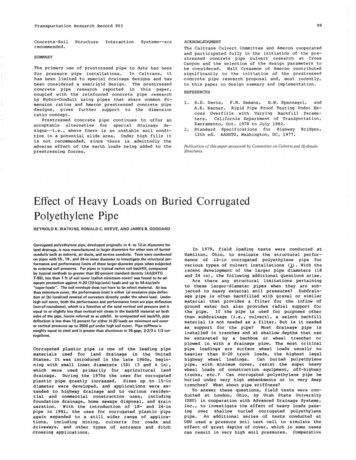
The Problem – raneSupplier6 of 85
Crane Purchaser DifficultiesPurchaser specified“Allowable wheel load: 200 kips/wheel”Suppliers submitSupplier A180 k/wheelSupplier BSupplier C200 k/wheel220 k/wheelWhich suppliers are compliant?7 of 85
Crane Supplier DifficultyPurchaser specifiedAllowable wheel load: 200 kips/wheelIn some cases, linear load (kips/ft)Not definedOperating or out-of-service?Unfactored or factored?Wind profile?Increase for storm condition?8 of 85
Wharf Designer DifficultyClient provides limited crane load dataNo loading patternNo basis given – Unfactored or factored?Same loads given for landside andwatersideNo details of wind or seismic criteria9 of 85
Wharf Designer Perspective10 of 85
Wharf Designer PerspectiveCodes and Design PrincipleCrane Girder DesignDesign for Tie-down LoadsCrane Stop DesignSeismic Design Considerations11 of 85
Codes and Design Principle12 of 85
Design Codes & StandardsCraneFEM, DIN, BS, AISC ,LiftechWharf StructuresACI 318 Building Code andCommentaryASCE 7-05 Minimum DesignLoadsfor Buildings andOther StructuresAISC Steel ConstructionManual13 of 85
Design Principle - Wharf StructureDesignLoad Resistance Factored Design(LRFD)Required Strength Design StrengthRequired Strength Service Loads *Load FactorsDesign Strength Material Strength *Strength Reduction Factor Ф14 of 85
Load Factors & Ф FactorsACI318Load FactorsDto 2002 1.42002 1.2LTenComp Shear1.3 0.90 0.75/.701.6* 0.90 0.70/.65* 1.3 if directionality factor is notincluded15 of 851.71.6WConcrete Ф Factors0.850.75
Design Principle – Soil CapacityAllowable Stress DesignGenerally use service loadsFactor of safety typically 2.0 for operating1/3 increase for storm wind or overload16 of 85
Crane Girder Design17 of 85
Required Crane Geometry DataSill BeamTie-downsBumperStowage pin(n-1) Sn number of wheels per cornerS average wheel spacing18 of 85CL crane
Typical Wheel Loading GeometryTypical Wheel Spacing7 at5’9’7 at5’Recommended Wheel Design LoadGeometry 40’4’40’19 of 85
Dead Loads and Live LoadsWharf LoadsD – Wharf structure self weightL – Wharf live load, includes containers and yardequipment (does not control)Crane Loads (ASCE 7-05)D – Weight of crane excluding lifted loadL – Lifted load or rated capacity20 of 85
ACI Load Factors – Crane LoadingACI 318Yearto 20022002 Load FactorsDLComposite1.41.21.71.61.451.30Some designers treat crane dead load as liveload and use the 1.6 factor. This results in 23%overdesign;1.6 / 1.3 1.23.21 of 85
Example Combination Table:Service Wheel LoadsModeOperatingStowedWOP1 WOP2 WOP3 WOP4 WS1Dead LoadDL1.01.01.01.01.0Trolley LoadTL1.01.01.01.01.0Lift SystemLS1.01.01.01.0Lifted LoadLL1.01.01.0ImpactIMP0.5Gantry LateralLATG 1.0Op. Wind LoadWLO1.01.0Stall Torque Load STL1.0Collision LoadCOLL1.0Storm Wind Load WLS1.0Earthquake Load EQAllowable WheelLS50 x S70 x SLoads (tons/wheel) WS65 x S90 x SS Average spacing, in meters, between the wheels at each corner.Example:S 1.5 m, Allowable LS Operating 50 t/m * 1.5 m 75 t/wheel22 of 85
Example Combination Table:Factored Wheel LoadsModeOperatingStowedWOP1 WOP2 WOP3 WOP4 WS1Dead LoadDL1.21.21.01.01.2Trolley LoadTL1.21.21.01.01.2Lift SystemLS1.21.21.01.2Lifted LoadLL1.61.61.0ImpactIMP0.8Gantry LateralLATG 0.8Stall Torque Load STL1.0Collision LoadCOLL1.0Storm Wind Load WLS1.6Earthquake Load EQAllowable WheelLS60 x S80 x SLoads (tons/wheel) WS75 x S100 x SS Average spacing, in meters, between the wheels at each corner.Example:S 1.5 m, Allowable WS Storm 100 t/m * 1.5 m 150 t/wheel23 of 85
Tie-down Design24 of 85
Multiple Tie-downs at a CornerUneven tie-downforces25 of 85
Causes of Uneven DistributionSome reasons why forces are notevenly distributed:Crane deflectionContruction tolerancesWharf pins not centeredLinks not perfectly straightdue to friction26 of 85UndeflectedShapeDeflectedShape
Tie-downLoadsManufacturers typically provide the service corner upliftforceNeeded data:Factored corner uplift forceDistribution between tie-downsDirection of force (allow for slight angle)27 of 85
Crane Stop Design28 of 85
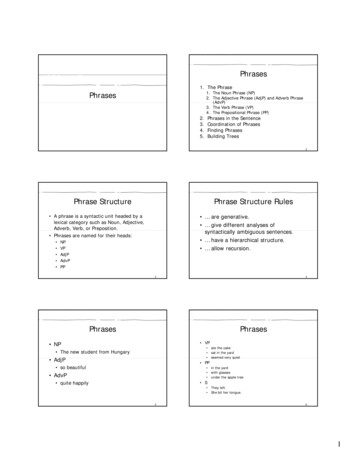
Bumper Load Provided by ManufacturerRated BumperReactionoilgasHBumpers sized forcollision at maximumgantry speedDisplacementmetering pin40353025HDoes not addressrunaway craneV runawaycraneV gantry201510V slow50-1491419Displacement29 of 8524
Recommended Crane Stop Design LoadTipping ForceH maximum load that candevelop, i.e. the load at whichthe crane tips.HD crane weightDH approximately 0.25 x D perstopStability StoolH30 of 85D
Wharf Seismic Design – CraneLoadingThe mass of typical jumbo A-frame cranes can beignoredFor certain wharves and cranes, a time-historyanalysis may be necessaryLarge, short duration wheel loads can be ignoredLocalized rail damage may occurThe crane may derail31 of 85
Crane Designer Perspective32 of 85
Crane Designer PerspectiveBasic LoadsStorm Wind LoadLoad Combinations and FactorsTie-down Loads33 of 85
Basic Loads34 of 85
Dead and Live LoadsDeadLoadsDL: Crane structure weightTL: Trolley structure weightLS: Lift System WeightLive LoadsLL: Rated container loadCraneTrolleyLiftSystem35 of 85RatedLoad
Inertial LoadsIMP:Vertical impact due to hoistaccelerationLATT:Lateral due to trolley accelerationLATG:Lateral due to gantry acceleration36 of 85
OverloadCOLL: CollisionSNAG: Snagging headblockSTALL: Stalling hoist motorsNormally do not control37 of 85
Environmental LoadsWLO: Wind load operating (In-Service)WLS* :EQ:Wind load storm (Out-of-Service)Earthquake load*Often a major source ofdiscrepancies38 of 85
Wind Load, Out-of-Service39 of 85
WLS: Out-of-Service WindWind Force A x Cf x qzA Area of crane elementCf Shape coefficient (including shielding)From windtunnel testingqz Dynamic pressure, function of:Mean recurrence interval (MRI)Gust durationVref2 , where V is a location-specific, coderefspecified reference wind speedExposure (surface roughness)40 of 85Need toclearlyspecify
Shape Coefficient, CfEmpirical values: FEM, BSI, etc.Wind tunnel tests are more accurateBoundary layerAngled wind effectsShielding effects41 of 85
Angled WindWind TunnelTest Liftech EquationsReactionFx0Fz4590135180FzWind Direction, Degrees42 of 85Fx
WLS: Mean recurrence interval (MRI)Wind Force A x Cf x qzA Area of elementCf Shape coefficient (including shielding)From windtunnel testingqz Dynamic pressure, function of:Mean recurrence interval (MRI)Gust durationVref2 , where V is a location-specific, coderefspecified reference wind speedExposure (surface roughness)43 of 85Need toclearlyspecify
Mean Recurrence IntervalProbability of Speed Being ExceededYears in OperationMRI10 yrs1 10.10 .6425.9350.99100.9999725 yrs.04 .34.64.87.9850 yrs.02 .18.40.64.87100 yrs.01 .10.22.39.64Example:Chance of 50-yr wind being exceeded in 25 years: 40%44 of 85
WLS: Gust durationWind Force A x Cf x qzA Area of crane elementCf Shape coefficient (including shielding)From windtunnel testingqz Dynamic pressure, function of:Mean recurrence interval (MRI)Gust durationVref2 , where V is a location-specific, coderefspecified reference wind speedExposure (surface roughness)45 of 85Need toclearlyspecify
Gust Duration46 of 85
Wind Speed vs. Gust Duration1.52Example: converting 10min speed to 3-sec speedVt / Vhour VhourlyV3 V10 min V10 min V3 sec Vhourly 1 V3 V10 min (1.52) 1.04 V3 V10 min (1.46)1.04Ratio of probable maximum speed averagedover “t” seconds to hourly mean speed.Reference,ASCE 7-05.47 of 85Gust Duration (seconds)
Code Gust DurationsCode definitions of basic wind speedCode48 of 85Gust DurationMRIEN 1991-14FEM 1.00410 min50 yrs10 min50 yrsASCE 7-023 sec50 yrsHK 20043 sec50 yrs
Typical Pressure Profiles200175SmoothgradientHeight, m150125Shape of profiledepends 25050010001500Wind pressure, Pa49 of 852000
Variation in WLSVariableMRIVariation25 to 50 yrsGustdurationProfile3 sec to10 minOpen terrainto oceanexposureEffect on V Effect on F *7.5%15.6%46%113%5-10%10-20%*See later slides for effect oncalculated tie-down load!50 of 85
Recommendations for Specifying WLSReturn PeriodUse 50-yr MRIBasic wind speedGust durationUse local civil codeProfileOther factorsShape coefficients Wind tunnel testsDo not mix and match between codesfor pressure and load factors !51 of 85
Corner Reactions – AngledWindDo not use spreadsheet !Use frame analysisprogramFrame stiffness issignificant to reactions52 of 85
Load CombinationsCrane Design53 of 85
Load CombinationsLoad combinationsOperatingOverloadStorm wind (out-of-service)Design approachesGenerally Allowable Stress Design (ASD)54 of 85
Operating Condition LoadsDL:Crane weight*LL:Rated container loadIMP & LAT: Inertial loadsWLO:Wind load, in service*Excluding Rated Load55 of 85
Out-of-Service & OverloadDL:Crane weight*WLS:Wind load storm (out-of-service)Overload Conditions (in and out-of-service)*Including trolley and lift system56 of 85
RecommendationsRequesting crane wheel load dataSpecify wind criteriaAsk for basic loadsCombine per ACI load factorsRequesting crane bidsProvide factored load tablesAsk to fill in tablesSpecify allowable factored loads57 of 85
Tie-down Loads58 of 85
Tie-Down Failures59 of 85
Wind Load & Crane ReactionsFwindDABFstow pin60 of 85F tiedownFgantry
Error in Calculated Tie-down ForceRatio of moments:Fwind h Overturning Momentγ BRighting MomentD2Error in calculated tie-downforce:if “e” error in wind force,FwindDBAFstow pinFgantryFtie-downFTiedown, ActualFTiedown,Calculated61 of 851 B (1 e)FWind h D 2 (1 e )γ 1A 1 B γ 1 FhDWind2 A
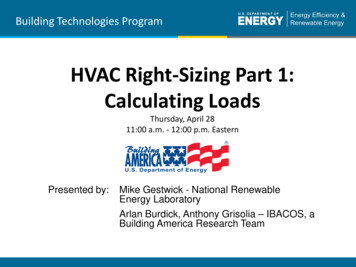
Error in Tie-down ForceTiedown Force Ratio(Actual/Calculated)520% error in V410% error in V35% error in V21No error in V0162 of 8523γ, Overturning Moment / Righting Moment
Example:Error in wind speed 10%; γ 1.4Error in wind pressure 21%Tiedown Force Ratio(Actual/Calculated)520% error in V410% error in V35% error in V21No error in V01Error in calculatedtie-down force 74%!63 of 8523γ, Overturning Moment / Righting Moment
Stability Load FactorsLoadFactorBSIDead LoadTL LSWind Load, 50-yearMRIACI1.01.01.2* 1.6 with ASCE 7-02 “directionality factor”64 of 850.90.91.3*FEM1.01.01.2
Uplift: Factored vs. ServiceServiceFactoredLoadFactorLoadDead Load-500x 0.9 -450Wind LoadCalculated Uplift 450-50x 1.3 585 135“No Uplift”65 of 85“Uplift”
Putting the Two Together66 of 85
Problem RecapCrane supplier and wharf designer work withincomplete and inconsistent dataReasons:Crane supplier generally uses ServiceLoad approachWharf designer generally uses FactoredLoad approachNeither knows what basis the other uses67 of 85
Solution68 of 85
Crane purchaser provide orfacilitate detailed plier69 of 85gnisMi s kLin
Obtain From Wharf DesignerAssumed wheel arrangementService or factoredLoad factorsLoad combinations for operating, overload,and out-of-service conditionsComplete wind criteriaAllowable wheel loads, kips/ft** Crane supplier tends to provide kips/wheel70 of 85
Example Combination Table:Service Wheel LoadsModeOperatingStowedWOP1 WOP2 WOP3 WOP4 WS1Dead LoadDL1.01.01.01.01.0Trolley LoadTL1.01.01.01.01.0Lift SystemLS1.01.01.01.0Lifted LoadLL1.01.01.0ImpactIMP0.5Gantry LateralLATG 1.0Op. Wind LoadWLO1.01.0Stall Torque Load STL1.0Collision LoadCOLL1.0Storm Wind Load WLS1.0Earthquake Load EQAllowable WheelLS50 x S70 x SLoads (tons/wheel) WS65 x S90 x SS Average spacing, in meters, between the wheels at each corner.Example:S 1.5 m, Allowable LS Operating 50 t/m * 1.5 m 75 t/wheel71 of 85
Example Combination Table:Factored Wheel LoadsModeOperatingStowedWOP1 WOP2 WOP3 WOP4 WS1Dead LoadDL1.21.21.01.01.2Trolley LoadTL1.21.21.01.01.2Lift SystemLS1.21.21.01.2Lifted LoadLL1.61.61.0ImpactIMP0.8Gantry LateralLATG 0.8Stall Torque Load STL1.0Collision LoadCOLL1.0Storm Wind Load WLS1.6Earthquake Load EQAllowable WheelLS60 x S80 x SLoads (tons/wheel) WS75 x S100 x SS Average spacing, in meters, between the wheels at each corner.Example:S 1.5 m, Allowable WS Storm 100 t/m * 1.5 m 150 t/wheel72 of 85
Ask Crane Supplier ForWheel arrangementWheel loads for individual loadsCombined wheel loads for operating, overload,and out-of-service conditionsComplete wind criteria used and basis for shapefactorsIndividual and corner factored loads for tie-downsincluding direction of loading73 of 85
Example Design Basic Load TableWharf Designer needs from CraneSupplier74 of 85
RecapObtain detailed crane and wharf designdataStick to one crane design codeStick to one wharf design codeUse consistent design basisFacilitate communication75 of 85
Q&A76 of 85
Crane Loads & Wharf Structure Design:Putting the Two TogetherThank youThis presentation will be available for downloadon Liftech’s website:www.liftech.netArun Bhimani, S.E.PresidentLiftech Consultants Inc.www.liftech.net77 of 85Erik Soderberg, S.E.Principa
Crane Loads & Wharf Structure Design: Putting the Two Together AAPA Facilities Engineering Seminar January 2006 – Jacksonville, Florida Erik Soderberg, S.E. Principal Liftech Consultants Inc. www.liftech.net. 2of 85 Crane Size Growth: 1st Container Crane & Jumbo Crane. 3of 85 Crane Service Wheel Loads Waterside Operating Wheel Loads Year Manufactured Wheel Load (t) 0 10 20 30 40 50