Transcription
The International Archives of the Photogrammetry, Remote Sensing and Spatial Information Sciences, Volume XLII-3/W6, 2019ISPRS-GEOGLAM-ISRS Joint Int. Workshop on “Earth Observations for Agricultural Monitoring”, 18–20 February 2019, New Delhi, IndiaGEOSPATIAL TECHNOLOGY APPLICATION IN LOCAL LEVEL LAND USEPLANNING IN NEPALUmesh K Mandal1,* and Kabita Kumari 21 CentralDepartment of Geography, Tribhuvan University, Kathmandu, Nepal, umesh jee@hotmail.com2 Bernhardt College, Balkhu, Kathmandu, and Nepal,kabitamandal679@yahoo.comCommission III, WG III/10KEY WORDS: Land Use Planning, National Land Use Policy, National Land Use Project, Geospatial technologyABSTRACT:Even though planning process particularly economic development plan and its implementation in Nepal has been initiated with firstfive-year plan in 1952/54, land resource planning was overshadowed and only regional level data base on land use, land system andland capability were produced by Land Resource Mapping Project in 1983/84 and made available for planners and decision makersfor sectoral planning in regional scale. During past, different policies and national planning efforts were made for balanced use ofcountry’s existing natural resources but Nepal has not practiced land-use planning for the country as a whole at local level. It isinitiated only after ninth five year plan (1997-2002) with the establishment of National Land Use Project under Ministry of LandReform and Management and formulation of National Land Use Policy 2013 and its revision in 2015 after devastating earthquake.Land use council, Land use technical committee, District level land use monitoring committee and VDC/municipality level land usecommittee are institutional set ups for implementing planning works done by National Land Use Project at district and local levels.Resource maps produced by different international agency associated with India, Canada, USA, Japan and Finland were worked asbasis for formulation of local level land use plans. Presently National Land Use Project (NLUP) has prepared land resources maps,geo-database and reports covering almost half of total VDCs of the country moreover in Terai region. Seven components of landresources management required for local level land use planning are present land use map, soil map, land capability map, hazard riskmap, land use zoning map, cadastral superimpose on land use zoning map along with its geo-database and report except VDC profile.In first time, geospatial technology-RS, GIS and GPS were extensively applied in preparation of all these resource maps and creationof their geo-database for local level land use planning.1. INTRODUCTIONPlanning process in Nepal has been initiated with the firstdevelopment plan in 1956 after few years of downfall of RanaRule, aiming of improving the wellbeing of people focusing oneconomic development of Nepal (Srivastava, 2008) withoutspatial consideration. Regional approach as a spatial dimensionwas introduced in national development plan only in fourthFive Year Plan(1970-1975) after realizing the fact of spatialdisparity increased in socio-economic development (Gurung,2005). It was not continued till Ninth Five-Year Plan becauseof sectoral coordination, lack of infrastructure development andskilled manpower integrating north-south developmentcorridor/axis.The mapping history of land resources in the country wasstarted with the preparation of first topographical base map atscale of 1” 1 mile during 1950-60 with the co-operation of theGovernment of India and it produced a total of 266 maps sheetscovering the whole country. Lack of geospatial technologyapplication, these maps was suffered as positional inaccuracies,outdated, small scale, non-metric units of measurements anddifferent projection systems and parameters used than thepresent system. In spite of drawbacks, these first topographicalmaps were used for a long period of time in all developmentand administrative activities of Nepal.The application of satellite image was initiated first time inNepal only after 1977, with the assistance of CanadianGovernment; Land Resource Mapping Project (LRMP) waslaunched. Under this project different thematic maps likeland capability , land System , Land Utilization in the scale of1:50 000 were prepared covering entire geographical areas ofcountry along with Geological map, Climatological maps ofNepal based on existing 1" 1 mile and aerial photographs werealso taken in 1978. In the preparation of these maps, Landsatimageries were used for identification of land types, land unitand land use land cover types. Regional level landscape datawere made available for planners, decision makers andacademicians through LRMP maps.In 1989, with the assistance of Japanese Government,Topographical base maps of Lumbini Zone were preparedconsisting of 81 map sheets in the scale of 1:25 000. With thegrant assistance of Finnish government, topographical mappingof remaining zones of eastern and central development regionswere started in 1991. Accordingly a new series of topographicalbase maps at 1:25 000 scale for terai plains and mid- mountainregions and 1:50 000 for the rest area was completed in 2002.In the first phase of the project a total of 294 map sheets wascompleted in 1996 and in the second phase of the project a totalof 255 sheets at a scale of 1:25 000 was completed in 1999 andin the third phase a total of 76 map sheets in the scale of 1:50000 was completed in 2001. Including 81 maps sheets ofLumbini zone, a total of 706 topographical map sheets areavailable. These maps were also not prepared under theapplication of geospatial technology but based on previousLRMP maps and aerial photographs at the same regional levelrather than local level.Regional scale maps were not sufficient for propermanagement of land and its resources for fulfilling the basicneeds of growing population- food, fiber & shelter. In suchsituation, land as the primary natural resource should be centralfor any development activity of the country in terms of itssustainable utilization playing a vital role for the prosperity ofthe country. Therefore, proper land management is a primeimportance for balancing all round development in the countryThis contribution has been es-XLII-3-W6-409-2019 Authors 2019. CC BY 4.0 License.409
The International Archives of the Photogrammetry, Remote Sensing and Spatial Information Sciences, Volume XLII-3/W6, 2019ISPRS-GEOGLAM-ISRS Joint Int. Workshop on “Earth Observations for Agricultural Monitoring”, 18–20 February 2019, New Delhi, Indiaotherwise managing even basic needs such as food, clothes andshelter for the people of future generation will really becamechallenging task. It is mentioned in the land use policy of theNinth Five Year Plan (1997-2002) their emphasis shall be givento classify the arable land by identifying capacity ofproductivity of land. In order to fulfill this policy, national landuse project was established in 2000. A land use council wasconstituted as per the article 51 Cha of land related act 2021(5th amendment) for implementing land use program. Theproject is following the policy, guidelines and implements theprogram as specified by the land use council. In the Tenth FiveYear Plan (2002-2007), implementation of land use programwas included. So, the project initiated its work to updateexisting land resources maps-land use, soil, land capability,risk, land use zone, cadastral superimpose on land use zone forlocal level planning unit like village / municipalitiesdevelopment committees using geospatial technology.2. MATERIALS AND METHODS2.1 Preparation of Land Resource Map and Geo-databaseLand resource map consists of land use, soil, land capability,risk, land use zone and cadastral superimpose in land usezoning map. Satellite image, GIS and differential GPS as thegeospatial technologies were used in processing of satellite dataand other spatial data like topographical and LRMP. Thedetailed methodology of its preparation was given belowthematically as sub-headings.2.1.1 Land useHigh resolution commercial satellite images-Geo-Eye andWorld-View having pan of 0.46 m and mss of 1.85 m spatialresolution with dynamic range of 11 bits radiometricresolution.was first time applied in preparation of updating landuse map in the country. Topographical maps were used forplanning process of GCPs collection with DGPS survey andalso used for feature extraction of dataset such as drainagenetwork, administration boundary, location name, etc. DEMwhich is used for ortho-rectification of satellite images andcreation of DEM based slope, aspect, relief, and hill shadeusing terrain analysis, was generated from digital topographicalmap of 20m contour interval using ANUDEM algorithm withtopoto raster tool. For the geometric correction of opticalimages, there are two mathematical approaches- rigorous sensormodel (RSM), which is parametric based on satellite orbitalparameters, is used in direct geo-referencing techniques andrational polynomial co-efficient (RPCs), which is non–parametric or generic and advanced form of RPF model. TheRPC model has universally used for interior and exteriororientation of each satellite images for transformation of imagecolumn and row values of the original image to object groundco-ordinates using third order polynomials for numerator anddenominator of at least 80 coefficients. Resolution merge orimage fusion as a techniques of pan sharpening was used tocreate a high resolution multispectral data by the fusion processof high resolution panchromatic data with lower resolutionmultispectral data. Rectified satellite image was classified usingthe supervised classification method adopting the maximumlikelihood classifier algorithm. Error matrix was generated tosee the level of classification accuracy from training samplescollected during the field visit. Visual image interpretation wasalso performed using interpretation keys and classified featurewere verified in the field. Seven hierarchy classification of landuse classes mentioned in Land Use Policy 2015 were identifiedin processed image.2.1.2 SoilSoil survey methodology adopted for the local level planningcomprises of three activities- desk study, soil survey and soillaboratory analysis. The desk study comprised of the study ofthe existing maps and reports- LRMP land system & report,topographic map, geological map and data- related to soil,geology, terrain/DEM,high resolution satellite image-pan andMSS( world view-2, Geo-Eye-1 & IKONOS) as well as otheraspects relate to the study area. These layers were integrated byGIS analysis, digital photogrammetry and remote sensingtechniques and GPS enabling digital modeling of the landscapein micro-scale to effectively delineate each soil mapping/landform unit and its association with the soil. These land unitswere taken as soil mapping units for detailed soil survey.Anaglyph using satellite image and digital terrain model weredeveloped and used for interactively 3D perspective visualizingthe terrain. High resolution satellite imagery Geo-Eye & WorldView having 2m spatial resolution in MSS was used forvisualization of the terrain landform units in order to perceivethe soil variation in characteristics. The soil survey was carriedout by digging standard soil pits size of 1m3 in each identifiedrepresentative soil mapping unit. A vertical cross-section of thesoil pit profile was studied for each layer by texture, colour,structure, consistency, presence of pores, roots and insectsburrows/worm casts, stoniness, compaction, clay etc. In addition, physiographic, landform, parent material, drainage,vegetation and land use of each site and surrounding werestudied. All these information related to site characteristics,general information of soil and detailed description of eachindividual horizon were recorded in standard description formdeveloped by National Land Use Project (NLUP).Soil laboratory analysis included the testing of chemicalcharacteristics of individual soil samples representing tophorizon (A) at different soil test laboratories- regional soil testlaboratory of Hetauda and Pokhara, ATC and NEST as private.Routine test like pH, texture, organic matter, total nitrogen,available phosphorous and potassium were determined by usingmethods, 1:2.5 Water Suspension, Hydrometer & TextureClassification of USDA, Walkley and Black , Microjeldahl,Olson & Bray and Sulphuric Acid Extraction by colorimeterrespectively for plant nutrition/fertility assessment.2.1.3 Land CapabilityLocal level land capability classification was done using geospatial technology viz. GIS, GPS and RS. Spatial analysis inGIS was performed to integrate soil and terrain parameters todesignate capability classes, arability classes, deficiency subtype and sub-type unit. A multi-criteria evaluation rule wasdeveloped to classify soil mapping units based on soilparameter, fertility, erosion susceptibility, terrain constraintsand surface drainage (wetness). Land capability evaluationcriteria comprised of soil fertility, topography, erosionsusceptibility and surface drainage. Soil fertility evaluation isbased on ratings soil parameters (NARC 2013) related to topsoil of rooting depth, workability (soil texture), soil drainage(permeability), alkalinity and acidity, content of organicmatters, total nitrogen, available phosphorus, and availablepotassium. Similarly, topographic criteria are related to thesteepness of the terrain slopes and surface dissection limitingthe sustainable use of land and it requires careful managementThis contribution has been es-XLII-3-W6-409-2019 Authors 2019. CC BY 4.0 License.410
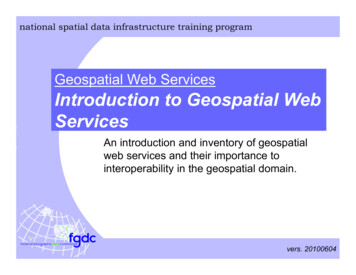
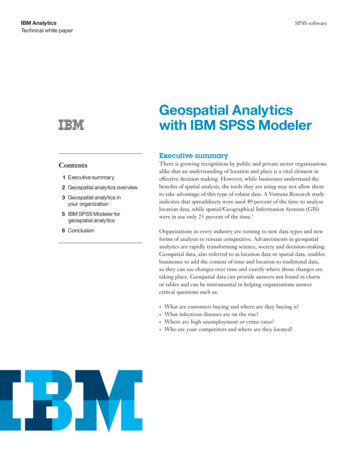
The International Archives of the Photogrammetry, Remote Sensing and Spatial Information Sciences, Volume XLII-3/W6, 2019ISPRS-GEOGLAM-ISRS Joint Int. Workshop on “Earth Observations for Agricultural Monitoring”, 18–20 February 2019, New Delhi, Indiawith terracing and maintaining vegetation cover to mitigate soildegradation.Erosion susceptibility criteria are based on susceptibility ratingof different types of erosion like rill, sheet and gully affectingthe potential of soil loss due to erosion. Likewise surfacedrainage (wetness) criteria pertain to the drainage condition ofsurface in terms of frequent flooding, water logging and highwater table as the problems affecting the productivity and useof land.Finally land capability classification is performed evaluatingall parameters mentioned above using weighted compositescore based on multi-criteria analysis.Weighted compositescore (WCS) is a systematic procedure for developing factorweights required for preparing capability map. The weightsassigned to different factors were obtained by subjective toexpert judgment. The larger the weight, the more important isthe criterion in the overall capability class as described byMalczewski (2000). In developing the weights, an individualfactor was ranked as low, medium, and high and very highweight were assigned as 1, 2, 3 and 4 respectively based on 4point scale. Weighted Composite Score (WCS) was employedbased on parameter weight and individual weighted value as 4,3, 2 and 1 corresponding to very high, high, medium and lowrank of concerned factor respectively. The final value ofweighted composite score (WCS) for each soil mapping unitwas calculated by summing all individual factors valueobtained by multiplying individual factor weight rank valuewith their corresponding weight of parameters (Grose, 1999;Store and Kangas, 2001).2.1.4 RiskEven though local level land use planning in Nepal has beeninitiated from 2008, risk assessment was added only afteroccurrence of devastating earthquake in Sep 25, 2015 in orderto have safe land use zoning process. Potential different typesof risk such as fire, flood, landslide, seismic, industrial and theirproximity of occurrences, risk can be hierarchically classifiedas different level: such as high, medium and low.Fire risk was studied though detailed field investigationregarding to community forest, settlement status, industries andpetro-chemical station and the recording of past firing conditionand through the extensive consultation with governmentrepresentatives at various levels, experts and professionals,local communities and industrial stockholders.Flood risk and vulnerability mapping was conducted integratingdifferent approaches- geographic using GIS and RS, modelingof rainfall-runoff processes using US Army Corps of EngineersHydrological Engineering Corporation’s River System Analysis(HEC-RAS) model; and social flood hazard mapping based onlocal people’s perceptions and experiences. Multi-criteriaweighted scoring index was used to assess landslide hazardassessment by identifying spatial distribution of landslides inhigh resolution satellite image. The analyzed data has beentaken from the secondary sources. Maps of epicentre of theearthquake in Nepal himalaya, and probabilistic seismic hazardassessment map of the Nepal Himalaya were used to assessseismic hazard by using empirical method rather than simplestmethod and dynamic analysis method due to unavailability ofparameters-design input motion, the soil structure model andthe properties of the rock materials. Industrial risk was alsoassessed by detailed field investigation and consultation ofstakeholders and proximity neighborhood analysis to bemapped of areas potentially polluted. Geo-spatial technologyalong with high resolution satellite images, household survey,group discussions, field observation and published andunpublished documents were used in all types of riskassessment.2.1.5 Land Use ZoningLocal level land use zoning is performed mainly by using geospatial technology based spatial analysis and multiple criteriaanalysis on several available data sets-present land use,socioeconomic, land capability and multi-hazards considering thespecified zones mentioned in specification guided by NationalLand Use Policy-2015(GON/MLRM 2015). The guidingprinciples of land use zoning are- necessity of land, itscomposition, capability, current use and appropriateness.2.1.6 Cadastral superimpose on land use zoningCadastral maps for entire country were prepared fromsystematic cadastral survey conducted in 1967 using plane tableleveling at different scales (Bhumichitra, 2000). Department ofLand Information and Archive (DoLIA) started to keep andupdate land parcel records by digitization from 1993 after itsestablishment (Bhandari 2017). The missing cadastral mapswhich were not updated by DoLIA, were scanned at 300 dpiand geogreferenced at national coordinate system (MUTM).These cadastral maps were superimposed in land use zoningmaps to quantify the number of land parcels and their spatialextent by per land use zones specified for local level planningof resources at village/municipality development committeelevel.2.2 Preparation of Bio-physical and Socio-economic ProfileSocio-economic profile including bio-physical condition forlocal level planning unit was prepared by collecting informationon physical, economic, social, historical, and environmentalaspects, and land resource, agriculture, forest, livestock etc.together with infrastructures, services and population growthand migration through check-list, focus group discussion (FGD,key informants information (KII) and recorded documents inlocal units required for the land use zoning.3. RESULTS AND DISCUSSIONS3.1 Present Land Use ClassificationFor the local level land use planning in Nepal, present land usewas classified as seven-tier hierarchical scheme mentioned inNational Land Use Policy-2015 and it had further sub-classesemploying hierarchical classification basis upto seven levels.The level-1 categories of the land use consisting of elevenclasses were as Agriculture (AGR), Forest (FOR), Residential(RES), Commercial (COM), Industrial (IND), Public Service(PUB), Mine and Minerals (MIN), Cultural and Archeological(CULARCH), Riverine and Lake Area (HYD), ExcavationArea (EXC) and Other (OTH). Agricultural land use wasfurther sub-categorized in level-2, level-3, level-4, level-5 andlevel-6 based on physiographic location, irrigation or moisturecondition, micro-relief location, crop rotation or croppingpattern and cropping intensity respectively. Similarly, forestland use was further sub-categorized upto seven hierarchicallevels representing climatic vegetation zone at level-2, covertype at level-3, dominant species types at level-4, crown densitytypes at level-5, maturity classes at level-6 and ownership oruse right at level-7. Likewise, residential land use has furtherfour levels of hierarchical classification characterizing houseThis contribution has been es-XLII-3-W6-409-2019 Authors 2019. CC BY 4.0 License.411
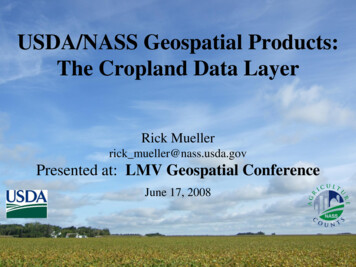
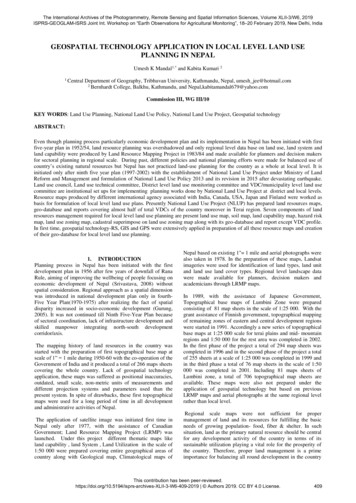
The International Archives of the Photogrammetry, Remote Sensing and Spatial Information Sciences, Volume XLII-3/W6, 2019ISPRS-GEOGLAM-ISRS Joint Int. Workshop on “Earth Observations for Agricultural Monitoring”, 18–20 February 2019, New Delhi, Indiadensity at level-2, historical development of settlement at level3 and purposes of house or building use. In the same way,commercial land use was also sub-categorized upto four levelsindicating nature of functions performed at level-2, sectorsproviding services at level-3 and individual functions at level-4.Industrial land use was sub-classified only upto second levelrepresenting nature and size of manufacturing products. Publicservice land use was also further sub-classified upto four levelsbased on the criteria of types of services provided at level-2,individual services at level-3 and designated name at level-4.Mines and mineral land use was also sub-categorized upto fivelevels representing metallic/non-metalic/material type at level 2, individual element at level-3, license/non-license at level-4and operating condition at level-5. Cultural-archeological andlake- riverineland use were also sub-categorized at onlysecond-level based on its typology. Excavation land use weresub-categorized upto three levels indicating nature of materialat level-2 and licensing condition at level-3.1 and its present land use types representing Level-1 was shownin Figure 1. Striking point is that there are seven land use typesprescribed in National Land Use Policy-2013 where as it isextended upto eleven classes and their sub-classes in revisedpolicy-2015.3.2 Soil ClassificationFor the local level fertility assessment in Nepal, soilclassification was performed based on USDA soil classification(USDA, 2010) scheme as mentioned in National Land UsePolicy-2015. Physical and chemical characteristics of soil wereanalyzed based on USDA soil manual and guidelines (USDA2017). Ranking status of physical and chemical parameters ofsoil with respect to required for crops were analyzed usingguidelines developed (NARC 2013). Soils were classified basedon order, sub-order, great group, sub-group, family and seriesbased on soil taxonomy. Routine test of pH, organic matter,total nitrogen, available potassium & phosphorous and textureclasses of epipodon were analyzed and linked to the fertilitystatus of agriculture crops required. As an illustration, geodatabase of soil classification of Aanbu Khaireni, RuralMunicipality of Tanahun District was depicted in Table 2 andits mapping at sub-group level was shown in Figure 2.Table 1: Geo-database of present land use classification ofAanbu Khaireni rural municipality, Tanahun district, Nepal.Figure 2: Soil classification of Aanbu Khaireni, ruralmunicipality of Tanahun district, Nepal.Figure 1: Present land use types of Aanbu Khaireni, ruralmunicipality of Tanahun district, Nepal.Other land use was sub-classified as grass land, bamboo andorchard at level-2 and their climatic vegetation zone type atlevel-3 and specific species at level-4. As an illustration, geodatabase of present land use classification of Aanbu Khaireni,Rural Municipality, and Tanahun District was depicted in TableSurface interpolation maps of primary nutrients like soilreaction, organic matter, total nitrogen, available potassium andphosphorous were prepared using geo-statistical technique ingeo-spatial domain. Soil fertility assessment was performedfrom the information of primary nutrients derived from top-soil.The information viz. cation exchange capacity (CEC) and baseThis contribution has been es-XLII-3-W6-409-2019 Authors 2019. CC BY 4.0 License.412
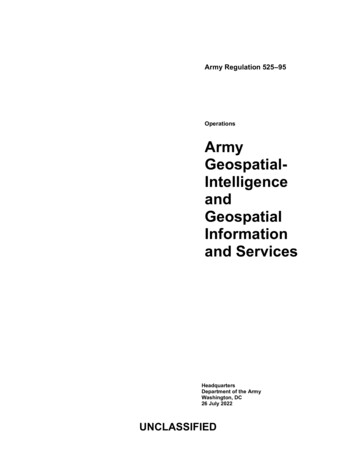
The International Archives of the Photogrammetry, Remote Sensing and Spatial Information Sciences, Volume XLII-3/W6, 2019ISPRS-GEOGLAM-ISRS Joint Int. Workshop on “Earth Observations for Agricultural Monitoring”, 18–20 February 2019, New Delhi, Indiasaturation of sub-soil are found essential for comprehensivestudy of soil STIFLUVENTSTYPICUSTIFLUVENTSFAMILYSANDY LOAMHYPERTHERMICFLUVENTIC USTOCHREPTSSANDY LOAMHYPERTHERMICANTHROPIC USTORTHENTSSANDY LOAMHYPERTHERMIC REPTSANTHROPICUSTOCHREPTSSANDY LOAM THERMICANTHROPIC ORTHENTSLOAM THERMIC TOCHREPTSLOAM HYPERTHERMICTYPIC HAPLUSTOLLSSANDY LOAMHYPERTHERMIC USTALFSSANDY LOAM THERMICUDIC STALFSTYPICDYSTROCHREPTSLOAM THERMIC SSANDY LOAM THERMICTYPIC DYSTROCHREPTSOc1Oc1Or3Fl1costs and/or with less management requirements and/or lessrisk of damage to land compared to any other classes of land.Class- II is superior to Classes 3 to 7 but less superior to ClassI, and so on. Class I to III, are considered as capable ofsupporting cropping activities on sustainable basis. Class IV issuited for forestry. Class V is suited for grazing pastures andfodder collection. Class VI has severe limitation and consideredfragile and suitable for rough seasonal grazing only. Class VIIland comprises of rock and snow cover with severemanagement limitations which cannot be corrected. As anexample, land capability classification of Aanbu Khaireni,Rural Municipality of Tanahun District was depicted in Table 3and its mapping was shown in Figure 3.Us5Oc1Table 2: Geo-database of soil classification of Aanbu Khairenirural municipality, Tanahun district, Nepal.3.3 Land Capability ClassificationLand capability classification for local level land use planningin Nepal was performed based on principles of USDA landcapability classification (Grose, 1999) and guidelines of LRMPland capability report (LRMP, 1986) considering criteria of soilfertility, topographic, erosion and surface drainage along withspecific management limitation pertaining to the soil forsustainable agricultural uses in particular soil mapping rea(ha)% 0.140.001AuIVAu2150.1616.8BhIVBh213.21.67Non arable (Forest and buildings)8990.3770.24Water body717.635.61Total12799.8100.00Table 3: Land capability classification of Aanbu Khaireni ruralmunicipality, Tanahun district, Nepal.Capability classification was adopted three hierarchical levelsclasses indicating the general degree of limitations to use; subclasses representing the dominant kind of limitation based onsoil, topographic, erosion and wetness and unit differentiatesbetween lands with similar management and conservationrequirements as well as productivity characteristics.The land capability classes in Nepal comprise seven classesranked in order of increasing degree of limitation and indecreasing order of adaptability for agricultural use. Class- Iland is identified as the best suited land producing wider rangeof crops and pastures at higher levels of production with lowerFigure 3: Land capability classification of Aanbu Khaireni,rural municipality of Tanahun district, Nepal.3.4 Multi-risk hazardEven though, the National Land Use Policy-2013 has focusedon the protection of arable lands ensuring food security; multirisk hazards were added as one of essential components of locallevel land use planning in Nepal only after the devastatingearthquake of April 25, 2015 occurred and having exposed usto non-vulnerable secured human settlement in the country.Multi-hazards like fire, landslide, and flood, seismic andindustrial were studied adopted respective methodologiesmentioned above having safe to erect any physicalinfrastructure and sustainable local level land use planning toaddress all contemporary issues on a long term basisparticularly for overall goal of planning- land use zoning. Allthese existing hazard types were separately analyzed and theirrisk areas were identified on ordinal scale-high, medium & low.Landslide and flood were found most probable affecting largerareas in hills and terai region respectively.This contribution has been es-XLII-3-W6-409-2019 Authors 2019. CC BY 4.0 License.413
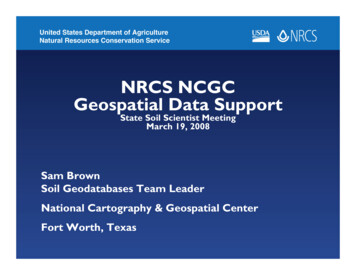
The International Archives of the Photogrammetry, Remote Sensing and Spatial Information Sciences, Volume XLII-3/W6, 2019ISPRS-GEOGLAM-ISRS Joint Int. Workshop on “Earth Observations for Agricultural Monitoring”, 18–20 February 2019, New Delhi, IndiaSimilarly forest fire and settlement fire were also identifiedmost occurred hazards in mountain-hill and terai regionrespectively particularly in dry season due to lack of awarenessand appropriate care. For example, composite risk map ofAanbu Khaireni, Rural Municipality of Tanahun District wasshown in Figure 4.other specified land use based on principle of land necessity,c
base maps at 1:25 000 scale for terai plains and mid- mountain regions and 1:50 000 for the rest area was completed in 2002. In the first phase of the project a total of 294 map sheets was completed in 1996 and in the second phase of the project a total of 255 sheets at a scale of 1:25 000 was completed in 1999 and