Transcription
Power BIEnterprise ProjectGood and Best PracticesFor designing scalable & manageable solutions
aul TurleySqlServerBi.blog@Paul TurleyPrincipal Consultant, Pragmatic Works
ObjectiveSet of guidelines that address manyaspects of new projects.Recommendations are applicable in mostuse cases.Living document with ongoing revisionswith the goal to provide a comprehensive,best practices guide as the platformcontinues to mature and as expertscontinue to use odand-best-practices
This Session is: NOT a 100-level introduction to Power BI NOT a technical “how-to” deep dive but we willdiscuss some technical topics Guidelines for experienced Business Intelligence &Power BI practitioners Some good knowledge for less-experienced Power BIdevelopers
So Here’s the Problem: Opportunity: I want you to ask questions You need to understand some basics before much of thiswill make sense The topics covered in this session could be coveredthoroughly in one or two weeks If the answer to your question isn’t simple or within thecontext of this presentation, I may address it offline We can talk after the session
Bad, Good and Best PracticeBad PracticeGood PracticeBest PracticeBetter practice exists.Has negative outcome undercertain conditions.Avoid making this mistake.A clear best practice may notexist.There may be multiple "good"options.Choice may be a matter ofpreference or opinion.Clearly the best choice.Technique or feature is wellunderstood and accepted inthe industry.Always do this for bestoutcome.
Project Types Formal projects are scoped, funded, staffed and executed with thecollaboration of a business champion and stakeholders; and ITBusiness Intelligence developers and data managers. These projectspromote business and IT-governed datasets and certified reports. Informal projects are executed by business users and are consideredad hoc in nature. Datasets are generally not IT governed, and reportsare typically not certified. Hybrid projects can be anything in-between. They might be a userauthored report using published, certified dataset used for selfservice reporting. Informal, self-service datasets can be migrated togoverned datasets in collaborative IT/business projects.
IT-managed BI Solution DevelopersFormal project teams might include: Business Systems Analysts BI Solution Architects Project Managers Data Transformation (ETL) Developers Enterprise Data Modelers Measure code experts (using DAX) Report Developers Operations & Deployment Engineers
Solution ArchitectureAll Business Intelligence projects involve thesame essential components including: Source Queries Data transformation steps Semantic data model Calculations (typically measures) Data visualizations that reside on: reports report pages dashboardsComposite models AggregationsEmbedding service B2B SharingPremium capacity All employeesCertified datasets Self-service reportingPro license Share with small groupDesktop/Free service Web sharing
Managing Power BI Desktop Files Store in a centrally managed network-assessable folderThe storage folder should support automatic backup and recovery in the case ofstorage loss. Report and dataset developers must open files from the Windows filesystemFiles must either reside in or be synchronized with the Windows file system. Files containing imported data typically range in size from 100 to 600 MB. Any sharedfolder synchronization or disaster recovery system should be designed to effectivelyhandle multiple files of this size.Options: OneDrive For Business (shared by team, with folder synchronization). SharePoint or SharePoint Online (with folder synchronization). GitHub and/or VSTS with local repository & folder synchronization. If used, Git must beconfigured for large file storage (LFS) if PBIX files are to be stored in the repository.
Datasets and ReportsSingle PBIX FileSSAS with Power BIPower BI Datasets Generally can have the same or more features and capabilities than SSAS data models. In Premium capacity, Power BI datasets can perform and scale as well as SSAS data models with up to 3 or 12GB of compressed data, depending on the capacity level. SSAS & AAS requires additional licensing or usage fees. These are included with Power BI licensing whenusing Power BI datasets. Without Premium capacity, Power BI datasets in shared capacity may not perform as well as SSAS with morethan 8-10 concurrent users, or during peak usage in the shared capacity service. SSAS or AAS ensures consistent capacity and performance without Premium dedicated capacity, so it mightmake more sense to use SSAS or AAS when Power BI Premium capacity isn't cost-effective or with very largedata volumes that exceed Premium capacity limits.
Version Control & Lifecycle Management At the present time, Power BI has no integrated version control mechanism. In addition, Power BI is incompatiblewith most version control systems that perform branching and differencing operations on code and script filesthat are common in application development projects. Power BI (PBIX and PBIT) report and dataset files arestored as binary archive files with internal checksum metadata. Change and differencing operations performed bymost code and version management systems will corrupt these files and render them inoperable. Reality: Integrating changes made to multiple PBIX files is difficult to manage and challenging to performtechnically. Even with differencing tools and effective version-control, just avoid multi-developer work on PowerBI dataset files. Leverage Power BI's simplicity and don’t over-engineer release management or version control. Until toolingexists to automate deployments, keep this is simple as possible. If deployment must be automated, usePowerShell to deploy datasets and reports to a workspace from a file system folder or staging workspace in theservice. File versions Store the dataset and report PBIX files separately using a version number postfix for the file name in the followingthe format: Major.Minor.Revision. For example:Manufacturing Cost Analysis Dataset v1.5.3.PBIX
Version Control & Lifecycle ManagementAdd a Version History table to the data model by using the “Enter Data” feature inPower Query to create a table containing these columns: Version NumberRevision Date/TimeDeveloper NameRevision Notes
Workspace and App Management Power BI platform currently lacks a formal process or mechanism Existing tools don’t work (VSTS and Azure DevOps) Release management tools are being developed but in the early stagesFor a formal project, create the following workspaces: DEV Workspace - Only development team members need Contributor access tothis workspace. This workspace does not need to have Premium capacity; unless,developers need to unit test incremental refresh or other Premium features. QA Workspace - All testers must have View access for testing and Contributoraccess for report authoring. Should be in Premium capacity to test incrementalrefresh. PROD Workspace - Omit the “PROD” designation in the name. This workspacewill be the name of the published app that users will see in their Apps, Home andFavorite pages so use a name that is simple and sensible. Must have Premiumcapacity to share the app with non-Pro licensed users.PowerShell script may be used to publish datasets and reports, and to change dataset bindings. It is possible to either publish to aproduction workspace or to effectively move assets from one workspace to another. This approach is discussed briefly in the Power BIEnterprise Deployment Guide. Other approaches are discussed here: Power BI release management
Dimensional Design Build star schemas – wherever possible, reshape data into fact a dimension tables with single key, one-to-many relationshipsfrom dimensions to fact. The art of dimensional modeling ranges from simple to complex. Refer to The Kimball Method fordetails: sionalmodeling-techniques/ Enforce dimension key uniqueness – Just because a key value “should” be unique, there is no guarantee that it will be unlessenforced at the data source. Perform grouping and duplicate reduction in the data source views or Power Query queries toguarantee uniqueness. Duplicate record count checks and other mechanisms can be applied to audit source data for integritybut do not allow the data model to violate these rules. Avoid bi-directional filters and unnecessary bridging tables – These data modelling patterns adversely affect performance. Calculated columns – Should be applied in Power Query and not in DAX calculated columns wherever possible. Thismaintains a consistent design pattern for maintainability. Annotate code – Use in-line comments and annotations in all code including SQL, M and DAX; to explain calculation logic andprovide author and revision information. Hide all fields not used directly by users. These include: primary and foreign key columns, numeric columns used to createmeasures, and columns used to specify the sort order of other fields. Set to Do Not Summarize – Any non-hidden numeric columns that are not intended to roll-up or summarize values shouldbe set to “Do Not Summarize” in the Modeling ribbon in Power BI Desktop. Columns set to summarize are indicated with aSigma icon.
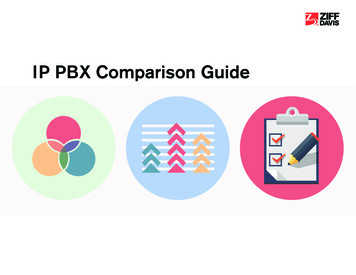
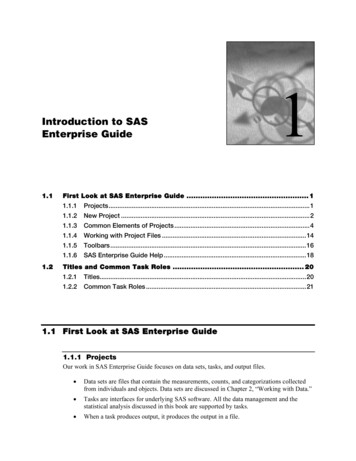
Query OptimizationQuery Source ObjectPower Query Query(table, view, file)(“M” code produces folded source query)Data Model Table(calculations performed in DAX) Avoid using SQL statements in PQ queries. Use database views.Views and tables support query folding. SQL statements do not. Perform column transformations in view or PQ? – use maintains the query?Remove unnecessary columns & filter rows early in the queryConsolidate field renaming, removing fields and data type changesAdd custom columns in Power Query instead of calculated columns in DAX,where possible Use friendly field names for all fields that won’t be hidden in the data model Rename steps and add annotations in M script
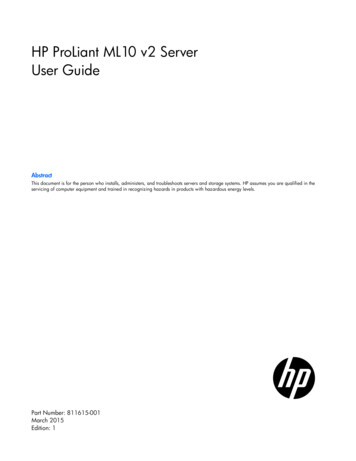
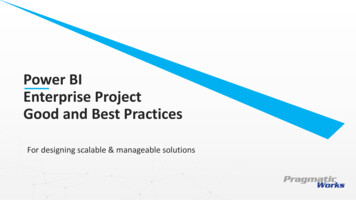
Managing Dataset Size with Parameters Use parameters whetherimplementing incrementalrefresh or not RangeStart & RangeEndparameters must be date/timetype Apply range filteron date/timecolumn inPower Query*Incremental Refresh is a Premium feature
Implicit and Explicit MeasuresImplicit measure numeric field with default summarizationExplicit measure Defined using DAX expression Implicit measures are typically OK in informalprojects Measures should be explicitly defined in formaldata models Implicit measures don’t work in some client tools
Promote Self-service ReportingNon-governed Data Teach & support analyst users touse Power BI to acquire, mashup& model data “make mistakes, get messy”Governed Data Separate datasets from reports Publish to a secured & managedworkspace Promote & Certify datasets– Lilly Tomlin, Miss Frizzle Use dataflows for standardized Deploy to “user” designatedcommon data modelsworkspaces Enable users to connect to User-authored solutions be usedpublished datasets & createto prototype & pattern governed their own reportsdata models
Operational & Paginated Reports Power BI is not a replacement for paginated, operational reporting For static, multi-page, printable reports; use SQL Server ReportingServices (SSRS) instead of Power BI SSRS (now called “Paginated Reports”) is integrated into the Power BIservice with Premium capacity licensing and can be integrated withinteractive Power BI reports and Power BI data datasets To a limited degree, some operational reports can be reproducedusing Power BI reports and SSRS can be used, some a limited degree,to create interactive reports
If Users Need Excel, Give them Excel Teach analyst users how touse Excel with Power BI Don’t “export” “connect” “Analyze In Excel” allows Excelto connect, live, to apublished Power BI dataset Available to Power BI Prolicensed users Now available to “free”licensed users in a Premium
Certified & Shared Datasets Use Dataset endorsement& certification in theservice Certification can bemanaged by security group Access to datasets can berestricted to certifieddatasets Organization definescertification policy &provides documentation
Enterprise Scale OptionsIn many ways, Power BI has now surpassed the capabilities of SQL Server AnalysisServices. Microsoft are investing in the enterprise capabilities of the Power BIplatform by enhancing Power BI Premium Capacity, adding Paginated Report andfeatures to support massive scale specialized use cases. Consider the present andplanned capabilities of the Power BI platform; before, choosing another datamodeling tool such as 8/12/13/data-model-options-for-power-bi-solutions
Project Preparation ChecklistSolution Audience: Categorize the solution by identifying theauthor & user roles related to the project: Author role: Business Data Analyst Author role: Skilled Data Modeler, Analyst,Data Scientist Author role: IT BI Developer Users’ role: Report/Dashboard Consumer Users’ role: Self-service Report Author Design separate dataset and report PBIX Define File naming standardsfiles for formal projects with more than one Decide on dataset and report namesdataset & report developer, to coordinatework Define the Version Control & LifecycleManagement: Use SSAS/AAS as a data modeling optionwhen those databases exist or where IT Postfix files with 3-part versionoperations insist o managementnumberdevelopment and maintenance through Remove version number fromintegrated source control (e.g. Visualpublished files in QA and PRODStudio Team Services & Azure DevOps) Identify the Project Type & related SolutionArchitecture: Create Version History table in PowerQuery Project type: Formal project Increment version numbers in datamodel Project type: Informal project Backup PBIT files for archiveTraining and Usability Support: Project type: Hybrid project Develop & Document Support & trainingplan for users: Architectural approach: Single PBIX Create measures: Last RefreshDate/Time Users’ role: Advanced Data Analyst Usability training for read-onlyreport/app users Self-service reporting for NoviceReport Authors & Data Analysts Identify the Solution Type for the project.This will guide other project managementdesigns: Design single PBIX file for small group,departmental project authored by onedeveloper for a limited group of users Architectural approach: Separatedataset and report PBIX Architectural approach: Report PBIXconnected to SSAS or AAS Understand DirectQuery model trade-offsand special use cases. Avoid if possible. Create storage locations and folderstructure for Development filemanagement: Development file storage Create measure: Current Version Add data model info page to report Define your Release Management, DevOps& Automation strategy (if any – Might beOK to deploy files manually) (to automateor not to automate)Assign licenses and access: Assign Pro licenses to all developers,admins and report author users (QA?) Assign Free licenses to all users ifPremium/app deployment will be used Assign membership and access toworkspacesQuery Design: Create fact date range filter parameters:RangeStart & RangeEnd Filter large fact tables with range filters,consider incremental refresh policies if slowand/or over 800 MB compressed. Design source queries (T-SQL?) to reshapesource data into conformed dimension &fact tables Create views in database for eachdimension and fact Decide on Workspace and App Enforce key uniqueness to remove allManagement, workspace & app name, etc.:duplicate keys from all dimension tables Create PROD workspace (omit PRD from Query Date dim/lookup table at source if itname), assign dedicated capacity if availableexists Create QA workspace (post-fix name with Design & deploy a separate dataset PBIX file Team member collaboration environment &QA), assign dedicated capacityprocesses– from report file(s) – when the dataset Create DEV workspace (postfix name withshould be branded as a Certified dataset Folder synchronizationDEV), dedicated capacity not required If not available, generate Date dim/lookuptable in Power Query
Project Preparation ChecklistData Model Design: Avoid bi-directional relationshipwherever possible Include code annotations &comment blocks in: views, Mqueries, measures Hide all key columns and othercolumns not used directly by users Hide all measure base numericcolumns Set all non-aggregate-able numericcolumn default summarization to“Do Not Summarize” Format add whole numbers withthousand separators Format all currency & decimalmeasures to defined standard Use parameters to filter and reduce(perhaps 2 decimals, thousanddataset PBIX size to 400 MB or lessseparator) Create incremental refresh policiesfor dataset larger than 500 MB Use Premium capacity workspacesfor datasets approaching 900 MB Use Premium capacity workspacewhen you need to share reportswith non-Pro licensed user For non-Pro licensed user, convertQA (and then PRD) workspace toapp and distribute the app to usersvia AD group membership Create explicit measures for allaggregate-able column values Format all ratios and percentagewith appropriate decimal positions Use the DIVIDE function for alldivision operations to avoid div byzero Name all measures and user-visiblefields with mixed-case, short,friendly sentence-like terms Precede measure group table namesvisualization requirementswith “ ” so they sort to the top ofdocumented & maintained?the list. (display folders are notMisc:ready for use in Power BI Desktop)Project Discipline (as a team decide): When to increment the revision/fixnumber When to increment the minorversion number Who owns the migration to QAprocess? How is it implemented? Who own migration from QA toPROD? How is it implemented? How is user/stakeholder sign-offobtained? How are data source requirementsdefined, presented & documented? Who owns & maintains therequirements log? Assign measures to fact table wherethey logically belong – or to an How are measure & KPI calculationempty measure group table.requirements documented & Measures that don’t have anobvious home (fact) table should beassigned a measure group table.maintained? How are the report design, layout & What is the organization & projectstyling & branding standard? Does the organization have astandard brand image? Where is itdocumented? How owns thatstandard & can answer questions? Should report be designed formobile consumption (with mobilelayouts)? Utilize dataset endorsements tocategorize Shared, Promoted andCertified datasets to manage datagovernance expectations for selfservice report users
hank YouSqlServerBi.blog@Paul TurleyPlease connect with me using one of these mediums
-Use in-line comments and annotations in all code including SQL, M and DAX; to explain calculation logic and provide author and revision information. Hide all fields not used directly by users. These include: primary and foreign key columns, numeric columns used to create measures, and columns used to specify the sort order of other .