Transcription
Introduction to SASEnterprise Guide1.11.21First Look at SAS Enterprise Guide . 11.1.1Projects.11.1.2New Project .21.1.3Common Elements of Projects .41.1.4Working with Project Files .141.1.5Toolbars.161.1.6SAS Enterprise Guide Help .18Titles and Common Task Roles . 201.2.1Titles.201.2.2Common Task Roles .211.1 First Look at SAS Enterprise Guide1.1.1 ProjectsOur work in SAS Enterprise Guide focuses on data sets, tasks, and output files. Data sets are files that contain the measurements, counts, and categorizations collectedfrom individuals and objects. Data sets are discussed in Chapter 2, “Working with Data.” Tasks are interfaces for underlying SAS software. All the data management and thestatistical analysis discussed in this book are supported by tasks. When a task produces output, it produces the output in a file.
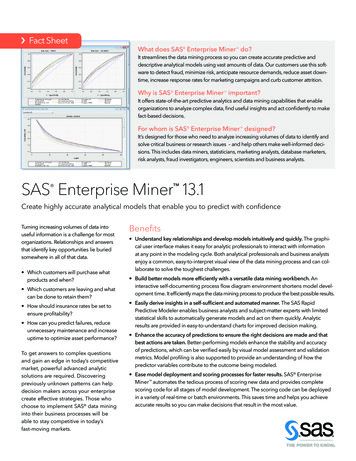
2 Statistics Using SAS Enterprise GuideoThe file may be some form of text file, such as an HTML file or a Microsoft Wordfile. The file may be a SAS data set.oOptions related to these files are generally under a Results heading.Activity in SAS Enterprise Guide is organized into projects. A project is a record of the data setsthat have been opened, the tasks that have been run, the results that have been produced, and therelationships between these objects. One project at a time is opened in SAS Enterprise Guide.A project is represented graphically as a project tree in the Project Explorer and as a process flowdiagram in the Project Designer. See Figure 1.2 and Figure 1.3.The information about the project is in a project file. A project file can be saved and copied. Itcan contain many types of items. In particular, a project file can contain: Shortcuts to the data sets that have been opened. Details about the tasks that have been run. Output files that are not data sets. Shortcuts to output data sets.1.1.2 New ProjectSAS Enterprise Guide opens with the window in Figure 1.1. An existing project can be opened ora new project can be created.Figure 1.1 Welcome Window
Chapter 1: Introduction to SAS Enterprise Guide 3For the current discussion, select New Project (project. See Figure 1.2.Selecting New SAS Program (Selecting New Data (set.). SAS Enterprise Guide opens with a new) creates a new project and opens a window for writing code.) creates a new project and opens a window for creating a new SAS dataFigure 1.2 SAS Enterprise Guide Window Opening with a New ProjectThe numbers in Figure 1.2 identify the main areas of the SAS Enterprise Guide window.Menu bar. Everything can start from here. The menu bar is referenced throughout thebook.Toolbars. See the “Toolbars” section.Workspace. This contains the Project Designer and any opened files. The ProjectDesigner contains one or more process flow diagrams. See .Task List. This lists all the tasks both by category and by name.Project Explorer. The name of the project is at the top. The elements of the project arelisted below in project tree form. The default name of a new project is Project. This ischanged to the name of the project file when the project is saved. The new project shownin Figure 1.2 contains an empty process flow diagram named Process Flow. See .
4 Statistics Using SAS Enterprise GuideBy default the Task List window is unpinned ( or ). The window opens when the cursoris above its tab. It stays open as long as the cursor is over the window.By default the Project Explorer window is pinned ( orEnterprise Guide window and stays open.). The window opens with the SASClicking an unpinned icon changes the window to pinned. Clicking a pinned icon changes thewindow to unpinned.A process flow diagram in the Project Designer. The name Process Flow is a defaultname and can be changed. A project can contain many process flow diagrams. Thesediagrams illustrate the contents, the connections, and the directions in the project.Task Status. This shows the status of the underlying code as it is being executed.1.1.3 Common Elements of ProjectsThis section uses Example 3.9 in Section 3.6 to present elements that are common in projects.Figure 1.3 shows the SAS Enterprise Guide window after completion of both examples in Section3.5. The process flow diagram Example 3.9 is seen in the Project Designer.Figure 1.3 SAS Enterprise Guide Window Applied to the Examples in Section 3.514121113The numbers in Figure 1.3 identify elements of the current project.The project name sec3 5 in the title bar. The project file is sec3 5.egp.The active data set is Attitude on the Example 3.9 process flow diagram.The project name sec3 5 atin the Project Explorer.The iconindicates a process flow diagram. This section of Project Explorer isassociated with the process flow diagram Example 3.9.
Chapter 1: Introduction to SAS Enterprise Guide 5indicates a shortcut for a SAS data set. This shortcut is for the Attitude dataThe iconset. The shortcut is also in the Example 3.9 process flow diagram.The One-Way Frequencies task has been applied to the Attitude data set.Files associated with running the One-Way Frequencies task:Last Submitted Code is the underlying SAS code.Log has the details associated with the task’s execution.HTML - One-Way Frequencies is the task output in HTML format.RTF - One-Way Frequencies is the task output in rich text format.Example 3.9 is the tab of the process flow diagram showing in the Project Designer.11121314Example 3.10 is the tab of a hidden process flow diagram in the Project Designer.Attitude is the data source for the One-Way Frequencies task in the Example 3.9 processflow diagram.The One-Way Frequencies task has been applied to the Attitude data set. The sameoutput is in two files.HTML - One-Way Frequencies is the task output in HTML format.RTF - One-Way Frequencies is the task output in rich text format.RTF - One-Way Frequencies tab in the workspace.1.1.3.1 Opening a Data SetExample 3.9 begins with opening the SAS data file Attitude on the local computer. A moregeneral discussion is in Section 2.2.6, “Opening an Existing SAS Data File.”1.From the Standard toolbar, the Open icon () is selected.2.Then Data is selected from the drop-down menu.3.Local Computer is selected on the Open Data From window. See Figure 1.4.Figure 1.4 Open Data from Window4.The Open From My Computer window opens. In Figure 1.5, the author has navigated tothe Data Appendix folder in his computer. The SAS data file Attitude is opened.5.Labels and shortcuts for the SAS data file Attitude appear in the Project Explorer andProject Designer. See and in Figure 1.3.
6 Statistics Using SAS Enterprise GuideFigure 1.5 Open from My Computer Window1.1.3.2 Active DataWhen a task opens, it uses the data set that is currently designated as the active data set. Thename of the active data set is shown in the Active Data toolbar. See The toolbar shows Attitude (Example 3.9). The active data set is Attitude in the Example3.9 process flow diagram.in Figure 1.3 andin Figure 1.12.To select a data set to be active: Click the example data set’s icon on the Project Explorer or the Project Designer. Alternatively, select its name from the drop-down menu on the Active Data toolbar.1.1.3.3 Project Designer and Process Flow DiagramsThe Project Designer contains the project’s process flow diagrams. A process flow diagram(PFD) graphically represents: data sets, tasks, and results associated with the project relationships between these objectsA new project opens with one PFD named Process Flow. A PFD name can be changed. A projectcan have multiple process flow diagrams.
Chapter 1: Introduction to SAS Enterprise Guide 7To change a PFD name:From the Project Designer:1.Right-click the name on the PFD tab identified by the PFD icon (2.Select Rename from the pop-up menu. The Rename window opens.3.Enter the new name in the entry box. Click OK.).From the Project Explorer:1.Right-click the name by the PFD icon ().2.Select Rename from the pop-up menu. The name is in a box for editing.3.Change the name. Press Enter on the keyboard or click a region on the screen outside theediting box.To add a new PFD:From the menu bar, select File New Process Flow.From the Standard toolbar, select Create New Item In Project Process Flow.From the Project toolbar, select New Process Flow.Figure 1.3 has two process flow diagrams. See andExample 3.10. The former is seen in the workspace. They are named Example 3.9 and The Attitude data set ( ) is the data source for the One-Way Frequencies task( 11 ). The output of the task is in an HTML file ( 12 ) and a Microsoft Word RTF file ( 13 ). SeeOutput 1.1 in the “Output” section.1.1.3.4 Formats for ResultsResults can be in five formats. See Figure 1.6. HTML, PDF, and RTF formats can be sent toexternal viewers. See Figure 1.7. HTML: This is the default format. HTML is the basic Web browser format. See the iconat 12 in Figure 1.3. See Output 1.1 in the “Output” section. PDF: Portable document format opens with Adobe Acrobat Reader. RTF: Rich text format opens with Microsoft Word. See the icon at 13 in Figure 1.3. TheRTF output is in Output 3.7 in Section 3.6.2, “Task Output and Interpretation forExample 3.9.” SAS Report: A SAS format. Text output: Plain text format.
8 Statistics Using SAS Enterprise GuideTo select result formats and viewers:From the menu bar:1.Select Tools Options.2.The Options window opens. Select Results General on the left. The Results Generaloptions are shown in Figure 1.6.3.Check the desired formats.4.HTML, PDF, and RTF can be viewed within SAS Enterprise Guide or in an externalviewer. See the viewer options in Figure 1.7. The default is Enterprise Guide.5.When finished, click OK.Figure 1.6 Results General Options with HTML and RTF Selected
Chapter 1: Introduction to SAS Enterprise Guide 9Figure 1.7 Viewer Options1.1.3.5 TasksAlmost all tasks have the same format as the One-Way Frequencies task shown in Figure 1.8. There is a selection pane on the left that lists groups of options. See Once selected, the group of options appears in the task window under the group title. See. Help messages for items in the task window are shown beneath the options area. SeeThis is discussed in the “SAS Enterprise Guide Help” section.The Titles group of options is common to most tasks and is discussed in general in Section 1.2. Itcontrols the titles and the footnotes in the task output.The One-Way Frequencies task is discussed in Section 3.6.2, “Instructions for CreatingFrequency Distributions with the One-Way Frequencies Task.”
10 Statistics Using SAS Enterprise GuideFigure 1.8 One-Way Frequencies Task with Task Roles Showing11The numbers in Figure 1.8 identify elements of the One-Way Frequencies window that isshowing the Task Roles options.Task name and data source in the title bar: One-Way Frequencies is being applied to theAttitude data set.Selection pane: Task Roles is selected.Title of options group: Task Roles.Variables to assign lists the variables in the data source. The red bell ( ) indicatescharacter data. The blue ball ( ) indicates numeric data.Task roles lists roles appropriate for the task. A variable is assigned to a role by draggingit from Variables to assign to the role. A variable can be removed from a role bydragging back to the Variables to assign box. The arrows can also be used to assign andremove variables.The roles Group analysis by, Frequency count, andRelative weight are common to many tasks. These arediscussed in general in Section 1.2.2, “Common TaskRoles.”
Chapter 1: Introduction to SAS Enterprise Guide 1111Help for items in the task window. Message in Figure 1.8 is for the selection pane.Preview Code shows the underlying SAS code. New code can be inserted.Run executes the task.Save closes the task window and keeps changes. The task is not executed.Cancel closes the task window without saving changes.Help opens SAS Enterprise Guide Help for the current task options.1.1.3.6 Repeating a TaskA task can be reopened, the options changed, and the task repeated. To reopen a task: Double-click the task icon in the Project Explorer or in the Project Designer. Or right-click the task icon in the Project Explorer or in the Project Designer. SelectOpen from the pop-up menu.When a task is run or saved again, the window in Figure 1.9 asks how the results are to behandled.Figure 1.9 Choices for the Results of a Repeated TaskThe question is “Would you like to replace the results from the previous run?” Yes replaces the old output with the new output. No adds a new section in the Project Explorer and a new branch in the Project Designerfor the repeated task and the associated files. Cancel returns to the task window.1.1.3.7 OutputThe output for Example 3.9 is in Output 1.1. It is in HTML format, which is the default formatfor results. The output in RTF format is in Output 3.7 in Section 3.6.3, “Task Output andInterpretation for Example 3.9.” Virtually all output in this book is in RTF format. When that isthe case, titles are not repeated and the footnotes are dropped.
12 Statistics Using SAS Enterprise GuideOutput 1.1 Output for Example 3.9 in HTML Format1.1.3.8 Simple Color Changes with Interactive GraphsThe background color and the color scheme of all the interactive graphs have been changed inthis text. The ActiveX control and Java applet output formats are interactive.
Chapter 1: Introduction to SAS Enterprise Guide 13The background color of the graph in Output 1.1 has been changed to white. The color schemehas been changed from custom to grayscale. The result is Output 1.2.Output 1.2 Example 3.9 Graph with Grayscale Color Scheme and White BackgroundTo change the color scheme and the background color:1. Right-click the graph and select Graph Properties from the pop-up menu.2.The Properties window appears.3.The Graph tab is shown in Figure 1.10.a. At Scheme, select the desired color scheme from the drop-down menu. Grayscale isselected in Output 1.2. See Figure 1.10.to open the Background color palette. Select the desiredb. At Background, clickcolor. White is selected in Output 1.2. Click OK to return to the Properties window.The selected color is shown in the box to the right of Background.4.Click OK when finished.
14 Statistics Using SAS Enterprise GuideFigure 1.10 Properties Window for Interactive Graphs1.1.4 Working with Project FilesProjects can be opened, closed, and saved on the File menu. Items through in Figure 1.11are for projects. Item is not for projects. It is included here to help avoid confusion.Figure 1.11 Project Items and Save Text Items on File MenuThe circled numbers in Figure 1.11 refer to the following:New Project creates a new project. See Figure 1.2.
Chapter 1: Introduction to SAS Enterprise Guide 15Open Project opens an existing project. See the “Opening a Project” section below.Recent projects are listed near the bottom on the File menu.Close Project clears the Project Explorer and the Project Designer. Opened files areclosed.If there are unsaved changes when any of the previous threeitems are selected, a window will appear asking whetherchanges are to be saved.Save current-project-name saves the current project to the same file and location. Savecurrent-project-name As is used to save the current project to a different file or location.See the “Saving a New Project or Saving a Project As” and “Saving the Current Project”sections below.Save file-name and Save file-name As save SAS code files and other text files. The twoitems are inactive until such a file is selected.A project takes on the name of its project file. In Figure 1.3 in the “Common Elements of Projects” section, the project name is sec3 5.See in the title bar and at top in the Project Explorer. The project file is sec3 5.egp.Project files can be opened from and saved to a Windows folder or a SAS Enterprise Guidebinder. SAS Enterprise Guide is a Microsoft Windows client application. A project file is openedand saved in the standard manner. A SAS Enterprise Guide binder is a virtual folder corresponding to a folder on thecomputer or a server. For information about adding binders, refer to SAS EnterpriseGuide Explorer: User’s Guide.1.1.4.1Opening a ProjectWindows folder1. From the menu bar, select File Open Project.2.The Open Project window opens. Select Local Computer.3.The Open From My Computer window opens.4.Files of type is set to Enterprise Guide Project Files (*.egp).5.Navigate to and open the desired file.SAS Enterprise Guide Binder1. From the menu bar, select File Open Project.2.The Open Project window opens. Select SAS Servers/Folders.3.The Open From SAS Servers/Folders window opens.4.Select Binders on the left-hand side.
16 Statistics Using SAS Enterprise Guide5.Files of type is set to Enterprise Guide Project Files (*.egp).6.Navigate to and open the desired file.1.1.4.2Saving a New Project or Saving a Project AsWindows Folder1. If saving a new project, select File Save Project from the menu bar or select the SaveProject icon on the standard toolbar.2.If saving as, select File Save current-project-name As from the menu bar.3.The Save current-project-name To window opens. Select Local Computer.4.The Save As window opens.5.Save as type should be Enterprise Guide Project Files (*.egp).6.Navigate to the desired folder and save the file.Enterprise Guide Binder1. From the menu bar:a. If saving a new project, select File Save Project.b. If saving as, select File Save current-project-name As.2.The Save current-project-name To window opens. Select SAS Servers/Folders.3.The Save To SAS Servers/Folders window opens.4.Select Binders on the left-hand side.5.Files of type is Enterprise Guide Project Files (*.egp).6.Navigate to the desired binder and save the file.1.1.4.3 Saving the Current ProjectTo save the current project to the same location:1.From the menu bar, select File Save current-project-name.2.On the standard toolbar, select Save current-project-name.1.1.5 ToolbarsThe four of the five toolbars shown in Figure 1.12 are alternatives to the menu bar. The exceptionis , the Active Data toolbar.
Chapter 1: Introduction to SAS Enterprise Guide 17Figure 1.12 Available ToolbarsStandard toolbar has icons that are also seen in the File and Edit menus.o First group:Create New Item In Project and Open add objects to the project.Save current-project-nameoSecond group: Print, Cut, Copy, Paste, DeleteoThird group: Undo, RedooFourth group: Find (to search for text in data files and code files that are opened inthe workspace)View toolbar has icons that are also seen in the View menu.o Project Designer opens process flow diagrams in the work space. See ProjectDesigner and Process Flow Diagrams in Section 1.1.3, “Common Elements ofProjects.”oMaximize Workspace unpins and closes other windows.oTask Status opens the Task Status window.Project toolbar has icons that are also seen by selectingFile New: New Project, New Process Flow, New Stored Process, New Data, NewCode, New Note, or New Report.This toolbar is not automatically shown. To show this toolbar, select on the menu bar:View Toolbars Project.Active Data toolbar names the active data set. The active data set can be selected fromthe drop-down menu on the toolbar.Figure 1.3 shows Attitude (Example 3.9). The active data set is Attitude on the Example3.9 process flow diagram. See Active Data Set in Section 1.1.3, “Common Elements ofProjects.”Control toolbar has icons that are also seen in the Code menu. These are used whenexecuting SAS code. The icons are Run and Stop.
18 Statistics Using SAS Enterprise Guide1.1.6 SAS Enterprise Guide HelpSAS Enterprise Guide has a thorough Help capability. From the menu bar, select Help SAS Enterprise Guide Help. See Figure 1.13.Figure 1.13 SAS Enterprise Guide Help oThe online SAS Enterprise Guide manual is available on the Contents tab.oThe Index, Search, and Favorites capabilities are available. Index and Search arebased on a wide range of SAS manuals.F1 on the keyboard provides context-sensitive help.oFor example, the window in Figure 1.14 appears after you click on a process flowdiagram and press F1.oSAS Enterprise Guide Help displays the appropriate page from the online manual.The page is highlighted on the Contents tab. In Figure 1.14, the page About processflows is discussed in the “Working with Process Flows” section of the Contents tab. Help provides help for the current task options. See 11 in Figure 1.8 in the Tasks section.Clicking Help opens SAS Enterprise Guide Help to the appropriate page in the onlinemanual. The page is also highlighted on the Contents tab. Help is shown in the task windows for specific options. See in Figure 1.8 in the Taskssection. Also see Figure 1.15 below. In Figure 1.15, the cursor is hovering overFrequencies and percentages with cumulatives. The What is ? window describes selected options. In Figure 1.16, the cursor ishovering over Maximize Workspace in the View toolbar. To open this window, selectView What is. The tutorial “Getting Started with SAS Enterprise Guide” is an excellent way to becomefamiliar with SAS Enterprise Guide. It works through examples using data that is comeswith the software. To start the tutorial, select Help Getting Started Tutorial.
Chapter 1: Introduction to SAS Enterprise Guide 19Figure 1.14. About the Process Flow Window in SAS Enterprise Guide HelpFigure 1.15 Statistics Options in One-Way Frequencies TaskHelp forFrequencies and percentageswith cumulatives
20 Statistics Using SAS Enterprise GuideFigure 1.16 What is ? Describes Maximize Workspace on View Toolbar.1.2 Titles and Common Task RolesInstructions for most tasks refer back to this section. The Titles group of options is common andis discussed here. Three task roles that occur often are also discussed here.1.2.1 TitlesThe Titles options are the same in each task. Figure 1.17 shows the Titles options for the OneWay Frequencies task. Section lists the possible sections of task output plus the footnotes. Checked sections arethose being requested. Text for section: item-name corresponds to the item selected on the section list.oWith Use default text checked, the default title or footnote can be seen in theinactive text box.oClearing the check box makes the text box active. The title or footnote can be edited.The default Footnote gives system information, date, and time. For example:Generated by the SAS System (Local, XP HOME) on 19NOV2005 at 10:22 AM
Chapter 1: Introduction to SAS Enterprise Guide 21Figure 1.17 Titles Options in the One-Way Frequencies Task1.2.2 Common Task RolesGroup analysis by, Frequency count, and Relative weight task roles are fairly common and arediscussed here. Group analysis by: Variables assigned to this role create groups of observations. Allobservations having identical rows in these variables form a group. The task is appliedseparately to each group. The task output is in a single file but there are separate resultsfor each group.In Figure 1.18, Gender is assigned to the Group analysis by role. The Gender values Fand M create two groups in the analysis variable Location. The One-Way Frequenciestask is applied separately to each group.When a variable is assigned to this role, the variable’s sort order drop-down menuappears. See Gender sort order on the right in Figure 1.18.oThe unformatted values may be sorted in ascending (the default) and descendingorder, if Sort by variables is selected.oIf Sort by variables is not selected, the groups are listed in the order that the valuesoccur in the data.
22 Statistics Using SAS Enterprise GuideFigure 1.18 Task Roles Options in One-Way Frequencies Task Frequency count: The rows of this variable list the frequencies that the respectiveobservations occur in the sample. If no variable is assigned to the Frequency count role,all the frequencies are assumed to be 1. Relative weight: The rows of this variable list weights that the respective observations aregiven. If no variable is assigned to the Relative weight role, all weights are 1.
Selecting New SAS Program ( ) creates a new project and opens a window for writing code. Selecting New Data ( ) creates a new project and opens a window for creating a new SAS data set. Figure 1.2 SAS Enterprise Guide Window Opening with a New Project The numbers in Figure 1.2 identify the main areas of the SAS Enterprise Guide window. n Menu bar.