Transcription
Carey et al. Sports Medicine - Open(2021) INAL RESEARCH ARTICLEOpen AccessVideo Analysis and Verification of DirectHead Impacts Recorded by WearableSensors in Junior Rugby League PlayersLauchlan Carey1, Douglas P. Terry2,3,4,5, Andrew S. McIntosh6, Peter Stanwell1, Grant L. Iverson2,3,4,5 andAndrew J. Gardner1,7,8,9*AbstractBackground: Rugby league is a high-intensity collision sport that carries a risk of concussion. Youth athletes areconsidered to be more vulnerable and take longer to recover from concussion than adult athletes.Purpose: To review head impact events in elite-level junior representative rugby league and to verify and describecharacteristics of X-patchTM-recorded impacts via video analysis.Study Design: Observational case series.Methods: The X-patchTM was used on twenty-one adolescent players (thirteen forwards and eight backs) during a2017 junior representative rugby league competition. Game-day footage, recorded by a trained videographer froma single camera, was synchronised with X-patchTM-recorded timestamped events. Impacts were double verified byvideo review. Impact rates, playing characteristics, and gameplay situations were described.Results: The X-patchTM-recorded 624 impacts 20g between game start and finish, of which 564 (90.4%) wereverified on video. Upon video review, 413 (73.2%) of all verified impacts 20g where determined to be direct headimpacts. Direct head impacts 20g occurred at a rate of 5.2 impacts per game hour; 7.6 for forwards and 3.0 forbacks (range 0–18.2). A defender’s arm directly impacting the head of the ball carrier was the most commonevent, accounting for 21.3% (n 120) of all impacts, and 46.7% of all “hit-up” impacts. There were no medicallydiagnosed concussions during the competition.Conclusion: The majority (90.4%) of head impacts 20g recorded by the X-patchTM sensor were verified by video.Double verification of direct head impacts in addition to cross-verification of sensor-recorded impacts using asecondary source such as synchronised video review can be used to ensure accuracy and validation of data.Keywords: Head impacts, Rugby league, Wearable sensors, Accelerometer, Video review* Correspondence: Andrew.Gardner@newcastle.edu.au1Centre for Stroke and Brain Injury, School of Health Sciences, Faculty ofHealth, University of Newcastle, Callaghan, New South Wales, Australia7Hunter New England Local Health District Sports Concussion Program,Waratah, NSW, AustraliaFull list of author information is available at the end of the article The Author(s). 2021 Open Access This article is licensed under a Creative Commons Attribution 4.0 International License,which permits use, sharing, adaptation, distribution and reproduction in any medium or format, as long as you giveappropriate credit to the original author(s) and the source, provide a link to the Creative Commons licence, and indicate ifchanges were made. The images or other third party material in this article are included in the article's Creative Commonslicence, unless indicated otherwise in a credit line to the material. If material is not included in the article's Creative Commonslicence and your intended use is not permitted by statutory regulation or exceeds the permitted use, you will need to obtainpermission directly from the copyright holder. To view a copy of this licence, visit http://creativecommons.org/licenses/by/4.0/.
Carey et al. Sports Medicine - Open(2021) 7:66Key Points There was a substantial number of false-positivehigh acceleration impacts recorded that occurredbefore, during, or after the games. Wearable instrumented technology has limitations as a primary datasource and should be used in conjunction with videoreview. The vast majority of high acceleration impacts ( 20g) that occurred during game time were verifiedon video review. Careful time synchronisation of impact sensorrecorded events and match video is vital to helpcross-validation and to reduce over-estimation of anathlete’s direct head impact exposure.BackgroundRugby league carries a risk of concussion due to its highintensity and frequency of collisions [1]. Youth athletesmay be more vulnerable to sustaining a concussion [2–4] and may also take longer to recover from a concussion than adult athletes [5–8]. Recently, various technology has been introduced to assist in the identification ofhead impacts and suspected concussions during athletecompetitions. For instance, sideline video review [9, 10],and to a lesser extent, impact sensors in helmeted andnon-helmeted sports have been introduced to measurekinematic forces to the head [11, 12].Sideline video review has become increasingly common in professional sports for identifying head impactevents and potential concussions. Recently, multiple experts from seven national and international professionalsporting codes developed international consensus definitions of video signs of possible concussion, agreeing onsix video signs: (i) lying motionless (for 2 s); (ii) motorincoordination (e.g. losing balance); (iii) impact seizure;(iv) tonic posturing (involuntary sustained contraction ofone or more limbs); (v) no protective action/floppy; and(vi) blank/vacant look [9]. The National Rugby League(NRL) has incorporated a Head Injury Assessment(HIA) process that uses sideline video review as amethod to identify direct head impacts and potentialsigns of concussion in players. The identification of aplayer displaying potential signs of concussion evokesthe HIA process, which includes mandatory immediateremoval from play and subsequent assessment [13]. During the 2014 season, the incidence of suspected concussions based on the use of this process was 24.0 per 1000NRL player game hours [13]. In the same season, the incidence of medically diagnosed concussions followingthe use of this process was 8.9 per 1000 player gamehours [14].Another proposed method for ascertaining whether apossible concussion occurred during gameplay has beenPage 2 of 13measuring the kinematic responses of a player’s head toimpact forces through wearable sensor technology. TheX2 X-patchTM is an impact sensor designed for nonhelmeted athletes that has been used in three previousrugby league studies in junior, women’s, and semiprofessional competitions [15–17]. Worn behind the ear,the X-patchTM uses a triaxial gyroscope and accelerometer to calculate linear and angular accelerations experienced by the head during collisions [18]. Previous XpatchTM studies in under 10-year-old rugby league [15]and under 9-year-old rugby union [19] reported on impact magnitudes comparable to studies on young adults.However, given that the X-patch-recorded impacts werenot verified on video, the validity of these findings isquestionable [20]. Some studies have examined helmetedimpacts in 15- to 17-year-old athletes (e.g. AmericanFootball [21–24], Lacrosse [18]) using wearable sensors,but no studies have examined impacts in similarly agedrugby league players. Given that a direct head impact ismore likely to result in a concussion than an indirecthead impact [25], the relevance of player characteristicsand gameplay situations to the relative risk of sustainingconcussion may be an important consideration. The purpose of this study is to (i) determine the rate at whichsensor-recorded impacts using the X-patchTM are verified on video review of game footage, (ii) document thenumber of video verified direct head impacts that arenot recorded on the sensors, and (iii) describe and compare playing characteristics and gameplay situations ofvideo-verified direct and indirect impacts over a seasonof play in a squad of elite-level youth (under 16s) rugbyleague players.MethodsParticipantsA prospective cohort study was performed on a juniormale representative rugby league team during the 2017New South Wales (NSW) Rugby League Harold Matthews Competition. The Harold Matthews competitionis an elite-level, state-based season of games for under16-year-old male rugby league players. It forms one ofthe first stages of the elite-level pathway. The competition consists of 16 clubs from the NRL and Canterbury(NSW) Cup competitions. The Harold Matthews competition is played over 9 weeks, with the top five teamsqualifying for the post-season (i.e. a 3-week finals series).From a squad of 22 adolescent players, 21 (age range:15–16 years, mean 15.5 years, SD 0.5 years) including 13 forwards and 8 backs from one club participatedin the study, with one player declining to participate.Written consent was obtained by a legal parent orguardian for each participating player, and verbal assentwas obtained by each individual player. A rugby leagueteam consists of 13 players (6 forwards and 7 backs) on
Carey et al. Sports Medicine - Open(2021) 7:66the field at any one time with 4 interchange players. Onaverage, data were collected from 13 participants perweek (range: 9–15 players per week).The research protocol was approved by the Universityof Newcastle Human Research Ethics Committee. Thestudy was also endorsed by the participating club. Themethods for data collection were identical to our previous study on a semi-professional men’s rugby leagueteam [17].MeasuresImpact SensorsA total of 15 X-patchTM sensors (X2 Biosystems) wereavailable and deployed at the beginning of the season.Each sensor contains a low-power, high-g triaxial accelerometer, and gyroscope that measures linear and angular accelerations and decelerations to provide 6 degreesof freedom kinematic head impact data. All players’ sensors were attached to the skin covering the right mastoidprocess by an experienced member of the research team.Positioning of the sensor is crucial to ensure it is not activated by soft tissue muscles in the neck [26]. Each sensor was uniquely labelled and attached before the warmup using a double-sided adhesive patch. The X-patchTMis triggered when linear acceleration exceeds 10g and records data for 90 ms after the trigger and 10 ms beforethe trigger equalling one-tenth of a second of data (100ms) to its on-board memory. Once the sensor is removed, its stored data can be downloaded and analysedusing the Injury Management Software (IMS; X2 Biosystems). Each recorded event is “timestamped” and a set ofimpact measures are recorded, including PLA, peak rotational acceleration (PRA), peak rotational velocity (PRV),and head impact location. In our study, a Head Impact(HI 20g) was defined as an event recorded by the XpatchTM with a peak linear acceleration (PLA) 20g.Emphasis was placed on impacts 20g to avoid confusion with a large number of low-acceleration events, unlikely to result in deleterious neurophysiological change[17, 27]. Brennan et al [28] observed that the mean PLA associated with concussion was 99g. PLA was utilised in this asprevious research shows it has greater reliability and lessvariance than rotational measurements [20, 29]. To removelow-acceleration events commonly associated with normalgameplay (e.g. sharp changing of directions, jumping, running) all video-verified impacts were filtered to only includeHI 20g as suggested in previous studies [17, 27, 30].Sensors were collected from players after the game. Allrecorded impacts were reviewed and extracted fromIMS, displayed in the form of a Microsoft Excel spreadsheet, and sorted into individual player crosstabulations. Each sensor was then cleared of all impactsand charged in preparation for the following game.Page 3 of 13Video Review and Synchronising with Sensors’ Time StampEach game was recorded with a single high-definitioncamera by a trained videographer. The video closelyfollowed the play, including both the ball carrier and engaged defenders, and therefore captured competitionrelated collisions. The best possible vantage point wasobtained on the midline of the field with close-up shotspanning left and right to follow the play. Each game wasreviewed from start to finish using QuickTime X (AppleInc.) by one reviewer (LC). Video was synchronised withthe timestamps of each sensor before the verification review was conducted. The first head impact seen on videoreview was checked against the HI 20g after the gamestart time on the sensor’s timestamp, the same synchronisation method used previously on collegiate Lacrosse athletes by Kindschi and colleagues [31].Subsequent video-recorded impacts were then checkedagainst timestamps at corresponding intervals. To synchronise the timestamp from the X-patchTM with thevideo footage time, multiple impacts were reviewed onvideo and aligned to the sensor timestamp. Each potential video verified HI 20g (VV-HI 20g) was checkedmultiple times with both the timestamp and video to establish they were precisely synchronised before conducting the video verification process from start to finish ofgameplay.VV-HI 20g were also classified by the game event orsituation. Each VV-HI 20g was deemed to be a “HitUp” (attacking player carrying the ball), “Tackle”(defending player attempting to stop the ball carrier), or“Off-The-Ball” incident (contact without the ball). Triggered events 20g that did not correlate with a collisionon video review were documented. Similarly, collisionson video review that involved a player with a workingsensor attached and did not correspond to a triggeredevent were documented. For this study a “Direct VV-HI 20 g” was defined as a clearly observed physical headcontact that corresponded with a HI 20g, whereas an“Indirect VV-HI 20 g” was a clearly observed bodycontact, excluding the head, that corresponded with aHI 20g. VV-HI 20g were then sorted into a numberof sub-categories including the following: (i) direct (impact to head) vs. non-direct, (ii) number of tacklers involved (i.e. 1–4), (iii) point of impact on player withsensor (i.e. head, shoulder, chest, arm, waist and below),(iv) side of impact (i.e. right, left, front, back, top), (v)point of contact from opposition player (i.e. head, shoulder, chest, arm, waist and below), and (vi) wrestling impacts happening after first initial contact from tackle. Asecond reviewer (AG) then independently reviewed HI 20g during game time that were not verified on video.The process of double verification of these “false-positive” impacts helped clarify the accuracy of each ‘impact’included in the video verified data. Using the
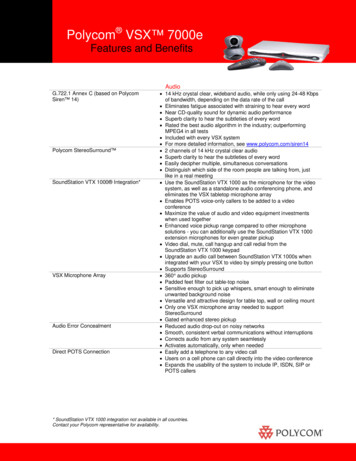
Carey et al. Sports Medicine - Open(2021) 7:66synchronised data set, the timestamps of non-verified HI 20g were double-checked with the correspondingvideo time. Video for approximately 20 s before andafter the HI 20g was reviewed with a focus on the relevant player. The results of this review process were thencoded into categories (e.g. “HI 20g not fully visualisedin the available footage”, or “HI 20g fully visualisedwith no contact identified”). All HI 20g cases that werenot verified as involving either a direct or indirect impact were excluded from the analyses. This double verification process was conducted independently by the tworeviewers.Statistical AnalysesDescriptive statistics for PLA and PRV of VV-HI 20gwere calculated and included frequencies, percentages,medians, and standard deviations. VV-HI 20g perplayer game hours rates were calculated for all playersand positions using the number of VV-HI 20g dividedby the number of game hours. The formula for calculating the impact rate is provided below.XImpact Rate ¼VV HI 20gXPlayer Game HoursPercentages of video verified and non-verified HI 20g were calculated to determine the validity of the XpatchTM and to remove any “false positives” from theanalysed data set. This was calculated as the number ofVV-HI 20g divided by the number of total recordedHI 20g during gameplay, multiplied by one hundred.The formula for calculating percentage of verified impacts is provided below.X%Video Verified Impacts ¼VV HI 20g 100XHI 20gLocation accuracy of direct and indirect VV-HI 20gwas analysed and the accuracy percentage was calculatedto show the agreement between the VV-HI 20g impactlocation (i.e. front, back, side, top) estimated from thesensor data in the IMS and video review. Location accuracy percentages were calculated as the number oftimes the sensor-based and the video-based location estimates were in agreement divided by the total numberof impacts per location on video review, multiplied byone hundred. The formula for location accuracy for VVHI 20g is provided below.LocationXAccuracy for VV HI 20g¼location agreement 100Page 4 of 13Xtotal video locationsVV-HI 20g data were reviewed for playing positions(i.e. forward versus back) and characteristics (i.e. attacking, defending, off-the-ball). An identical approach toour previous video verification study [17] for the analysisof this data was conducted. VV-HI 20g incidence ratesfor forwards and backs were compared using an exploratory t test. Exploratory Mann-Whitney U tests comparedimpact magnitude (i.e. PLA, PRV) between videoverified/non-verified HI 20g, direct/indirect VV-HI 20g, first/second half VV-HI 20g, and forward/backposition VV-HI 20g because these variables were notnormally distributed. All analyses were performed usingSPSS 23 (IBM Corp).ResultsGame Hours and Sensor RecordingA total of 79.4 player game hours (4762 min) was recorded, with backs accounting for 52.1% (2479 min) andforwards accounting for 47.9% (2283 min) of the hours.Throughout the season, the number of available andworking sensors was reduced to eleven due to deteriorating battery life (i.e. the sensor did not recharge), or thesensor was permanently lost during a game. The XpatchTM became detached 16 times throughout the season from eight different players (2 players once, 5players twice, and 1 player 4 times), for a total of 456min of lost data due to detached sensors for the season(backs: n 4, total 148 min, mean 37 min, median 33 min, SD 11.11, range 29–53; forwards: n 12,total 308, mean 25.7 min, median 28.5 min, SD 9.94, range 11–45). In addition, there was 121 min ofgame time lost due to 3 faulty sensors (all forwards).Sensor-Recorded ImpactsThere were 3835 triggered events recorded by the XpatchTM with PLA 10g (see Fig. 1). Triggered eventsthat could be interpreted as head impacts that occurredoutside of game time (i.e. in warm up, cool-down, duringapplication/removal of sensors) accounted for 1199 impacts (31.3%; 678 before game, 521 after game). Onvideo review, 34 triggered events were removed due tooccurring in the process of, or after, the sensor becoming detached in a tackle. A further 636 triggered eventswere removed due to two players placing the sensor intheir sock after it became dislodged leaving a total of1966 triggered events with PLA 10g during gameplay.From these triggered events, 1342 were 20g and therefore excluded which yielded a total of 624 triggeredevents 20g during gameplay (HI 20g).
Carey et al. Sports Medicine - Open(2021) 7:66Fig. 1 Flow diagram of sensor recorded impacts and video verificationPage 5 of 13
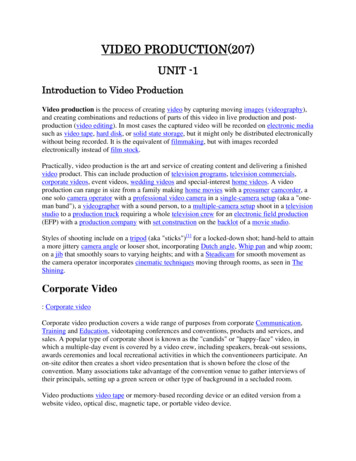
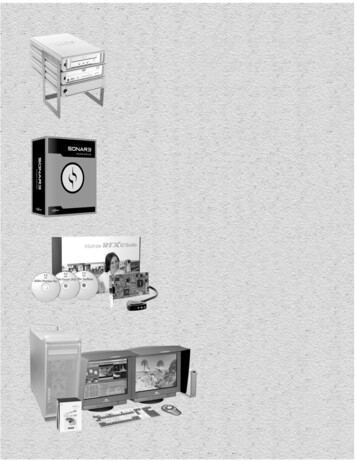
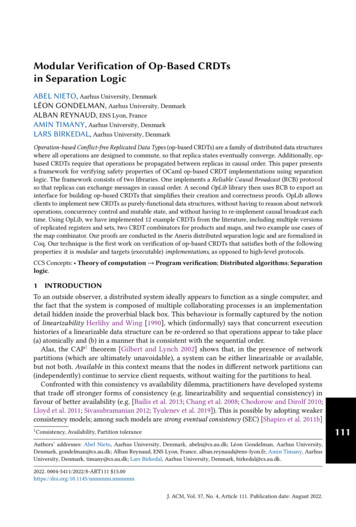
Carey et al. Sports Medicine - Open(2021) 7:66Page 6 of 13Fig. 2 Distribution of all X-patchTM triggered events and VV-HI 20g. The black bar denotes X-patchTM triggered events. The white bar withstripes denotes VV-HI 20gVideo Verification of Sensor-Recorded ImpactsOf the 624 HI 20g during gameplay, 564 (90.4%) wereverified on video. The distribution of all X-patchTM-triggered events and VV-HI 20g can be found in Fig. 2. From564 VV-HI 20g, 257 were as a result of a hit-up, 278 froma tackle, and 29 off-the-ball incidents. 413 (73.2%) wereidentified as direct head impacts and 151 (26.9%) as nondirect impacts occurring to either the shoulder, chest, arm,or waist. Of the 413 direct VV-HI 20g, the tackler (defender) recorded 204 (49.4%), the ball carrier (attacker) recorded 186 (45.0%), while 23 were recorded during off-theball incidents (5.6%; incidental contact n 4; melee/scuffleor fighting n 1; contact celebrating tries n 10; contactcelebrating penalty n 1; contact packing scrums n 5;clutching at own head after tackle n 2). Direct VV-HI 20g (as determined by video review) had a greater PLAcompared to indirect VV-HI 20g [direct n 413, mean 37.3, median 31.3, SD 17.5, range 20–113.3; indirect n 151, mean 25.5, median 24.0, SD 5.4, range 20–45.7; U 15,728.00, p .001; Cohen’s d 0.83] as well asgreater PRV compared to indirect VV-HI 20g [direct n 413, mean 29.9, median 28.5, SD 11.3, range 6.8-56.6;indirect n 151, mean 24.8, median 23.4, SD 8.7,range 6.2–54.9; U 23,162.00, p .001; d 0.48]. Figure 3provides a comparison of the peak linear acceleration andpeak rotational velocity between all direct and indirect VVHI 20g. The individual player data by position, playingtime, video-verified impacts, and VV-HI 20g per gamehour are provided in Table 1.Impacts Seen on Video and Not Recorded on the SensorsThere were 858 video observed impacts, including 28direct head impacts, that did not result in any triggeredevent from the X-patchTM, either because the sensorsdid not activate (despite other impacts being recordedon those sensors in close temporal proximity) or becausethe impact did not reach the 10g threshold (see Fig. 4).Sensor-Recorded Impacts Not Verified on VideoThere were 1199 triggered events that occurred beforeor after the game which were removed from the analysed data (Fig. 1). There were 506 triggered events registered as 20g that were not seen on video, and ofthose 185 occurred before the game (36.6%, presumablyduring warm up), 60 occurred during the game (11.9%),and 261 occurred after the game (51.6%). Individual impacts during the game, outside game time, and while thesensor was detached are illustrated in Fig. 5.A total of 60 HI 20g that occurred during game timewere not verified on video review. Of these, 33 HI 20gwere recorded when the player was on the bench, 15were not visualised (including 12 impacts while theplayer was not involved or was “behind” the play andthree impacts when the game was halted after theawarding of a penalty), one was partially visualised onvideo but was indeterminant, and 11 recorded impactshad complete visualisation but with no identified contact(including seven during a sharp change of direction fromthe player, three during change of speed while running,and one with no visible correlate). In all of these instances, there was clearly no contact from anotherplayer. Each of these HI 20g was verified by two reviewers to confirm them as “false-positive” impacts.There was no significant difference in the PLA of VV-HI 20g versus false-positive HI 20g [verified n 564,mean 34.1g, median 28.4g, SD 16.1, range 20.0–
Carey et al. Sports Medicine - Open(2021) 7:66Page 7 of 13Table 1 Cross-tabulation of frequency of verified in-game impacts 20g measured by the X-patchTMPlaying Playerposition timeingame(min)All X-patchTM-recorded impacts during game timeSensor-recorded Video verified Percentage ofin-game impacts game impacts impacts verified(%)Video verifiedimpacts per gamehourVideo verified Video verified directdirect impacts impacts per 91.8Player6Back39015151002.3101.5Forward 3022100412Player7Forward 259262596.25.8143.2Player8Forward 192393589.710.9226.9Player9Forward 204675683.616.54412.9Player10Forward 39837371005.6314.7Player11Forward 27225251005.5204.4Player12Forward orward 63108807.676.7Player14Forward 118241666.78.1136.6Player15Forward 91302686.717.12013.2Player16Forward orward 369888.913.335Player19Forward 72121191.79.297.5Player20Forward 56262180.822.51718.2Player21Back10000018021Forward 60Total4762X-patchTM-recorded direct impacts9888.987762456490.47.14135.2Note: Season totals. Players 6, 13, and 21 played in both forward and back positions during the season. Sensor-recorded impacts were 20gs
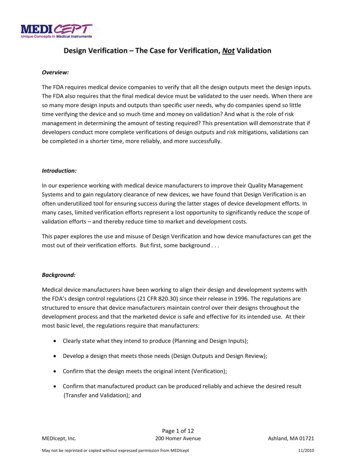
Carey et al. Sports Medicine - Open(2021) 7:66Page 8 of 13Fig. 3 Scatterplot of video verified direct and indirect impacts 20g recorded by the X-patch . The multiplication sign denotes Direct Impact.The black circle denotes Indirect Impact113.3g; non-verified n 60, mean 30.9g, median 26.1g, SD 13.3, range 20.0–76.6g; U 14,706.00, p .10; d 0.20] but a difference in PRV [verified mean 28.5rad/s, median 26.9rad/s, SD 10.9, range 6.2–56.6rad/s; non-verified mean 25.2rad/s, median 22.4rad/s, SD 13.0, range 6.3–55.4rad/s; U 13,727.00, p .02, d 0.30].Situational Characteristics of Video-Verified and SensorRecorded ImpactsOf the 413 direct VV-HI 20g, players sustained anaverage of 5.2 direct VV-HI 20g per hour of gameplay,with a slightly higher rate of direct VV-HI 20g duringthe second half of the game [first half 4.6 impacts/h, n 192; second half 5.8 impacts/h, n 221]. The magnitudeof these direct VV-HI 20g did not statistically differFig. 4 Flow diagram showing video verified impactsbetween the first and second half (PLA: U 20,211.00, p .41; PRV: U 21,088.00, p .92). Forwards had ahigher rate of direct VV-HI 20g than backs [forwardsM 8.08 impacts/h, SD 4.46; backs M 2.90 impacts/h, SD 1.60; t(22) 7.58 p .001, d 1.29]. However,the intensity of direct VV-HI 20g did not statisticallydiffer between forwards and backs (PLA: U 17,047.00,p .53; PRV: U 17,656.00, p .93).The most common event that caused a VV-HI 20gwas from a defender’s arm directly impacting the headof a ball carrier (n 120). This type of gameplayaccounted for 21.3% of all VV-HI 20g and 46.7% of allhit-up VV-HI 20g. The most common event associated with a VV-HI 20g for a tackler was an attacker’sarm (n 60) or waist (n 60) directly impacting thehead of the tackler. Each of these accounted for 10.6% ofall VV-HI 20g and 21.6% of tackler VV-HI 20g. Contact with the playing surface accounted for 44 VV-HI 20g (7.8%; hit-up n 32, tackle n 9, off-the-ball n 3).Of the 151 indirect VV-HI 20g, a ball carrier’s shoulder impacting with a defender’s shoulder (11.9%, n 18,3.2% of all impacts) or the defender’s chest impacting aball carrier’s shoulder (10.6%, n 16, 2.9% of all impacts) were the most common. A detailed overview ofall VV-HI 20g for a hit-up, tackle, and off-the-ballevents is provided in Table 2.
Carey et al. Sports Medicine - Open(2021) 7:66Page 9 of 13Fig 5 Scatterplot of all impacts 20g recorded by the X-patchTM. The multiplication sign denotes During Game. The black circle denotes OutsideGame. The white box denotes Sensor DetachedTable 2 Sensor-recorded and video-verified impact locations 20 gImpact from opposition (teammate)HeadPoint of alHead13 (4,7,2)64 (26,37,1)34 (12,22,0)199 (120,60,19)66 (5,60,1)26 (13,13,0)11 (6,5,0)413 (186,204,23)Shoulder0 (0,0,0)30 (11,18,1)29 (16,13,0)2 (2,0,0)13 (1,12,0)0 (0,0,0)10 (8,1,1)84 (38,44,2)Chest0 (0,0,0)26 (10,16,0)10 (2,8,0)5g (0,3,2)0 (0,0,0)0 (0,0,0)18 (14,2,2)59 (26,29,4)Arm0 (0,0,0)0 (0,0,0)0 (0,0,0)0 (0,0,0)0 (0,0,0)0 (0,0,0)1 (1,0,0)1 (1,0,0)Waist0 (0,0,0)3 (3,0,0)0 (0,0,0)0 (0,0,0)0 (0,0,0)0 (0,0,0)4 (3,1,0)7 (6,1,0)Total13 (4,7,2)123 (50,71,2)73 (30,43,0)206 (122,63,21)79 (6,72,1)26 (13,13,0)44 (32,9,3)564 (257,278,29)Note: Data in the parentheses are for a hit-up, tackle and off-the-ball incident, as follows: (hit-up, tackle, off-the-ball)a4 impacts from teammate’s head (3 tackle, 1 off-the-ball)b7 impacts from teammate’s shoulder (tackle), 1 impact from player’s own shoulder (hit-up)c6 impacts from teammate’s chest (6 tackle)d32 impacts from teammate’s arm (20 tackle, 12 off-the-ball), 2 impacts from player’s own arm (2 off-the-ball)e5 impacts from teammate’s waist (4 tackle, 1 off-the-ball)f2 impacts from teammate’s leg/knee (2 tackle)g1 impacts from teammate’s arm (off-the-ball)
Carey et al. Sports Medicine - Open(2021) 7:66Page 10 of 13Table 3 Video verified impacts: location accuracy of direct and indirect impacts 20gTotalXpatchTM(n)Direct direct deo(n)Agreement(n)Accuracy(%)Front 1516039.7Total 564Direction of Sensor-Recorded and Direct VV-HI 20 gWhen looking at the location of all direct VV-HI 20g(n 413) via the IMS, most occurred to the front (n 198; 47.9%), followed by the side (n 111; 26.9%), back(n 83; 20.1%), and top (n 21; 5.1%) of the head.When examining the location via video review, we foundmost direct VV-HI 20g occurred to the side (n 357,86.4%) with fewer to the front (n 14, 3.4%), back (n 34, 8.2%), and top (n 8, 1.9%) of the head. The locationof direct VV-HI 20g corresponded in only 24.9% ofcases with the video review [42.9% (n 6) to the front ofthe head, 25.2% (n 90) to the side, 17.6% (n 6) to theback, and 12.5% (n 1) to the top]. The sensor-derivedimpact location was poorly correlated with side-on direct head impacts visualised on video, and as such overestimated VV-HI 20g in all other directions, particularlyfront-on impacts. A detailed description of the locationaccuracy for direct and indirect VV-HI 20g is providedin Table 3.Tackles and Secondary ImpactsSecondary impacts during a tackle (i.e. impacts after theinitial contact in the same tackle event) accounted for46.1% (n 260) of total VV-HI 20g and 53.5% (n 221) of all direct VV-HI 20g. For 260 secondary impacts, 16.2% (n 42) were accompanied by a VV-HI 20g. There were 456 tackles that resulted in the 535 VVHI 20g, excluding impacts that occurred “off the ball.”For 388 tackles there was one impact recorded,
impacts. Direct head impacts 20g occurred at a rate of 5.2 impacts per game hour; 7.6 for forwards and 3.0 for backs (range 0-18.2). A defender's arm directly impacting the head of the ball carrier was the most common event, accounting for 21.3% (n 120) of all impacts, and 46.7% of all "hit-up" impacts. There were no medically