Transcription
29:50 Astronomy Lab #5Stars, Galaxies, and the UniverseNamePartner(s)DateGradeCategoryMax PointsOn Time5Printed Copy5Lab Work90Total100Points ReceivedImage Analysis: Basic Techniques1. IntroductionA number of basic concepts of image analysis are introduced, including ADUcount, histogram adjustment, angular distance measurement, convolution, and imagearithmetic.Background and TheoryObtaining useful scientific results from an image often requires the application ofimage analysis tools. Many of the most commonly used tools are illustrated in thisexercise using one terrestrial image and two astronomical images. The following isintended only as a brief summary of the basic concepts. A CCD image consists of arectangular array of cells called pixels, each of which is assigned a number (theANALOGUE TO DIGITAL UNIT or ADU COUNT) which is proportional to thebrightness of the image at that location. For the images in this exercise, the range ofADU values is 0 to 65536 or 216; i.e., there are 16 bits assigned to hold the value ofeach pixel. A single image is inherently monochromatic (ʻblack and whiteʼ) so that thedisplay program normally converts the ADU counts to shades of gray, a so-calledʻgrayscaleʼ image. Since most computer video systems can only display 8 bits ofgrayscale (256 shades), it is necessary to select the minimum and maximum ADUcounts corresponding to the black and white levels, respectively. This can be done1
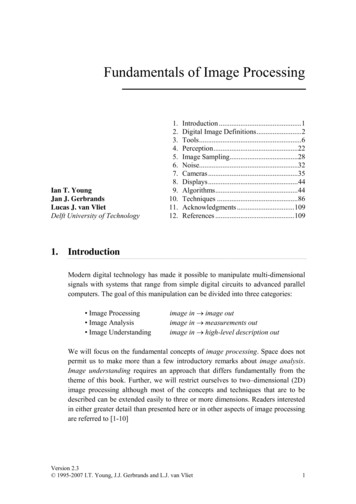
Image Analysiseither by adjusting the contrast/brightness control or by using the HISTOGRAM TOOL.The histogram is a plot of the number of pixels at each ADU level. The user adjusts theminimum and maximum level using the mouse and the arrows at the bottom of thehistogram. The x and y coordinates of individual pixels can be read directly by movingaround the image with the mouse. One can display multiple images at the same time,and rotate, expand and contract selected images. Images may also be added,subtracted, multiplied, and divided by either constants or other images.The grayscale representation of an image can be converted to a PSEUDOCOLOR IMAGE by changing the COLOR PALETTE, i.e. the mapping of ADU levels toa sequence of colors. These are not true colors in the sense that of a color photograph,but it is sometimes useful to choose a color palette to emphasize small intensitydifferences, particularly in extended objects such as nebulae. The lab uses threesample images to illustrate some of these image analysis tools. The images of M42 andM57 were taken with the RIGEL TELESCOPE in Arizona, while the Chapel image wastaken with a regular digital camera. CHAPEL.FTS is an image of the Danforth Chapelnear the Iowa Memorial Union. M42.FTS is an image of the well known star formationregion M42 (The Great Orion Nebula) in the sword of Orion. It is about 400 pc distant.The total mass of the nebula is about 106 solar masses. The central part of the nebulacontaining the 4 Trapezium stars is overexposed and cannot be seen clearly. M57.FTSis an image of the Ring Nebula, a famous example of a planetary nebula (the reasonthe name planetary nebula was coined is probably because these objects are similar inappearance to faint planets when viewed with modest-sized telescopes -- both look likefuzzy disks). The object consists of a central hot star and a surrounding cloud of gas.The gas is glowing because of ionization from ultraviolet radiation from the central star.The Ring Nebula, shown in Figure 1, is one of the brightest of all planetaries, butimaging it with small telescopes is difficult, since it is quite small and the central star isvery faint (V 15). The distance to the Ring Nebula is about 700 pc.2. Procedure1.2.3.Run MaxIm.Load the image CHAPEL.FTS (located in directory misc). To do this, click onFile in the menu bar at the top of the screen. Then choose Open from the pulldown menu. Choose the image drive from using the box next to the words“Look in”. Ask your instructor if you canʼt remember which drive contains thelaboratory images. Open the misc folder. Now double-click on the file namechapel.fts.The image you are seeing is composed of individual pixels arranged in arectangle, with dimensions 800 600 or 480000 pixels altogether. The imagedisplay program reads each ADU value and converts it into a gray level, withlarger values being more nearly white and smaller values more nearly black.The position and ADU count of the individual pixel under the cursor can beread at the bottom of the screen. The ADU count (the i:) is given next to theset of (x,y) coordinates at the bottom right corner of the screen. Notice that the2
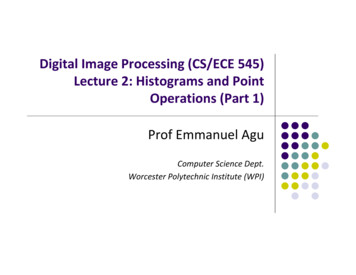
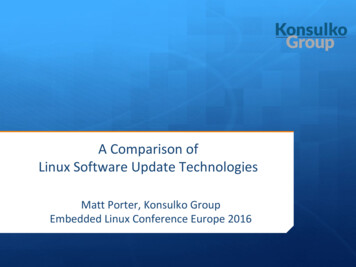
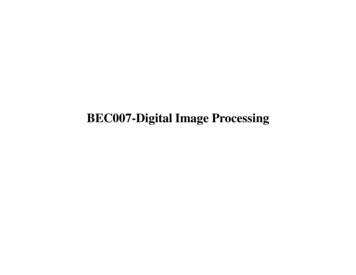
Image Analysis4.5.6.7.counts in adjacent pixels are often different from one another, even if thepixels look equally bright. Because of the nature of photons; the change in thenumber of photons has to be fairly large before a brightness change isobvious. Can you tell the difference between pixels with high ADU counts andthose with low ADU counts?It is sometimes convenient to adjustthe image display gray levels inorder to enhance faint features in theimage. This is known as adjustingthe histogram. To do this, use theSCREEN STRETCH WINDOW(shown at right) which should havebeen displayed upon starting theprogram. If not, select View from themenu and Screen Stretch Windowfrom the pull-down menu. To adjust the display, move the green and redarrows under the main window. The red arrow adjusts the black backgroundand the green adjusts white levels. Moving the arrows close together producesa high contrast. The histogram is adjusted automatically as you move thearrows. Continue to adjust the histogram until you find a setting that brings outa maximum amount of detail. As you adjust the histogram, you are adjustingthe 256 shades of gray scale to cover the desired range of brightness withinthe image. Including the entire range of brightness within the 256 gray-scalelevels can sometimes make it difficult to detect fine differences. Including asmall range of brightness hides a lot of information off of the edges of thescale.You may also adjust the contrast and brightness of the image by clicking in thesmaller window on the right side of the Screen Stretch. When you click andhold in the window, your cursor will change to a cross. Moving your cursorvertically will adjust the brightness and moving horizontally will adjust thecontrast. Note that the green and red arrows will also move as you move yourmouse in this small window. As before, the adjustments will occurautomatically. Continue to adjust the histogram until you feel you have themost detail possible. Adjusting the histogram optimally takes a lot of practice.Donʼt be frustrated if you spend fifteen minutes doing what your lab instructordoes with just a few clicks.To examine the image more closely, especially the variation in pixelintensity (ADU count), select the Zoom from the menu, it will start outreading 100%. You may also press the and – buttons next to the zoom pulldown. Select a reasonable zoom level for examining the image. This level willchange from image to image. For the chapel image, you will need to select azoom of at least 400%, perhaps larger.While the original image is reasonably clear, we can highlight small scalefeatures using a CONVOLUTION MASK. (The process of convolving animage involves manipulating its ADU counts according to some predeterminedmathematical function. You can think of convolving an image as applying one3
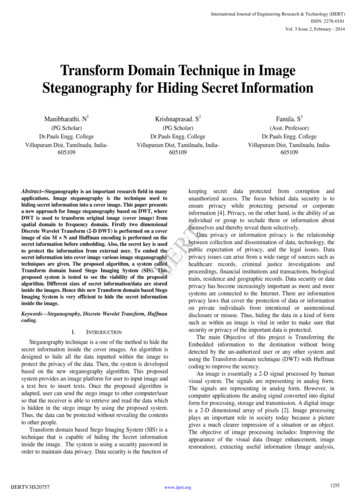
Image Analysis8.of several special filters to it.) Click on Filter and choose Unsharp Mask. Anew window will open. Donʼt worry about any of the options; just use thedefault values for now. Click OK and you should be able to see more detail inthe vehicles in the background.Measure the height of the building in pixels by putting the cursor at the bottomof the building, and mark down the coordinates (x,y) shown. Keeping the xvalue constant, move the cursor to the top of the building and record thenumber. Subtract the first y value from the second to get the height of thebuilding on the image in pixels. Calculate the actual height of the building inboth feet and meters using an image scale of .17 feet/pixel and .05 meters/pixel, respectively.HEIGHT OF THE CHAPELWorkspace(feet)9.10.11.(meters)Discard the chapel image by clicking on the small in the upper right corner ofthe image window.Load the image M42.FTS by clicking on File/Open. Click on m42.fts in theimage list box, and click on Open.Adjust the histogram. Faint nebulaecan often be seen better byproducing a negative image. Try thisby reversing the positions of the redand green arrows. That is, put thered arrow to the right of the greenarrow. Readjust the histogram.Astronomers are often interested inthe order of magnitude of acalculation. That is, do we expect tosee millions of stars in a region, or just a few? As an example, we canestimate the number of solar-mass size stars that may be formed from theglowing gas of M42. To do this, you must first find the radius of M42. Move thecursor over a point near the center of the nebula. Mark down the coordinates(x,y) shown. Next move the cursor to a point on the edge of the nebula andmark those coordinates down. From these sets of coordinates, you can findthe radius (in pixels) using the distance formula:4
Image AnalysisWhere r is the radius and the xʼs and yʼs are the coordinates you measured.12.13.14.Take at least 2 more measurements of radius and then take the averageof them to get your radius (in pixels). Convert this into arcseconds usingthe scale of 3 arcseconds per pixel.We can determine the linear size of the object from the angular size and thedistance, using the small angle equation: (Angular size θ) 206, 265 x(linear size D)/(distance d), where d and D are in the same units, and θ is inarcseconds. The distance from the Earth to M42 is approximately 400 pc.Find the linear size of M42 in pc. Convert this result to meters. (1 pc 3 1016 m)Spectral lines indicate that the cloud is made mostly of hydrogen, and thatthere are roughly 1010 atoms per cubic meter (n 1010 m-3). Since we knowthe mass of hydrogen, the mass density, ρ, of the nebula can be obtained by(ρ is the Greek letter rho, pronounced “row”):ρ n mH 1010 1.6 10-27 1.6 10-17 kg/m315.Multiplying the density by the volume yields the total mass of hydrogen in thenebula. If we assume that the nebula is approximately spherical, the mass canbe calculated using the following formula (where r is the linear size, actuallythe radius, from step 13):M ρ V ρ(4/3)πr316.How many solar mass stars can be created by the gas in M42 if it all collapsesto form solar mass stars?5
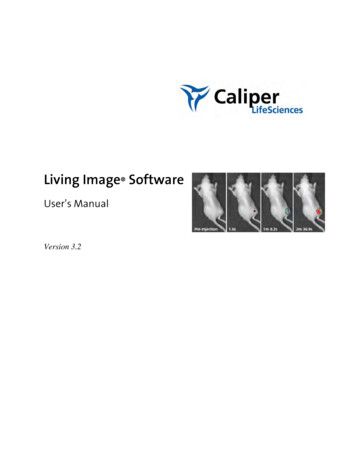
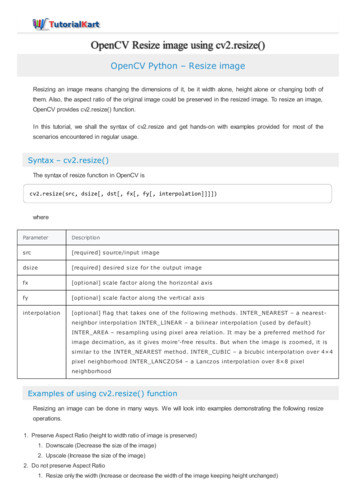
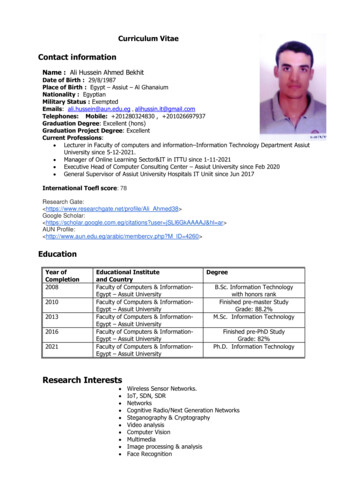
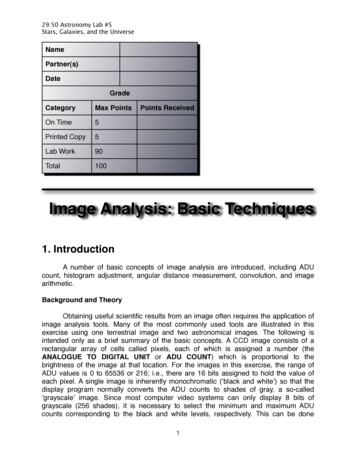
Image AnalysisMEASUREMENTS OF THE ORION NEBULA (M42)Average RadiusMeasurement 1(pixels)Measurement 2(pixels)Measurement ss of Nebula17.18.(kg)Number of Solar MassStarsDiscard M42.fts and load M57.FTS.Adjust the histogram so that the ringis not so glaringly bright – use yourbest judgment to determine when thering shows the most detail.Notice the star at the center of thenebula. (There is another star insidethe ring, offset from the center. Thisis a foreground star and has nothingto do with the nebula.) This is thestar which is shedding its outer6IMAGE 4 - HST IMAGE OF THE RING NEBULA (M57)
Image Analysisatmosphere to produce the nebula. Measure the distance from the center starto the ringʼs edge at three different locations. You may have noticed that thelength you measured is neither the longest nor the shortest radius of M57, butis rather an average radius. Find the radius of the nebula (in pixels) bytaking the average of your three measurements. Convert this radius toarcseconds using the image scale of 0.5 arcseconds per pixel.19.Find the radius of M57 in a.u. (Hint: the distance to M57 is 700 parsec)20.If the sun were to produce a nebula of the same size as M57, would the Earthbe inside or outside of it?21.Convert the radius of M57 from a.u. to km.7
Image Analysis22.The average expansion speed of the gas in the nebula is 20 km/s. If it isassumed that the nebula has been expanding at this speed for its entirelifetime (not a very sound assumption, but it is OK as a rough estimate), it isfairly simple to estimate the nebulaʼs age, since r v . t , where r is thedistance traveled, v is the velocity, and t is the time. The gas from the nebulabegan expanding from the star at the center of the nebula. Use this to estimatethe nebulaʼs age in seconds and convert the answer to years. For a solar typestar, is the planetary nebula phase a small or large fraction of its lifetime?MEASUREMENTS OF THE RING NEBULA (M57)Average RadiusMeasurement 1(pixels)Measurement 2(pixels)Measurement 3(pixels)Average(pixels)(arcsec)(AU)(km)8
Image AnalysisWorkspacePosition of Earth(inside oroutside)Age of NebulaFraction of Star’sLife (small or large)9
the 256 shades of gray scale to cover the desired range of brightness within the image. Including the entire range of brightness within the 256 gray-scale levels can sometimes make it difficult to detect fine differences. Including a small range of brightness hides a lot of information off of the edges of the scale. 5.