Transcription
HANDBOOK OFBIOLOGICALSTATISTICSS E C O N DE D I T I O NJOHN H. MCDONALDUniversity of DelawareSPARKY HOUSE PUBLISHINGBaltimore, Maryland, U.S.A.
2009 by John H. McDonaldNon-commercial reproduction of this content, with attribution, is permitted; forprofit reproduction without permission is prohibited.See http://udel.edu/ mcdonald/statpermissions.html for details.
ContentsContentsBasicsIntroduction . 1Data analysis steps. 4Kinds of biological variables . 7Probability. 13Hypothesis testing . 15Random sampling. 21Tests for nominal variablesExact binomial test . 24Power analysis. 33Chi-square test of goodness-of-fit. 39G-test of goodness-of-fit. 46Randomization test of goodness-of-fit. 52Chi-square test of independence . 57G-test of independence. 64Fisher's exact test. 70Randomization test of independence. 76Small numbers in chi-square and G-tests. 80Repeated G-tests of goodness-of-fit . 84Cochran-Mantel-Haenszel test. 88Descriptive statisticsCentral tendency . 95Dispersion . 102Standard error . 107Confidence limits . 112Tests for one measurement variableStudent's t-test . 118Introduction to one-way anova. 123i
Handbook of Biological StatisticsModel I vs. Model II anova. 127Testing homogeneity of means . 130Planned comparisons among means. 137Unplanned comparisons among means . 141Estimating added variance components . 146Normality . 150Homoscedasticity. 155Data transformations . 160Kruskal-Wallis test. 165Nested anova . 173Two-way anova. 182Paired t-test . 191Wilcoxon signed-rank test . 198Sign test . 202Tests for multiple measurement variablesLinear regression and correlation. 207Spearman rank correlation . 221Polynomial regression. 224Analysis of covariance. 232Multiple regression . 239Logistic regression . 247Multiple testsMultiple comparisons. 256Meta-analysis . 260MiscellanyUsing spreadsheets for statistics . 266Displaying results in graphs: Excel . 274Displaying results in graphs: Calc. 287Displaying results in tables . 297Introduction to SAS . 300Choosing the right test . 308ii
IntroductionIntroductionWelcome to the Handbook of Biological Statistics! This online textbook evolvedfrom a set of notes for my Biological Data Analysis class at the University ofDelaware. My main goal in that class is to teach biology students how to choosethe appropriate statistical test for a particular experiment, then apply that test andinterpret the results. I spend relatively little time on the mathematical basis of thetests; for most biologists, statistics is just a useful tool, like a microscope, andknowing the detailed mathematical basis of a statistical test is as unimportant tomost biologists as knowing which kinds of glass were used to make a microscopelens. Biologists in very statistics-intensive fields, such as ecology, epidemiology,and systematics, may find this handbook to be a bit superficial for their needs, justas a microscopist using the latest techniques in 4-D, 3-photon confocal microscopyneeds to know more about their microscope than someone who's just counting thehairs on a fly's back.You may navigate through these pages using the "Previous topic" and "Nexttopic" links at the top of each page, or you may skip from topic to topic using thelinks on the left sidebar. Let me know if you find a broken link anywhere on thesepages.I have provided a spreadsheet to perform almost every statistical test. Eachcomes with sample data already entered; just download the program, replace thesample data with your data, and you'll have your answer. The spreadsheets werewritten for Excel, but they should also work using the free program Calc, part ofthe OpenOffice.org (http://www.openoffice.org/) suite of programs. If you'reusing OpenOffice.org, some of the graphs may need re-formatting, and you mayneed to re-set the number of decimal places for some numbers. Let me know if youhave a problem using one of the spreadsheets, and I'll try to fix it.I've also linked to a web page for each test wherever possible. I found most ofthese web pages using John Pezzullo's excellent list of Interactive StatisticalCalculation Pages (http://StatPages.org) , which is a good place to look forinformation about tests that are not discussed in this handbook.There are instructions for performing each statistical test in SAS, as well. It's notas easy to use as the spreadsheets or web pages, but if you're going to be doing alot of advanced statistics, you're going to have to learn SAS or a similar programsooner or later.1
Handbook of Biological StatisticsPrinted versionWhile this handbook is primarily designed for online use, you may find itconvenient to print out some or all of the pages. If you print a page, the sidebar onthe left, the banner, and the decorative pictures (cute critters, etc.) should not print.I'm not sure how well printing will work with various browsers and operatingsystems, so if the pages don't print properly, please let me know.If you want a spiral-bound, printed copy of the whole handbook (313 pages),you can buy one from Lulu.com (http://www.lulu.com/content/3862228) for 16plus shipping. I've used this print-on-demand service as a convenience to you, notas a money-making scheme, so don't feel obligated to buy one. You can alsodownload a pdf of the entire handbook from that link and print it yourself. Thepdf has page numbers and a table of contents, so it may be a little easier to usethan individually printed web pages.You may cite the printed version as:McDonald, J.H. 2009. Handbook of Biological Statistics, 2nd ed. Sparky HousePublishing, Baltimore, Maryland.It's better to cite the print version, rather than the web pages, because I plan toextensively revise the web pages once a year or so. I'll keep the free pdf of the printversion of each major revision as a separate edition on Lulu.com(http://www.lulu.com/content/386228) , so people can go back and see what youwere citing at the time you wrote your paper. The page numbers of each section inthe print version are given at the bottom of each web page.I am constantly trying to improve this textbook. If you find errors or havesuggestions for improvement, please e-mail me at mcdonald@udel.edu. If youhave statistical questions about your research, I'll be glad to try to answer them.However, I must warn you that I'm not an expert in statistics, so if you're askingabout something that goes far beyond what's in this textbook, I may not be able tohelp you. And please don't ask me for help with your statistics homework (unlessyou're in my class, of course!).Further readingThere are lots of statistics textbooks, but most are too elementary to use as aserious reference, too math-obsessed, or not biological enough. The two books Iuse the most, and see cited most often in the biological literature, are Sokal andRohlf (1995) and Zar (1999). They cover most of the same topics, at a similar level,and either would serve you well when you want more detail than I provide in thishandbook. I've provided references to the appropriate pages in both books onmost of these web pages.2
IntroductionThere are a number of online statistics manuals linked at StatPages.org. Ifyou're interested in business statistics, time-series analysis, or other topics that Idon't cover here, that's an excellent place to start. Wikipedia has some good articleson statistical topics, while others are either short and sketchy, or overly technical.Sokal, R.R., and F.J. Rohlf. 1995. Biometry: The principles and practice of statisticsin biological research. 3rd edition. W.H. Freeman, New York.Zar, J.H. 1999. Biostatistical analysis. 4th edition. Prentice Hall, Upper SaddleRiver, NJ.AcknowledgmentPreparation of this handbook has beensupported in part by a grant to the University ofDelaware from the Howard Hughes MedicalInstitute Undergraduate Science EducationProgram.Thanks!3
Handbook of Biological StatisticsStep-by-step analysis ofbiological dataI find that a systematic, step-by-step approach is the best way to analyzebiological data. The statistical analysis of a biological experiment may be brokendown into the following steps:1. Specify the biological question to be answered.2. Put the question in the form of a biological null hypothesis and alternatehypothesis.3. Put the question in the form of a statistical null hypothesis and alternatehypothesis.4. Determine which variables are relevant to the question.5. Determine what kind of variable each one is.6. Design an experiment that controls or randomizes the confoundingvariables.7. Based on the number of variables, the kind of variables, the expected fit tothe parametric assumptions, and the hypothesis to be tested, choose thebest statistical test to use.8. If possible, do a power analysis to determine a good sample size for theexperiment.9. Do the experiment.10. Examine the data to see if it meets the assumptions of the statistical testyou chose (normality, homoscedasticity, etc.). If it doesn't, choose a moreappropriate test.11. Apply the chosen statistical test, and interpret the result.12. Communicate your results effectively, usually with a graph or table.Here's an example of how this works. Verrelli and Eanes (2001) measuredglycogen content in Drosophila melanogaster individuals. The flies werepolymorphic at the genetic locus that codes for the enzyme phosphoglucomutase(PGM). At site 52 in the PGM protein sequence, flies had either a valine or analanine. At site 484, they had either a valine or a leucine. All four combinations ofamino acids (V-V, V-L, A-V, A-L) were present.4
Step-by-step analysis of biological data1. One biological question is "Do the amino acid polymorphisms at the Pgmlocus have an effect on glycogen content?" The biological question isusually something about biological processes, usually in the form "Does Xcause Y?"2. The biological null hypothesis is "Different amino acid sequences do notaffect the biochemical properties of PGM, so glycogen content is notaffected by PGM sequence." The biological alternative hypothesis is"Different amino acid sequences do affect the biochemical properties ofPGM, so glycogen content is affected by PGM sequence."3. The statistical null hypothesis is "Flies with different sequences of the PGMenzyme have the same average glycogen content." The alternate hypothesisis "Flies with different sequences of PGM have different average glycogencontents." While the biological null and alternative hypotheses are aboutbiological processes, the statistical null and alternative hypotheses are allabout the numbers; in this case, the glycogen contents are either the sameor different.4. The two relevant variables are glycogen content and PGM sequence.5. Glycogen content is a measurement variable, something that is recorded asa number that could have many possible values. The sequence of PGM thata fly has (V-V, V-L, A-V or A-L) is a nominal variable, something with asmall number of possible values (four, in this case) that is usually recordedas a word.6. Other variables that might be important, such as age and where in a vialthe fly pupated, were either controlled (flies of all the same age were used)or randomized (flies were taken randomly from the vials without regard towhere they pupated).7. Because the goal is to compare the means of one measurement variableamong groups classified by one nominal variable, and there are more thantwo classes, the appropriate statistical test is a Model I one-way anova.8. A power analysis would have required an estimate of the standarddeviation of glycogen content, which probably could have been found inthe published literature, and a number for the effect size (the variation inglycogen content among genotypes that the experimenters wanted todetect). In this experiment, any difference in glycogen content amonggenotypes would be interesting, so the experimenters just used as manyflies as was practical in the time available.9. The experiment was done: glycogen content was measured in flies withdifferent PGM sequences.10. The anova assumes that the measurement variable, glycogen content, isnormal (the distribution fits the bell-shaped normal curve) andhomoscedastic (the variances in glycogen content of the different PGMsequences are equal), and inspecting histograms of the data shows that the5
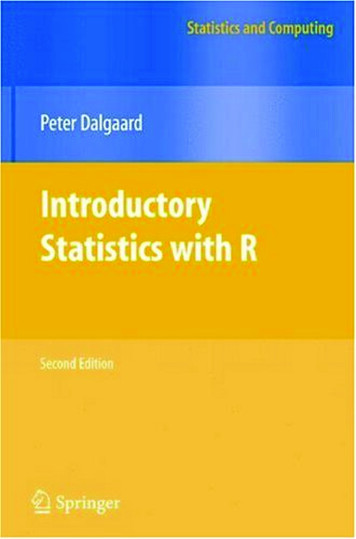
Handbook of Biological Statisticsdata fit these assumptions. If the data hadn't met the assumptions of anova,the Kruskal–Wallis test or Welch's test might have been better.11. The one-way anova was done, using a spreadsheet, web page, or computerprogram, and the result of the anova is a P-value less than 0.05. Theinterpretation is that flies with some PGM sequences have differentaverage glycogen content than flies with other sequences of PGM.12. The results could be summarized in a table, but a more effective way tocommunicate them is with a graph:Glycogen content in Drosophila melanogaster. Each bar representsthe mean glycogen content (in micrograms per fly) of 12 flieswith the indicated PGM haplotype. Narrow bars represent /-2standard errors of the mean.ReferenceVerrelli, B.C., and W.F. Eanes. 2001. The functional impact of PGM amino acidpolymorphism on glycogen content in Drosophila melanogaster. Genetics 159:201-210. (Note that for the purposes of this handbook, I've used a differentstatistical test than Verrelli and Eanes did. They were interested in interactionsamong the individual amino acid polymorphisms, so they used a two-wayanova.)6
Types of variablesTypes of variablesOne of the first steps in deciding which statistical test to use is determiningwhat kinds of variables you have. When you know what the relevant variables are,what kind of variables they are, and what your null and alternative hypothesesare, it's usually pretty easy to figure out which test you should use. For ourpurposes, it's important to classify variables into three types: measurementvariables, nominal variables, and ranked variables.Similar experiments, with similar null and alternative hypotheses, will beanalyzed completely differently depending on which of these three variable typesare involved. For example, let's say you've measured variable X in a sample of 56male and 67 female isopods (Armadillidium vulgare, commonly known as pillbugsor roly-polies), and your null hypothesis is "Male and female A. vulgare have thesame values of variable X." If variable X is width of the head in millimeters, it's ameasurement variable, and you'd analyze it with a t-test or a Model I one-wayanalysis of variance (anova). If variable X is a genotype (such as AA, Aa, or aa), it'sa nominal variable, and you'd compare the genotype frequencies with a Fisher'sexact test, chi-square test or G-test of independence. If you shake the isopods untilthey roll up into little balls, then record which is the first isopod to unroll, thesecond to unroll, etc., it's a ranked variable and you'd analyze it with aKruskal–Wallis test.Measurement variablesMeasurement variables are, as the name implies, things you can measure. Anindividual observation of a measurement variable is always a number. Examplesinclude length, weight, pH, and bone density.The mathematical theories underlying statistical tests involving measurementvariables assume that they could have an infinite number of possible values. Inpractice, the number of possible values of a measurement variable is limited by theprecision of the measuring device. For example, if you measure isopod headwidths using an ocular micrometer that has a precision of 0.01 mm, the possiblevalues for adult isopods whose heads range from 3 to 5 mm wide would be 3.00,3.01, 3.02, 3.03. 5.00 mm, or only 201 different values. As long as there are a largenumber of possible values of the variable, it doesn't matter that there aren't really7
Handbook of Biological Statisticsan infinite number. However, if the number of possible values of a variable issmall, this violation of the assumption could be important. For example, if youmeasured isopod heads using a ruler with a precision of 1 mm, the possible valuescould be 3, 4 or 5 mm, and it might not be a good idea to use the statistical testsdesigned for continuous measurement variables on this data set.Variables that require counting a number of objects, such as the number ofbacteria colonies on a plate or the number of vertebrae on an eel, are known asmeristic variables. They are considered measurement variables and are analyzedwith the same statistics as continuous measurement variables. Be careful, however;when you count something, it is sometimes a nominal variable. For example, thenumber of bacteria colonies on a plate is a measurement variable; you count thenumber of colonies, and there are 87 colonies on one plate, 92 on another plate, etc.Each plate would have one data point, the number of colonies; that's a number, soit's a measurement variable. However, if the plate has red and white bacteriacolonies and you count the number of each, it is a nominal variable. Each colony isa separate data point with one of two values of the variable, "red" or "white";because that's a word, not a number, it's a nominal variable. In this case, you mightsummarize the nominal data with a number (the percentage of colonies that arered), but the underlying data are still nominal.Something that could be measured is a measurement variable, even when thevalues are controlled by the experimenter. For example, if you grow bacteria onone plate with medium containing 10 mM mannose, another plate with 20 mMmannose, etc. up to 100 mM mannose, the different mannose concentrations are ameasurement variable, even though you made the media and set the mannoseconcentration yourself.Nominal variablesThese variables, also called "attribute variables" or "categorical variables,"classify observations into a small number of categories. A good rule of thumb isthat an individual observation of a nominal variable is usually a word, not anumber. Examples of nominal variables include sex (the possible values are maleor female), genotype (values are AA, Aa, or aa), or ankle condition (values arenormal, sprained, torn ligament, or broken). Nominal variables are often used todivide individuals up into classes, so that other variables may be compared amongthe classes. In the comparison of head width in male vs. female isopods, theisopods are classified by sex, a nominal variable, and the measurement variablehead width is compared between the sexes.Nominal variables are often summarized as proportions or percentages. Forexample, if I count the number of male and female A. vulgare in a sample fromNewark and a sample from Baltimore, I might say that 52.3 percent of the isopodsin Newark and 62.1 percent of the isopods in Baltimore are female. Thesepercentages may look like a measurement variable, but they really represent a8
Types of variablesnominal variable, sex. I determined the value of the nominal variable (male orfemale) on 65 isopods from Newark, of which 34 were female and 31 were male. Imight plot 52.3 percent on a graph as a simple way of summarizing the data, but Iwould use the 34 female and 31 male numbers in all statistical tests.It may help to understand the difference between measurement and nominalvariables if you imagine recording each observation in a lab notebook. If you aremeasuring head widths of isopods, an individual observation might be "3.41 mm."That is clearly a measurement variable. An individual observation of sex might be"female," which clearly is a nominal variable. Even if you don't record the sex ofeach isopod individually, but just counted the number of males and females andwrote those two numbers down, the underlying variable is a series of observationsof "male" and "female."It is possible to convert a measurement variable to a nominal variable, dividingindividuals up into a small number of classes based on ranges of the variable. Forexample, if you are studying levels of HDL (the "good cholesterol") and bloodpressure, you could measure the HDL level, then divide people into two groups,"low HDL" (less than 40 mg/dl) and "normal HDL" (40 or more mg/dl) andcompare the mean blood pressures of the two groups, using a nice simple t-test.Converting measurement variables to nominal variables ("categorizing") iscommon in epidemiology and some other fields. It is a way of avoiding somestatistical problems when constructing complicated regression models involvinglots of variables. I think it's better for most biological experiments if you don't dothis. One problem with categorizing measurement variables is that you'd bediscarding a lot of information; in our example, you'd be lumping togethereveryone with HDL from 0 to 39 mg/dl into one group, which could decrease yourchances of finding a relationship between the two variables if there really is one.Another problem is that it would be easy to consciously or subconsciously choosethe dividing line between low and normal HDL that gave an "interesting" result.For example, if you did the experiment thinking that low HDL caused high bloodpressure, and a couple of people with HDL between 40 and 45 happened to havehigh blood pressure, you might put the dividing line between low and normal at45 mg/dl. This would be cheating, because it would increase the chance of gettinga "significant" difference if there really isn't one. If you are going to categorizevariables, you should decide on the categories by some objective means; either usecategories that other people have used previously, or have some predeterminedrule such as dividing the observations into equally-sized groups.Ranked variablesRanked variables, also called ordinal variables, are those for which theindividual observations can be put in order from smallest to largest, even thoughthe exact values are unknown. If you shake a bunch of A. vulgare up, they roll intoballs, then after a little while start to unroll and walk around. If you wanted to9
Handbook of Biological Statisticsknow whether males and females unrolled at the same average time, you couldpick up the first isopod to unroll and put it in a vial marked "first," pick up thesecond to unroll and put it in a vial marked "second," and so on, then sex theisopods after they've all unrolled. You wouldn't have the exact time that eachisopod stayed rolled up (that would be a measurement variable), but you wouldhave the isopods in order from first to unroll to last to unroll, which is a rankedvariable. While a nominal variable is recorded as a word (such as "male") and ameasurement variable is recorded as a number (such as "4.53"), a ranked variablecan be recorded as a rank (such as "seventh").You could do a lifetime of biology and never use a true ranked variable. Thereason they're important is that the statistical tests designed for ranked variables(called "non-parametric tests," for reasons you'll learn later) make fewerassumptions about the data than the statistical tests designed for measurementvariables. Thus the most common use of ranked variables involves converting ameasurement variable to ranks, then analyzing it using a non-parametric test. Forexample, let's say you recorded the time that each isopod stayed rolled up, andthat most of them unrolled after one or two minutes. Two isopods, who happenedto be male, stayed rolled up for 30 minutes. If you analyzed the data using a testdesigned for a measurement variable, those two sleepy isopods would cause theaverage time for males to be much greater than for females, and the differencemight look statistically significant. When converted to ranks and analyzed using anon-parametric test, the last and next-to-last isopods would have much lessinfluence on the overall result, and you would be less likely to get a misleadingly"significant" result if there really isn't a difference between males and females.Some variables are impossible to measure objectively with instruments, sopeople are asked to give a subjective rating. For example, pain is often measuredby asking a person to put a mark on a 10-cm scale, where 0 cm is "no pain" and 10cm is "worst possible pain." This is a measurement variable, even though the"measuring" is done by the person's brain. For the purpose of statistics, theimportant thing is that it is measured on an "interval scale"; ideally, the differencebetween pain rated 2 and 3 is the same as the difference between pain rated 7 and8. Pain would be a ranked variable if the pains at different times were comparedwith each other; for example, if someone kept a pain diary and then at the end ofthe week said "Tuesday was the worst pain, Thursday was second worst,Wednesday was third, etc." These rankings are not an interval scale; thedifference between Tuesday and Thursday may be much bigger, or much smaller,than the difference between Thursday and Wednesday.Circular variablesA special kind of measurement variable is a circular variable. These have theproperty that the highest value and the lowest value are right next to each other;often, the zero point is completely arbitrary. The most common circular variables10
Types of variablesin biology are time of day, time of year, and compass direction. If you measuretime of year in days, Day 1 could be January 1, or the spring equinox, or yourbirthday; whichever day you pick, Day 1 is adjacent to Day 2 on one side and Day365 on the other.If you are only considering part of the circle, a circular variable becomes aregular measurement variable. For example, if you're doing a regression of thenumber of geese in a corn field vs. time of year, you might treat Day 1 to be March28, the day you planted the corn; the fact that the year circles around to March 27would be irrelevant, since you would chop the corn down in September.If your variable really is circular, there are special, very obsc
Step-by-step analysis of biological data I find that a systematic, step-by-step approach is the best way to analyze biological data. The statistical analysis of a biological experiment may be broken down into the following steps: 1. Specify the biological question to be answered. 2. Put the question in the form of a biologicalnull hypothesisand .