Transcription
2009 International Monetary FundMay 2009IMF Country Report No. 09/163Canada: Selected IssuesThis Selected Issues paper for Canada was prepared by a staff team of the International Monetary Fundas background documentation for the periodic consultation with the member country. It is based on theinformation available at the time it was completed on April 22, 2009. The views expressed in thisdocument are those of the staff team and do not necessarily reflect the views of the government ofCanada or the Executive Board of the IMF.The policy of publication of staff reports and other documents by the IMF allows for the deletion ofmarket-sensitive information.Copies of this report are available to the public fromInternational Monetary Fund Publication Services700 19th Street, N.W. Washington, D.C. 20431Telephone: (202) 623-7430 Telefax: (202) 623-7201E-mail: publications@imf.org Internet: http://www.imf.orgInternational Monetary FundWashington, D.C.
INTERNATIONAL MONETARY FUNDCANADASelected IssuesPrepared by M. Estevão, R. Duttagupta, E. Tsounta, L. Ratnovski, N. Barrera (all WHD),J. Kiff (MCM)Approved by Western Hemisphere DepartmentApril 22, 2009ContentsPageI.Canadian Banks and the Credit Turmoil.2Table 1. Bank Fundamentals and Performance during Turmoil.4Table 2. Bank Fundamentals and Performance: Multivariate Regression Results.5II.Canadian Residential Mortgage Markets: Boring But Effective? .6Figure 1. Canadian Bank Mortgage Rates .8Figure 2. Residential Mortgage versus Interest Rate Swap Rates .8III. The Impact of Global Shocks on Canada—What Do Macro-FinancialLinkages Tell Us? .9Figure 1. Banks' Lending Standards for Corporations and Real GDP Growth .9Figure 2. Impulse Response Functions .10Figure 3. Canadian Real GDP Forecast for 2009 Under Alternative paths forU.S. Real GDP Growth.10Figure 4. Canadian Real GDP Forecast Under Alternative Conditions forCanadian SLOS.10Figure 5. Variance Decomposition of Canadian Real GDP Growth .11Figure 6. Contribution to the Macro-Financial Conditions Index .11IV. Is the Canadian Housing Market Overvalued? A Tale of Two Regions .12Figure 1. Real House Prices.12Table 1. Determinants of House Prices in Selected Canadian Provinces .13Figure 2. Canada: House Price Over/Undervaluation.15V.How Do Commodity Prices Affect Economic Slumps in Commodity Exporters? .16Figure 1. Commodity Price Index.16Table 1. Sample of Countries.16Figure 2. Average Length of Economic Downturns.17Table 2. Fixed Effect Regressions of Length and Depth of Economic Slump .18
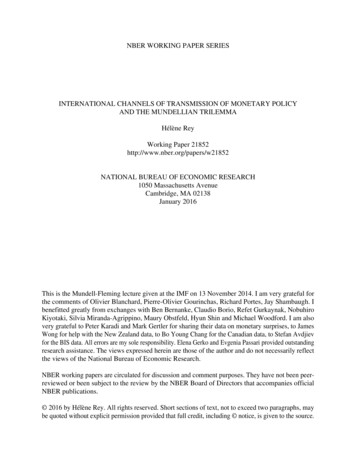
2I. CANADIAN BANKS AND THE CREDIT TURMOIL11.Canadian banks have been relatively resilient to the ongoing credit turmoil. Theeffect of the turmoil on the Canadian financial system is, so far, milder than in other G7economies. Interbank money markets remained functional. No injections of public capitalinto banks were necessary. The resilience appears particularly striking given the closeeconomic and financial links between Canada and the United States.2.To shed light on this resilience, this chapter searches for key variables explainingCanadian bank performance during the crisis. It considers a sample of large OECD banksand studies how pre-crisis balance-sheet structure affected bank performance during thecrisis. The sample includes all large OECD commercial banks (72 institutions with assets inexcess of 100 billion euros at the end of 2006). We consider three main fundamentals: theequity-to-assets ratio, the balance-sheet liquidity-to-debt liabilities ratio, and the depositoryfunding-to-assets ratio. Measures of performance are: equity price decline from January 2007to January 2009, two binary variables for particularly large equity declines (greater than70 or 85 percent), and two binary variables for government intervention (undertaken toalleviate significant financial distress).3.Capital ratios before the crisis were a key determinant of bank performanceduring the turmoil; and Canadian banks had ample capital. Specifically, most bankswith critically low capital at end-2006 later experienced dramatic equity value declines, andmany had to be rescued (Table 1). Prior to the crisis, all Canadian banks had capital ratios(equity over assets, a leverage measure) above 4 percent, which has assured their resilience toasset shocks. Interestingly, a large number of currently distressed U.S. banks had relativelyhigh pre-crisis capital, which was nevertheless quickly exhausted through troubled assetexposures and (in some instances) problematic acquisitions.4.Compared to OECD peers, Canadian banks had slightly above-average balancesheet liquidity. Buffers of highly liquid assets allow banks to bridge temporary cash flowshortfalls, which proved critical during the rush for liquidity. Interestingly, some U.S. bankswere shown to have particularly low measures of high-quality liquidity, as they were usingassets such as tradable mortgage-backed securities as part of their liquidity buffers.5.During a liquidity crisis, access to stable funding is key to survival; Canadianbanks had a high ratio of retail to wholesale deposits. Retail deposits are insured andhence “sticky,” and provide a stable source of long-term funds for banks. In contrast,wholesale funds can withdraw rapidly upon minor negative news, and were a major source of1Prepared by L. Ratnovski and R. Huang.
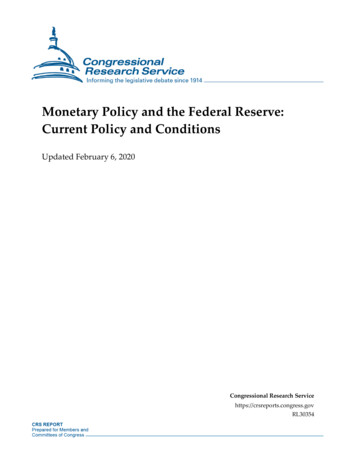
3vulnerability during the turmoil. The relative abundance of retail deposits seems to have beenkey for the resilience of Canadian banks.2 Easy access to retail deposits in Canada isexplained by limited competition for household savings from non-banks, and by restrainedbank asset growth that limited overall demand for funding.6.Multivariate regression analysis confirms and extends these preliminary findings(Table 2). A high share of depository funding and a capital ratio above a critical minimum(although not the capital ratio per se) appear to be the most significant and robustdeterminants of bank resilience during the turmoil. Balance-sheet liquidity is less robust: itcorrelates with major failures, but not equity value declines (except very large ones). Byconsidering interactions, the regressions also identify substitution between bank fundingstructure and capital, where, for a given risk profile, a bank with more depository funding canoperate with lower capital, and a bank with higher capital can use less depository funding. Inaddition, larger banks have a higher probability of government intervention. However, rapidbalance sheet expansion before the crisis appears irrelevant for performance during the crisis.7.Regulatory and structural factors contributed to the resilience of Canadianbanks by reducing their incentives to take risks. Canadian capital requirements aresignificantly more stringent than Basel minima (national targets of 7 percent for tier 1 capitaland 10 percent for total capital, versus 4 and 8 percent prescribed by the Basel Accord).Banks are also subject to a maximum assets-to-total-capital multiple of 20 (corresponding toa leverage ratio of 5 percent). Besides providing an enhanced cushion, stringent capitalrequirements have beneficial incentive effects: they impede rapid balance sheet growth,restrict wholesale activities, and limit foreign expansion to niches where banks have clearcompetitive advantage not related to low cost of capital. Notable structural factors in Canadainclude high franchise values, a mortgage market characterized by prudent underwriting, andan overall prudent and conservative culture in the financial sector. Limited exposure to U.S.assets was a key additional factor behind the resilience of Canadian banks to the crisis.Conclusions and policy implications8.Canadian banks appear well positioned to weather the turmoil. A combination ofstrong capital and robust funding, in the context of sound regulation and supervision, has lentresilience to the banking system. With a severe recession underway, credit losses are likely tocontinue to climb, particularly on exposures to highly-leveraged households. But with banksstable and macroeconomic policies supportive, financial instability appears to be a tail risk.During the crisis, Canadian banks have also had access to official funding programs such asthe Insured Mortgage Purchase Program (IMPP), where the Department of Financepurchased already government-insured mortgages from banks to ease liquidity strains.2
4Table 1. Bank Fundamentals and Performance during 354250636465CountryCapital 1/Ten most vulnerableHypo Real Estate Holding AGGERMANY2.1Deutsche Bank AGGERMANY2.1UBS AGSWITZERLAN2.3Commerzbank AGGERMANY2.5NETHERLAND2.6ABN Amro Holding NVUNITED2.7Barclays PlcFortisBELGIUM2.8Dresdner Bank AGGERMANY3.0Northern Rock PlcUNITED3.2DexiaBELGIUM3.3Selected banksCANADA4.1Canadian Imperial Bank of CommerceCANADA4.3Royal Bank of Canada RBCBanque de Montreal-Bank of MontrealCANADA4.84.9Bank of Nova Scotia (The) - SCOTIABANK CANADAUNITED5.2Royal Bank of Scotland Group Plc (The)CANADA5.7Toronto Dominion BankUSA6.4Citigroup IncUSA8.5Washington Mutual Inc.JP Morgan Chase & Co.USA8.6USA9.3Bank of America yLiquidity 2/Ten most vulnerableCapital One Financial CorporationUSA3.7USA4.0National City CorporationUSA4.3Citizens Financial Group Inc.4.3SunTrust Banks, Inc.USAUSA4.4US BancorpUSA4.8Washington Mutual Inc.USA5.0Regions Financial CorporationJAPAN5.6Nomura Holdings IncUSA6.0Wells Fargo & CompanyNorthern Rock PlcUNITED6.7Selected banksCANADA23.99Banque de Montreal-Bank of MontrealToronto Dominion BankCANADA24.3724.43Bank of Nova Scotia (The) - SCOTIABANK CANADAUNITED25.11Royal Bank of Scotland Group Plc (The)USA25.59Bank of America CorporationCANADA26.00Canadian Imperial Bank of CommerceRoyal Bank of Canada RBCCANADA32.11USA39.46Citigroup IncUSA46.80JP Morgan Chase & Co.Depository fundingCountry3/Ten most vulnerableHypo Real Estate Holding AGGERMANY24.0Northern Rock PlcUNITED28.7Deutsche Bank AGGERMANY34.1BNP ParibasFRANCE36.7USA37.8Citigroup IncHBOS PlcUNITED41.0Société GénéraleFRANCE42.0ITALY44.1Banca Monte dei Paschi di Siena SpADexiaBELGIUM44.9NORWAY45.4DnB Nor ASASelected banksUSA47.3JP Morgan Chase & Co.USA47.9Bank of America CorporationUNITED59.3Royal Bank of Scotland Group Plc (The)CANADA65.1Royal Bank of Canada RBCCANADA65.2Banque de Montreal-Bank of MontrealCANADA67.9Toronto Dominion BankCANADA68.2Canadian Imperial Bank of CommerceBank of Nova Scotia (The) - SCOTIABANK CANADA71.4Washington Mutual s: BankScope and staff calculations.1/ Equity over total assets2/ Liquid assets over total debt liabilities3/ Depository funding over total assetsBank performance during the turmoil(Jan 2007-Jan 2009)Equity declineGovernment intervention97817989.8594.10089Asset guarantees and public loans544453429643941005087Equity et guaranteesCapital injectionNationalized (carved out from Fortis)Broken up, part nationalizedCapital injectionNationalizedNationalizedCapital injection, asset guaranteesRecapitalized, asset guaranteesFailed, taken over by FDICCapital injection, asset guaranteesGovernment interventionAcquired by PNC BankNot available (owned by RBS)Failed, taken over by FDICNationalizedCapital injection, asset guaranteesCapital injection, asset guaranteesCapital injection, asset guaranteesEquity declineGovernment intervention9710081659410074688974Asset guarantees and public loansNationalized5087964453435442100 85% 70%Capital injection, asset guaranteesCapital injection (part of Lloyds)NationalizedCapital injection, asset guaranteesCapital injection, asset guaranteesFailed, taken over by FDICDue to an imminent failureDue to a severe deterioration
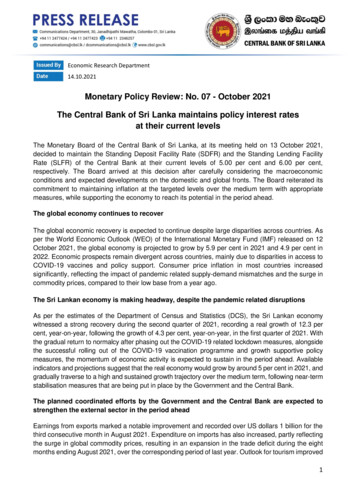
8)**-0.40(-0.55)-51.03(-2.30)**Value decline 70%-3.84-1.161.78(-2.87)*** (-2.03)** (2.03)**-1.19(-1.76)*-31.80(-2.10)**Value Decline (-3.16)*** 8(-3.70)***Value decline (%)Source: Staff calculations.Notes: A sample of large OECD banks (assets above 100 billion euro at end-2006). The dependent variables are three dummy variables for imminent bank failure,stock market value decline by 85%, and stock market decine by 70%, as well as the absolute value of stock market decline (stock decline measured January2007 to January 2009). Capital ratio is the equity-to-assets ratio; balance sheet liquidity is the liquid assets-to-debt-liabilities ratio; depository funding is the depositsto-assets ratio; all taken at end-2006. The regressions involving dummy variables are estimated based on Probit, with coefficients transformed to be interpreted asprobability change (0 to 1). T-statistics are reported in parenthesis. ***, **, * indicate statistical significance at the 1%, 5%, and 10% 6(2.96)***Log 2.80)***Capital Ratio * Depository FundingDepository funding ry ** (-3.04)*** (-2.55)**-0.18(-0.42)Balance Sheet LiquidityCapital Ratio 4%Capital RatioImminent failureTable 2: Bank Fundamentals and Performance: Multivariate Regression Results5
6II. CANADIAN RESIDENTIAL MORTGAGE MARKETS: BORING BUT EFFECTIVE?11.Canada’s financial system has often been criticized for being “too conservative”or “not dynamic enough”. Indeed, when compared to the United States, Canadian banksseem to offer fewer loan options, in particular in the residential mortgage area. This couldmean that households are underserved and that there is wide room for welfare improvementsvia increased financial innovation. However, Klyuev (2008) concluded that this is not thecase and housing finance is highly advanced and sophisticated in Canada. Nevertheless, thesame paper finds that financing options were somewhat limited, particularly at terms longerthan five years.2.This chapter concurs with previous research documenting the sophistication ofCanada’s financial system, but suggests that regulations have limited the supply ofsome products. In particular, the paucity of longer-term loans is caused by a five-yearmaturity cap on government-guaranteed deposit insurance, and a prepayment penalty limit onresidential mortgage loans in the Interest Act. The chapter also argues that for primeborrowers, the availability and cost of residential mortgages are comparable to those in theUnited States.3.The Canadian predominance of shorter terms is driven by the more importantrole (versus in the United States) of retail deposits to fund mortgages, a feature drivenby regulation. Deposits longer than five years are not popular because Canadian DepositInsurance Corporation (CDIC) guarantees do not cover longer terms. Hence, Canadian bankshave no natural funding for cost effective longer-term mortgages.4.Also, regulations cause lenders to pass on the higher cost of hedging prepaymentrisk for longer mortgages in the form of higher interest rates (Figure 1). Section 10 ofCanada’s Interest Act effectively fixes the prepayment penalty for most mortgages with aterm to maturity greater than five years at three-months of interest, which is likely less thanthe penalty charged during the first five years of mortgage terms. Offsetting this to somedegree is the portability of Canadian mortgages.25.Despite different regulations, mortgage costs are broadly similar in the UnitedStates and Canada. Even though at first sight mortgage rates are higher in Canada than inthe United States, “posted” rates overstate actual transacted rates in Canada. Canadian fiveyear conventional rates have averaged about 100 basis points above the U.S. thirty-yearconforming rate (Figure 2, in which both rates are normalized by their respective interest rateswap comparators).3 However, the Canadian rates are “posted” rates that overstate actual1Prepared by J. Kiff, based on a forthcoming IMF working paper.2U.S. homeowners that relocate must prepay their existing mortgages and take on a new one at prevailing rates.3Direct comparisons of fixed-rate mortgage costs are complicated by the fact that the term of “long-term”mortgage in Canada is five years, while it is thirty years or more in the United States. Comparing variable- oradjustable-rate mortgage (VRM or ARM) costs is complicated by the fact that U.S. ARMs embed numerousbells and whistles, such as “teaser rates” (see Kiff and Mills, 2007).
7transacted rates, typically by more than 100 basis points. The Canadian Association ofAccredited Mortgage Professionals (CAAMP) estimates that, on average, recent posted rateshave exceeded transacted rates by 159 basis points (CAAMP, 2008).6.In addition, the apparently lower U.S. thirty-year conforming rates reflect thepayment of upfront points, which effectively prepay interest. For example, onFebruary 19, 2009, the posted conforming rate was 5.04 percent with 0.7 points upfront,which is equivalent to 5.34 percent (plus 30 bps) with zero points. Moreover, there is anincremental term premium embedded in U.S. rates, which reflect the longer term of U.S.loans.7.Anecdotal evidence suggests that the non-interest costs of originating andrefinancing mortgage loans is significantly cheaper in Canada, which would alsocontribute to closing any apparent gap between the costs in both countries. Canadianborrowers pay about C 2,000 in upfront fees and taxes for a new loan, and on a refinancingabout C 1,000 plus a prepayment penalty of about C 3,000 on the old mortgage.4 On thesame loans (new loans and refinancings), U.S. borrowers pay origination fees of 1,000 to 3,000, plus about 1,000 of costs and fees, and local government taxes of about 1,000.8.Payment affordability criteria for prime borrowers are broadly similar in bothcountries. For example, in order to qualify for mortgage insurance in Canada, gross debtservice should usually not exceed 32 percent of gross household income, and total debtservice cost should usually not exceed 40 percent (versus 28 and 36 percent to qualify forFannie Mae and Freddie Mac insurance).9.However, the approval criteria for adjustable-rate loans in Canada are usuallybased on the three-year fixed-term rate, which is usually the highest fixed rate inside ofthe five-year term, whereas U.S. practice is to use the current floating rate.5 Canada also hasa small “Alt-A” market aimed mainly at self-employed people who have difficultydocumenting their stated income.10.Down payment requirements are roughly in line with those in the United States.Canadian federally-regulated deposit-taking institutions have been able to underwrite insuredmortgages with loan-to-value ratios as high as 95 percent since 1992, and occasionally beforethen.11.There are no limits to the size of individual loans that the Canada Mortgage andHousing Corporation (CMHC) and other mortgage insurers will insure, whichminimize risks to banks’ balance sheets. In the United States, Fannie Mae and Freddie Mac4Cost calculations are based on a 240,000, five-percent loan and based on transactions in Ottawa, Ontario(provided by Steven Sheppard of BrazeauSeller LLP) and McLean, Virginia (AimLoan.com).5In fact, until recently, it was U.S. practice to use a fixed “teaser rate” that applied to the first two or three yearsof many adjustable-rate mortgages (ARMs), for affordability calculations (Kiff and Mills, 2007). However,some Canadian lenders have started to qualify adjustable-rate loans on the basis of current floating-rate loanrates.
8insurance is only available on loans up to the “conforming limit”, which vary by geographicareas, but in 2009 is 625,500 for loans on single-family homes in “high-cost” areas.Conclusions and Policy Implications12.The availability and costs of Canadian residential mortgage loans to primeborrowers are comparable to those in the United States. Moreover, even though there areclear institutional differences, homeownership in both countries is virtually identical at about68 percent of all households. This said, some aspects of Canada’s mortgage market can beimproved. To encourage the development of longer-term mortgage markets, the governmentmight consider dropping the five-year cap on CDIC deposit insurance and the five-yearprepayment penalty fixed in the Interest Act. Until that happens, rates on fixed-termresidential mortgages beyond the five year term will remain uneconomical for mostborrowers. The opening up of longer fixed-rate terms would help households to bettermanage financial risks.Figure 1: Canadian Bank Mortgage Rates (February 20, 910(years of maturity)500Figure 2: Residential Mortgage versus Interest Rate Swap Rates(basis points)450Canadian 5Y Conventional v 5Y Swaps400U.S. 30Y Conforming v 10Y May-03Apr-04Mar-05Feb-06Jan-07Dec-07Nov-08
9III. THE IMPACT OF GLOBAL SHOCKS ON CANADA—WHAT DO MACRO-FINANCIALLINKAGES TELL US?11.The paper analyzes how Canada’s strong macro-financial ties with the UnitedStates affect its real activity. It builds on related literature,2 by focusing on the role offinancial conditions in driving Canadian growth. For instance, in the current global crisis,Canada has been affected not only by declining external demand but also by global financialshocks, the latter inducing domestic financial strains. Notably, credit conditions haveremained tight notwithstanding aggressive monetary policy rate cuts. This paper sheds lighton how these external and domestic shocks bear on real GDP growth.2.These issues are assessed by building a macro-financial conditions index forCanada using a Bayesian VAR (BVAR) estimation model, which uses “informative priors”about the steady-state values of the variables to limit loss in estimation precision caused bythe heavy parameterization of VARs.3 This is especially important given the short samplesize, as data on Canadian banks’ lending standards begin in 1999. The model is then used forscenario analyses—i.e., projecting Canada’s growth outlook for alternative external anddomestic conditions—and building a macro-financial index for growth. The “macro” part ofthe index accounts for the impact of external demand conditions, while the “financial” partaccounts for external and domestic financial conditions.3.Banks’ non-price lending standardsin the United States and Canada are used tomeasure credit availability for Canadianbusinesses. Canadian lending standards (fromthe Bank of Canada’s Senior Loan Officer’sSurvey (SLOS)) are strongly correlated withU.S. SLOS for large corporations (Figure 1).Both measures are negatively correlated withCanada’s contemporaneous and future realGDP growth, which is not surprising given thatCanadian businesses raise one-quarter of theirfunding in the United States.4 For instance, theFigure 1. Banks' Lending Standards for Corporations and Real GDP Growth1010080Non-price lending standards for large businesses (Percentage of respondents that tightenedlending standards minus the percentage that eased lending standards, left axis)United StatesCanada606Real GDP growth(year-on-year)40420200-2-20-40(Percentage of respondents that tightened lending standards minus the percentage that eased lendingstandards)-619992000200120022003Prepared by R. Duttagupta and N. Barrera.2See Swiston and Bayoumi (2008), IMF WP/08/03, and Klyuev (2008), IMF WP/08/23.2004200520062007The BVAR model assumes that the forecaster has potentially useful information on the steady state values ofthe variables used in the model, i.e., an informative prior would make forecasts converge to a level that theforecaster judges reasonable. If the forecaster is correct, this leads to a substantial improvement in theforecasting performance of BVAR compared with a standard VAR.4See Klyuev (2008), IMF WP/08/22.-4-60Source: Haver Analytics.1382008
10deceleration in Canadian growth in the early 2000s and more recently coincided with a sharptightening of one or both measures of lending standards.4.The baseline model comprises nine macro-financial variables: (i) U.S. real GDPgrowth (expressed as year-over-year percent change), (ii) oil price growth, (iii) U.S. threemonth t-bill rate, as a proxy for U.S. monetary conditions, (iv) U.S. SLOS, (v) U.S. highyield spread over the 10-year treasury yield, (vi) Canada’s real GDP growth, (vii) CanadianSLOS, (viii) Canada’s three-month t-bill rate, and (ix) growth in Canada’s real effectiveexchange rate. The U.S. variables are allowed to be exogenous with respect to the Canadianvariables. The data cover the period 1999Q2 2008Q4 at a quarterly frequency. While thesteady-state priors were drawn from existing literature or historical averages, the posteriorvalues from the model are close to the priors, implying that the chosen priors are reasonable.5.Impulse-response functions confirm that financial shocks have a significanteffect on growth (Figure 2). A one-percent standard deviation (s.d) shock to the U.S.SLOS—a net tightening of 9.5 percentage points (pp)—reduces Canadian growth by about0.4 pp in six quarters, while the impact of a similartightening in the Canadian SLOS is weaker butworks with a shorter lag—reducing growth by¼ pp in three quarters. The larger effect ongrowth of a tightening in the US SLOS thanthe Canada SLOS could reflect indirect effectsof a higher U.S. SLOS on Canada—tighterU.S. lending standards slow U.S. growth (andhence external demand) while also spillingover to Canadian credit conditions. Also, a ones.d. shock to the U.S. high-yield spread (129 basispoints) shaves off 0.15 pp from growth over three quarters.Figure 2. Impulse Response Functions(Impact on Canada's real GDP growth of one standard deviation shocks to financial indicators)0.10(percentage points)0.050.00-0.05US high yield spread-0.10-0.15-0.20-0.25-0.30-0.35US SLOSCanadian SLOS-0.4001234567891011(quarters)6.Looking ahead, Canada’s economic outlook would be firmly tied to prospects forexternal activity as well as also domestic financial conditions. Conditional forecasts showthat if U.S. growth in 2009 were 1 pp lower than that projected by the unconditional model,then Canada’s growth would also be 1 pp lower (Figure 3), while if Canadian SLOS were10 pp tighter in 2009, then Canada’s growth would be 0.4 pp lower (Figure 4).Figure 3. Canadian Real GDP Forecast for 2009 Under Alternative paths for US Real GDP Growth(percent)2Figure 4. Canadian Real GDP Forecast Under Alternative Conditions for CanadianSLOSCanada real GDP growth, 2009 (percent)US real GDP growth, 200916050Canada real GDP growth, 2009Canada average SLOS, 2009 (percentage of respondents that tightenedlending standards minus the percentage that eased lending -2.3-10-4Unconditional ForecastForecast conditional on US growth 1/1/ The path for US real GDP is assumed to be 1 percentage point lower than the unconditional forecast.Unconditional ForecastForecast conditional on Canadian SLOS 1/1/ The path for Canadian SLOS is assumed to be 10 percentage point tighter than the unconditional forecast.12
117.The variance decompositions for Canada’s real GDP growth confirm thatforeign shocks are the most important source of variation in Canada’s growth over thelong run, with U.S. growth accounting for close to 42 percent, U.S. financial shocks another28 percent, and oil prices 14 percent(Figure 5). The contribution ofdomestic financial conditions toCanadian growth increases from0 percent in the short-term to over8 percent in 12 quarters. Oddlyenough, the contribution of Canadiangrowth to its own variance declinesfrom 43 percent to a little over7 percent in the long run—this couldreflect the fact that the model is basedon a recent sample period (since 1999),when the openness of the Canadian economy to external volatilities, especially vis-à-vis theUnited States has increased markedly. Indeed, a simple monetary BVAR model estimatedstarting in the early 1990s (which excludes data on financial market indicators, i.e., lendingstandards and high yield spreads) attributes a larger role to domestic growth shocks.Figure 5. Variance Decomposition of Canadian Real GDP Growth(percent)100Domestic financial factors9080US financial factorsCanadian real GDP7060Oil5040US real GDP302010008.A macro-f
During a liquidity crisis, access to stable funding is key to survival; Canadian banks had a high ratio of retail to wholesale deposits. Retail deposits are insured and hence "sticky," and provide a stable source of long-term funds for banks. In contrast, wholesale funds can withdraw rapidly upon minor negative news, and were a major source of