Transcription
Differential acute impacts of sleeve gastrectomy, Roux-en-Y gastric bypass surgery and matchedcaloric restriction diet on insulin secretion, insulin effectiveness and non-esterified fatty acid levelsamong patients with type 2 diabetesThomas F, Smith G, Lu J, Babor R, Booth M, Beban G, Chase JG, Murphy R.Manuscript type: Original ContributionAuthors:Felicity, Thomas, BE(Hons)**Department of Mechanical Engineering,University of Canterbury,Private Bag 8140,Christchurch, New Zealandfelicity.thomas@pg.canterbury.ac.nzGreg C SmithDepartment of PharmacologyUNSW AustraliaKensington, 2033Sydney, Australiag.smith@unsw.edu.auJun Lu, PhDSchool of Applied Sciences and School of Interprofessional Health StudiesFaculty of Health and Environmental Sciencesand Institute of Biomedical TechnologyAuckland University of TechnologyPrivate Bag 92006, Box A-25Auckland 1142, New Zealandjun.lu@aut.ac.nzRichard Babor MBChB, FRACSDepartment of General Surgery.Middlemore Hospital.Private Bag 93311 Otahuhu.Auckland 1640Richard.Babor@middlemore.co.nzMichael Booth MBChB FRACSDepartment of General SurgeryWaitemata District Hospital BoardShakespeare nzGrant Beban MBChB, FRACSDepartment of General SurgeryAuckland City HospitalPark RdGraftonAuckland 1023GBeban@adhb.govt.nz1
J, Geoffrey, Chase, PhDDepartment of Mechanical EngineeringUniversity of CanterburyPrivate Bag 8140,Christchurch, New Zealandgeoff.chase@canterbury.ac.nzRinki Murphy, MBChB, FRACP, PhDDepartment of MedicineFaculty of Medical and Health SciencesUniversity of AucklandPrivate Bag 92019,Auckland, New ZealandR.Murphy@auckland.ac.nz**Corresponding authorRunning Title: Bariatric surgery and dietary impact on glucose metabolismFinancial Support: This study was funded by the A research trust and Jens Henrik Jensen fundAcknowledgements: We acknowledge Dr Shelley Yip for her assistance with this study.Keywords: Roux-en-Y gastric bypass, Sleeve gastrectomy, very low calorie diet, obesity, type 2diabetes, non-esterified fatty acid, insulin secretion2
AbstractBackground:Bariatric surgery is an increasingly common option for control of type 2 diabetes (T2D) and obesity.Mechanisms underlying rapid improvement of T2D after different types of bariatric surgery are notclear. Caloric deprivation and altered levels of non-esterified fatty acid (NEFA) have been proposed.This study examines how sleeve gastrectomy (SG), Roux-en-Y gastric bypass (GBP) or matchedhypocaloric diet (DT) achieves improvements in T2D by characterising components of the glucosemetabolism and NEFA levels before and 3 days after each intervention.Methods:Plasma samples at 5 time points during oral glucose tolerance test (OGTT) from subjects with T2Dundergoing GBP (N 11) or SG (N 12) were analysed for C-peptide, insulin and glucose before surgeryand 3 days post intervention or after DT (N 5). Fasting palmitic, linoleic, oleic and stearic acid weremeasured. C-peptide measurements were used to model insulin secretion rate (ISR) usingdeconvolution.Results:Subjects who underwent GBP surgery experienced the greatest improvement in glycaemia (medianreduction in BG from basal by 29% [IQR -57, -18]) and greatest reduction in all NEFA measured. SGachieved improvement in glycaemia with lower ISR and reduction in all but palmitoleic acid. DTsubjects achieved improvement in glycaemia with an increase in ISR, 105% [IQR, 20, 220] and stearicacid.Conclusions:GBP, SG and DT each improve glucose metabolism through different effects on pancreatic beta cellfunction, insulin sensitivity and free fatty acids.3
IntroductionBariatric surgery is an increasingly common and effective therapeutic option for control of type 2diabetes (T2D) and obesity [1, 2]. Rapid improvement of fasting glucose, insulin secretion and insulinresistance has been reported within days of Roux-en-Y gastric bypass (GBP) [3-5] and sleevegastrectomy (SG) [6, 7]. Hypocaloric dieting has also been shown to restore normal glucose levels [8,9]. Although the precise mechanisms underlying such early diabetes remission are not known, caloricdeprivation and decreased levels of non-esterified fatty acid (NEFA) have been proposed [10].NEFA levels are commonly elevated in those suffering from obesity and T2D [11, 12] due to increasedfat mass and cell size in both subcutaneous and intra-abdominal fat tissues and excessive lipolysis inadipose tissues [13]. Chronically elevated plasma NEFA have been shown to contribute to β-celldysfunction in T2D [14-16]. Furthermore, studies indicate that elevated plasma NEFA may directlycontribute to the advance of insulin resistance both in the periphery and the liver [17, 18].Among obese patients with T2D, all three treatments: SG, GBP or hypocaloric diet are known toimprove glycaemia [8, 9, 19]. Bariatric surgery has also been shown to decrease NEFA concentrationswithin one week after intervention [10]. This is consistent with the anti-lipolytic effect of insulin thatlowers plasma NEFA by inhibiting the release of fatty acid from adipose tissue [20]. However, shortterm exposure to very low calorie diet has been shown to increase plasma NEFA [9, 21, 22]. The aimof this study was to examine how each treatment (SG, GBP or matched hypocaloric diet) achievesimprovements in glycaemia by characterising the different components of glucose metabolism andlevels of non-esterified fatty acids (NEFAs) before and 3 days after each intervention. This studyinvestigates the acute effects of surgery and matched surgical diet at 3 days to avoid confoundingeffects of weight loss and also to avoid difficulties of maintaining such matched surgical diet longerterm in patients not having surgery.4
MethodsPatientsPatients with T2D scheduled for either laparoscopic GBP or SG in three different hospitals in theAuckland region (Auckland City Hospital, North Shore Hospital and Middlemore Hospital) betweenAugust 2010 and March 2012 were recruited for the study. Patients on the waiting list for bariatricsurgery were recruited to the matched surgical diet (DT) group. Patients with T2D, between 18 and 50years of age, were eligible for the study if BMI was at least 35 kg/m2. Patients receiving insulin therapy,incretin hormone-based therapy or diet controlled T2D were excluded. Table 1 summarises thesubject characteristics. Informed consent was obtained from all individual participants included in thestudy.All subjects consented to have a 75 g oral glucose tolerance test (OGTT) the day before and at 3 daysafter each intervention. All patients had oral glucose lowering medications withheld from the nightprior to each baseline OGTT until at least their second OGTT, or longer in those who received surgery.Those in the DT control group were asked to undergo equivalent caloric intake as patients in thesurgical group for 3 days of observation, including fasting overnight prior to another 24 h of fasting(sips of water only) followed by free oral fluids and three servings of Optifast on the second and thirddays. All participants were asked to keep a diary of their oral intake.Those who participated in the DT arm of the study were invited to take part again when they werescheduled for either GBP or SG surgery, provided this occurred at least 2 weeks after their DTmeasurements. This minimum 2-week washout period was to ensure that the caloric-matched controlintervention did not increase the optimisation of such surgical patients, beyond the routine presurgical optimisation with Optifast diet for 3 weeks. This study was approved by local ethicscommittee (Northern X Regional ethics committee), and all patients gave informed written consent.5
Table 1: Summary of subject characteristic. Data shown as median [IQR] where appropriate.NAge (years)Gender (M/F)BMI (kg/m2)HbAIc (mmol/mol)Duration of Diabetes (years)Matched caloricintake without surgery(DT)545 [39 53]2/347.8 [38 50]57 [55 67]2 [2 3]Sleeve Gastrectomy(SG)1145 [43 49]3/842.2 [40 48]45 [45 66]3 [2 4]Gastric Bypass Surgery(GBP)1141 [38 46]1/1044.5 [40 49]53 [51 64]4 [1.5 5]Surgical ProtocolPatients scheduled for either laparoscopic GBP or SG were prescribed a hypocaloric diet with threeservings of Optifast (152 cal) plus vegetables daily during the 3 weeks prior to surgery. All patientsfasted from midnight before surgery. The GBP involved a 100 cm antecolic Roux limb with hand sewnpouch-jejunostomy, a 60 cm biliopancreatic limb and a hand sewn small bowel anastomosis. The SGinvolved a longitudinal resection of the stomach against a 32 French bougie from just lateral to theangle to His to 2 cm proximal to the pylorus. Post-operative intravenous fluids with Plasmalyte wereadministered until oral fluid intake was 1 L per day (approximately 48 h). Sips of water occurred onday 1, followed by free oral fluids from day 2 with clear soups, low fat smoothies or Optifast very lowcalorie diet.OGTT and NEFA’sPlasma samples for glucose, C-peptide and insulin were collected at 0, 30, 60, 90 and 120 min afteringestion of 75 g oral glucose (dissolved in 75 mL water). Glucose was measured by autoanalyzer(Hitachi High Technologies Corporation). Insulin and C-peptide were measured using the HumanMetabolic Hormone Panel (Milliplex, Millipore, MA, USA). Five NEFAs in plasma, including Palmitic,Stearic, Oleic, Palmitoleic and Linoleic acid, were measured using an Agilent 6420 triple quadrupoleLC-MS/MS system with margaric acid added in the samples as an internal standard. Chromatographicseparation was achieve by using a VisionHT C18, 3 µm, 2.1X50 mm column (Grace Davidson, Auckland,NZ) with guard. MS2 single ion monitoring (SIM) was set at 253, 255, 269, 279, 281,283 corresponding6
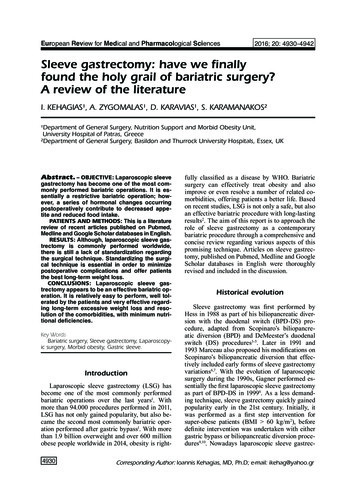
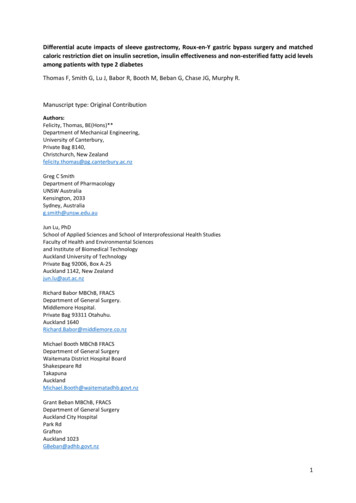
to palmitoleic, palmitic, margaric, linoleic, oleic and stearic acid, respectively, to detect and measurethe five NEFAs and the internal standard.AnalysisC-peptide measurements taken every 30mins during the course of the OGTT were used to modelsubject-specific insulin secretion using deconvolution [23]. Kinetic parameters were based on thesubject’s age and population parameters for T2D subjects.To assess the change in response to the OGTT for each patient, the change in area above basal wascalculated for each metric. Area above basal is the area between the measured basal value (t 0) andthe measured blood glucose (BG), measured plasma insulin (PI), and estimated subject-specific insulinsecretion rate (ISR) profile over the course of the OGTT. These areas are shown in Figure 1. Thepercentage change was calculated as the post-intervention area above basal subtracted from the preintervention area above basal and divided by the pre-intervention area above basal. Thus, a negativechange in the BG area above basal represents a better uptake of the 75g glucose load given in theOGTT. The per-subject percentage change and the median and interquartile range (IQR) wascalculated for each intervention type.7
Blood Glucose(mmol/L)15Plama Insulin(mU/L)50403020100Insulin Secretion(mU/Lmin)301050204060Time (min)801001200204060Time (min)801001200204060Time (min)8010012020100Figure 1: Example displaying the areas above basal for blood glucose (red), Plasma Insulin (green) and Insulin Secretion (blue)for a subject’s response to an OGTTResultsThe majority of subjects experienced an improvement in their glycaemic response to an OGTT testafter the intervention (3/5 DT, 9/11 SG and 9/11 GBP patients showed glycaemic improvement).Overall, subjects who underwent GBP or SG surgery experienced significant improvement in glycaemiawith a median reduction of BG above basal of -29% [IQR -57, -18] after GBP and -19% [IQR -41,-7.3]after SG, as seen in Table 2. DT subjects experienced a non-significant BG reduction although allstopped their oral glucose lowering therapy during the acute period of observation. The DT patientsachieved a lack of glucose deterioration through an increase in ISR, 105% [IQR, 20, 220] while the SGand GBP subjects displayed no significant change in ISR. SG experienced decreased plasma insulinabove basal area while GBP and DT subjects did not have significant change in their plasma insulin.8
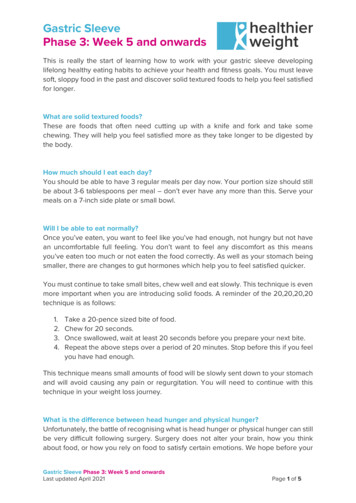
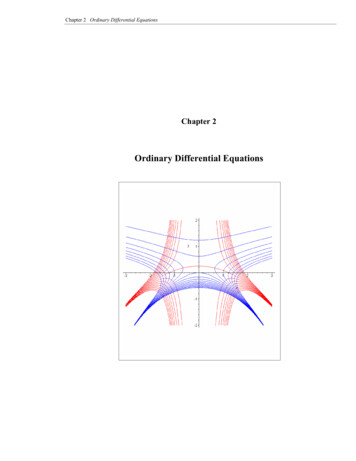
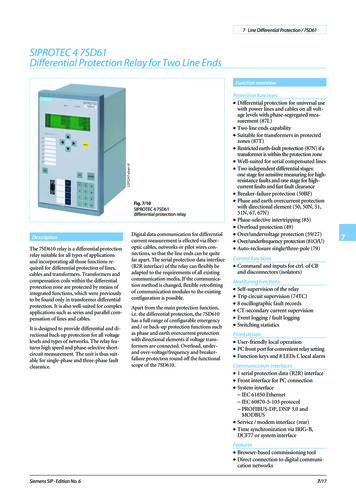
Insulin sensitivity estimated by HOMA-IR did not change significantly among any of the 3 groups asshow in column 5 of Table 2.The 5 GBP and 5 SG subjects in quadrant C of Figure 3 improved glycaemia with decreased ISR abovebasal area, indicating greater insulin sensitivity. The 4 GBP, 4 SG and 3 DT subjects in quadrant Aimproved glycaemia with an increased ISR indicating improved beta cell function. In contrast, the 2 SGsubjects in quadrant D had a worse glycaemic response with decreased ISR indicating decreased betacell function. Finally, the 2 GBP and 2 DT subjects in quadrant B had a worse glycaemic responsedespite increased ISR, indicating reduced sensitivity.In Figure 4 quadrant C, 7 SG, 5 GBP and 2 DT achieved an improvement in glycaemia with a decreasein PI indicating improved uptake of glucose. The 2 SG, 4 GBP and 1 DT in quadrant A had improvedglycaemia and increased PI indicating a greater improvement in sensitivity, especially for GBP subjects29 and 08 who also reduced their ISR above basal area. Quadrant D contains 2 SG and 1 GBP subjectswho had reduced PI and worse glycaemic response, indicating increased insulin losses to kidneys andliver for GBP 19 who had increased ISR area above basal. Quadrant B represents those who haveincreased PI and worse glycaemic response, indicating increased insulin resistance especially as allsubjects in this quadrant have increased ISR above basal area.Figure 2 highlights the overall percentage change in the basal NEFA’s measured before and 3 daysafter each intervention. Subjects in all three intervention groups experienced a significant decrease inpalmitic acid. In addition, those who underwent GBP surgery also experienced a significant reductionin linoleic acid.9
Table 2: Summary per patient of diabetes medications pre-intervention and %change in above basal areas of BG, ISR andPI. Data shown as median [IQR] where appropriate. Significant parameters have been marked with DTMedian[IQR]1112161720222222 [2 81319212933383940412221.5102.551.50332 [ 1.1 2.4]132112.55233322 [1.3 3]Glipizide orGliclazide(mg/day)20n/a10101010n/a5480n/a%Change inHOMA-IR%Change areaabove Basal forBG15.38-47.66-25.1346.37-38.07-25.1 [-41 23]%Change areaabove Basalfor ISR197.9316.48105.2520.82280.55105 [20 220]*%Change areaabove Basal forPI140.70-23.76112.3620.55-37.0020.5 [-27 171.98-1.13-29.10-29.1 [-56 -47.18-6.29-11.98-19.0 [-41 23.032.27-7.46-7.50 [-43 39.38-26.82-27.93-26.8 [ -37 529.2710.5528.4715.6 [-74 29.95-60.00-21.53-29.4 [-57 9572.93-51.246.49 [-29 .3094.82-47.34-1.05 [-40 35]-78.49115.96-0.26-38.55-58.15-38.6 [-68 58]10
%Change Palmitoleic(253)%Change Palmitic (255)100100505000-50-50-100DTSGGBP-100DT%Change Linoleic (279)100505000-50-50DTSGGBP%Change Oleic100-100SGGBP-100DTSGGBP%Change Stearic (283)100500-50-100DTSGGBPFigure 2: Over all cohort percentage change in basal NEFA's measured pre and 3 day post intervention. Data shown as median[IQR] where appropriate.11
20ABIS Area Change above Basal (%)ISR250200DTSGGBP11150100401316 043950029-50C-100-1001212 33 23 35263634 30 3808 024103-502119172724D050100BG Area Change above Basal (%)150Figure 3: % Change in area above basal BG vs. ISR. Quadrants A, B, C and D highlight the different responses of each subject.Those in quadrant C have achieved an improvement in glycaemia with a decrease in ISR indicating greater insulin sensitivity.Quadrant A represents those who have achieved an improvement in glycaemic with an increase in insulin secretion indicatingimproved beta cell function. D represents those who have reduced their ISR and have had a worse glycaemic responseindicating decreased beta cell function. B represents those who have increased ISR and have had a worse glycaemic responseindicating reduced sensitivity.12
04API Area Change above Basal (%)100294023083902 3312 3034 03 26 13363512 9-50D050100BG Area Change above Basal (%)150Figure 4: % Change in area above basal BG vs. PI. Quadrants A, B, C and D highlight the different responses of each subject.Those in quadrant C have achieved an improvement in glycaemia with a decrease in PI indicating improved uptake of glucose.Quadrant A represents those who have achieved an improvement in glycaemic with an increase in PI indicating animprovement in sensitivity if ISR has reduced. D represents those who have reduced their PI and have had a worse glycaemicresponse indicating increased insulin losses to kidneys and liver if ISR has increased. B represents those who have increasedPI and have had a worse glycaemic response indicating increased resistance.DiscussionThe two surgical treatments (SG and GBP), but not matched DT, provided significant improvementsin glycaemia among patients with T2D controlled with oral agents. Greater extent of glycaemicimprovement was seen after GBP than after SG. DT patients achieved lack of glucose deteriorationdespite stopping their oral glucose lowering therapy by increasing ISR. ISR was unchanged after SGand GBP, but patients following SG had significantly decreased plasma insulin.Increasing insulin secretion rate is not thought to be the most sustainable method for achievingglycaemic control due to beta-cell exhaustion, and combined with the fact that it is difficult to sustainsuch dramatic caloric restriction for a prolonged length of time. However, reducing NEFA levels is likely13
to be a more sustainable method for achieving glycaemic control as chronically elevated plasma NEFAhave been shown to contribute to β-cell dysfunction in T2D [14-16]. Furthermore, studies indicate thatelevated plasma NEFA may directly contribute to the advance of insulin resistance both in theperiphery and the liver [17, 18] . These reasons are likely why long term diabetes remission after diet(and to a less extent after SG [24, 25]) is less than that achieved by GBP.Assessing beta-cell function is problematic because insulin secretion by beta-cells is adaptive tochronic stimuli, such as weight changes and acute challenges such as fasting and feeding. Thesecretory indexes that reflect long-term adaptation from those that result from the dynamicbehaviour of the beta cell are basal insulin secretion and total insulin output versus beta-cell glucosesensitivity (the slope of the insulin secretion/plasma glucose dose response relationship) which is theability to control glycaemia by promptly releasing sufficient insulin. This key function is what we havecaptured in the %Change area above Basal for ISR derived from OGTT as we capture the total insulinsecretion in response to a glucose challenge and its change acutely after the intervention before thelong-term weight loss related effects have taken place. %Change above basal refers to the additionalamount of insulin secreted in response to the oral glucose load beyond the basal level.Other studies reporting changes in beta cell function with bariatric surgery show that fasting insulinconcentrations or secretion rates and total insulin output in response to oral glucose are all found todecrease after most types of bariatric surgery [26-29]. This change is attributed to reduced adiposemass and improved insulin sensitivity. AIR and insulinogenic index after GBP have been shown toprogressively improve over time, paralleling ongoing weight loss. What the results from this study add,is the comparative change in insulin secretion leading to better glycaemic response as early as 3 daysafter GBP, SG and matched caloric restriction, when there has been little change in adipose mass.Bariatric surgery is reported to improve the insulin sensitivity in obese patients with T2D by up to 50%in the first 6 weeks when only a small reduction in BMI has occurred, of around 10% [30].Subsequently, after four months, when BMI has dropped by around 30%, insulin sensitivity does not14
improve by much more. This has been attributed to the fact that early after surgery, caloric restrictionplays a major role in improving insulin sensitivity. Months to years after surgery, once weight loss hasstabilised, then a quantitative relationship between the changes in BMI and insulin sensitivity isevident. It is not clear whether there is a greater insulin sensitising power of GBP than SG, althoughbiliopancreatic diversions have been shown to be the most effective in this regard [30]. While HOMAIR did not significantly alter acutely after any of the three interventions, this may have been maskedby the withdrawal of metformin therapy, an insulin sensitising medication.An explanation for those not seeing improvement, quadrants B and D in Figure 2 and 3, can be foundin the trade-off between plasma insulin, insulin secretory rate and BG. Subjects who increase their ISRmay also increase their plasma insulin proportionally – highlighting that while more is being secretedit is failing to be used in the uptake of glucose to cells. DT subjects 11 and 17, and GBP subject 21, alldisplay this reduced uptake of glucose and increase in glycaemic response. In addition, all but twosubjects were on metformin and several were also using sulfonylureas pre-operatively (SG 26 and 34).These drugs were not removed from the participants until midnight before the first OGTT test. Thus,those patients who have not improved (quadrants B and D of Figures 2 and 3) have not been able toachieve the same level of glycaemic control as with their medications, not that they do not possiblyhave some small improvement from the glycaemic response they would achieve without medicationor intervention.LimitationsThe main limitation of this study is the low cohort numbers especially within the DT group. It is difficultto obtain significant trends in a small data set. However, this initial proof of concept investigation hasshown that it is worth pursuing this avenue of investigation. A larger cohort study is the next step toproving that the patterns underlying improvement in glycaemia are specific to each type ofintervention and assessing the variability in mechanisms involved. Whether this will be able to assistin determining the most appropriate therapy and/or the risk of failure to respond for patients withdifferent underlying glucose abnormalities is yet to be demonstrated.15
One of the difficulties with defining the best treatment for different patients, is the lack of accuratephenotyping of patients with T2D. Even duration of diabetes is dependent on the screening practicefor T2D and degree of patient concern around presentation with minor osmotic symptoms, leading tovariable delays in diagnosis. While triglycerides and total cholesterol, HDL and LDL cholesterol aremeasured as part of cardiovascular risk profiling, NEFAs are currently not measured in routine clinicalpractice. Fasting insulin, C-peptide and OGTTs are also not frequent in routine clinical practice.Another limitation is the fact that patients were on their diabetes medication up until midnight beforethe first OGTT results. This makes it difficult to gauge the improvement of those non-responsivepatients. It is unknown what residual metformin effects are acting on each individual and it is likelythat two patients with the same levels of metformin will have different outcome effects on glucosemetabolism. However, the trends found are still valid as long as one considers no improvement asuccess as the subject is able to respond without the aid of medication in the same way as when usingmedication.The third limitation is the infrequent sampling interval of C-peptide. Sampling every 30 minutesprovides a good indication using Van Cauter et al. [23] deconvolution method of the insulin secretedbut more frequent sampling 15mins would provide a much more accurate approximation of theinsulin secretion levels.Finally, the short interval of three days post-surgery was selected to avoid confounding effects ofweight loss and also to avoid difficulties of maintaining such matched surgical diet longer term inpatients not having surgery. Following the acute stress response to surgery, these patients may nothave recovered to steady-state, however, continuous glucose measurements of these patients takenpreoperatively, indicate return of glycaemic fluctuations to pre-operative levels from 24 hours aftersurgery [31].16
ConclusionGBP achieves the largest improvement in glycaemia which may be linked to its success in reducingboth linoleic and palmitic NEFA concentrations. SG achieves significant improvement in glycaemiawith lower plasma insulin increasing the effectiveness of the insulin secreted. While DT did notachieve significant improvement in glycaemia, it was associated with a significant increase in ISR.These results indicate that GBP, SG and DT each improve glucose metabolism through different effectson pancreatic beta cell function, insulin sensitivity and free fatty acids. However, it is important tonote that C-peptide, insulin and glucose levels measured so soon after SG or GBP surgery do notnecessarily indicate the extent of diabetes remission long term.Conflict of Interest Disclosure Statement: The authors declare that they have no conflict of interestA Statement of Informed Consent: Informed consent was obtained from all individual participantsincluded in the studyReferences1.2.3.4.5.6.Kashyap, S.R., et al., Bariatric surgery for type 2 diabetes: weighing the impact for obesepatients. Cleve Clin J Med, 2010. 77(7): p. 468-76.Buchwald, H., et al., Weight and Type 2 Diabetes after Bariatric Surgery: Systematic Reviewand Meta-analysis. American Journal of Medicine, 2009. 122(3): p. 248-U81.Pories, W.J., et al., Who Would Have Thought It - an Operation Proves to Be the MostEffective Therapy for Adult-Onset Diabetes-Mellitus. Annals of Surgery, 1995. 222(3): p. 339352.Isbell, J.M., et al., The Importance of Caloric Restriction in the Early Improvements in InsulinSensitivity After Roux-en-Y Gastric Bypass Surgery. Diabetes Care, 2010. 33(7): p. 1438-1442.Kashyap, S.R., et al., Acute effects of gastric bypass versus gastric restrictive surgery on betacell function and insulinotropic hormones in severely obese patients with type 2 diabetes.International Journal of Obesity, 2010. 34(3): p. 462-471.Bayham, B.E., et al., Early Resolution of Type 2 Diabetes Seen After Roux-en-Y Gastric Bypassand Vertical Sleeve Gastrectomy. Diabetes Technology & Therapeutics, 2012. 14(1): p. 30-34.17
.25.26.27.28.Ramon, J.M., et al., Effect of Roux-en-Y Gastric Bypass vs Sleeve Gastrectomy on Glucose andGut Hormones: a Prospective Randomised Trial. Journal of Gastrointestinal Surgery, 2012.16(6): p. 1116-1122.Henry, R.R., L. Scheaffer, and J.M. Olefsky, Glycemic effects of intensive caloric restrictionand isocaloric refeeding in noninsulin-dependent diabetes mellitus. J Clin Endocrinol Metab,1985. 61(5): p. 917-25.Lim, E.L., et al., Reversal of type 2 diabetes: normalisation of beta cell function in associationwith decreased pancreas and liver triacylglycerol. Diabetologia, 2011. 54(10): p. 2506-14.Salinari, S., et al., Twenty-four hour insulin secretion and beta cell NEFA oxidation in type 2diabetic, morbidly obese patients before and after bariatric surgery. Diabetologia, 2008.51(7): p. 1276-84.Reaven, G.M., et al., Measurement of Plasma-Glucose, Free Fatty-Acid, Lactate, and Insulinfor 24-H in Patients with Niddm. Diabetes, 1988. 37(8): p. 1020-1024.Yue, K.T., et al., Effect of glucose on plasma concentrations of individual non-esterified fattyacids of non-diabetic and insulin-independent diabetic men. Postgrad Med J, 1981. 57(672):p. 622-6.Schaffer, J.E., Lipotoxicity: when tissues overeat. Curr Opin Lipidol, 2003. 14(3): p. 281-7.Unger, R.H., Lipotoxicity in the Pathogenesis of Obesity-Dependent Niddm - Genetic andClinical Implications. Diabetes, 1995. 44(8): p. 863-870.McGarry, J.D. and R.L. Dobbins, Fatty acids, lipotoxicity and insulin secretion. Diabetologia,1999. 42(2): p. 128-138.Sako, Y. and V.E. Grill, A 48-Hour Lipid Infusion in the Rat Time-Dependently Inhibits GlucoseInduced Insulin-Secretion and B-Cell Oxidation through a Process Likely Coupled to Fatty-AcidOxidation. Endocrinology, 1990. 127(4): p. 1580-1589.Boden, G., Role of fatty acids in the pathogenesis of insulin resistance and NIDDM. Diabetes,1997. 46(1): p. 3-10.Shulman, G.I., Cellular mechanisms of insulin resistance. Journal of Clinical Investigation,2000. 106(2): p. 171-176.Yip, S., L.D. Plank, and R. Murphy, Gastric bypass and sleeve gastrectomy for type 2 diabetes:a systematic review and meta-analysis of outcomes. Obes Surg, 2013. 23(12): p. 1994-2003.Bierman, E.L., I.L. Schwartz, and V.P. Dole, Action of insulin on release of fatty acids fromtissue stores. Am J Physiol, 1957. 191(2): p. 359-62.Hirsch, J. and R.B. Goldrick, Serial Studies on the Metabolism of Human Adipose Tissue. I.Lipogenesis and Free Fatty Acid Uptake and Release in Small Aspirated Samples ofSubcutaneous Fat. J Clin Invest, 1964. 43: p. 1776-92.Gray, D.S., et al., Changes in individual plasma free fatty acids in obese females duringfasting and refeeding. Int J Obes, 1991. 15(2): p. 163-8.Van Cauter, E., et al., Estimation of insulin secretion rates from C-peptide levels. Comparisonof individual and standard kinetic parameters for C-peptide clearance. Diabetes, 199
Surgical Protocol Patients scheduled for either laparoscopic GBP or SG were prescribed a hypocaloric diet with three servings of Optifast (152 cal) plus vegetables daily during the 3 weeks prior to surgery. All patients fasted from midnight before surgery. The GBP involved a 100 cm antecolic Roux limb with hand sewn