Transcription
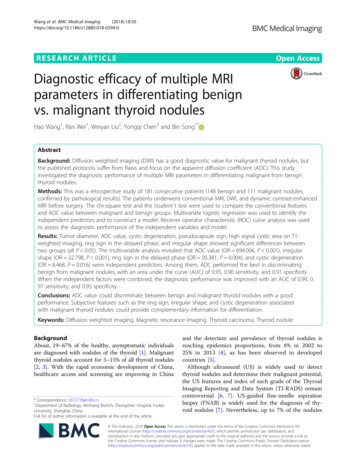
Wang et al. BMC Medical Imaging(2018) ARCH ARTICLEOpen AccessDiagnostic efficacy of multiple MRIparameters in differentiating benignvs. malignant thyroid nodulesHao Wang1, Ran Wei1, Weiyan Liu2, Yongqi Chen3 and Bin Song1*AbstractBackground: Diffusion weighted imaging (DWI) has a good diagnostic value for malignant thyroid nodules, butthe published protocols suffer from flaws and focus on the apparent diffusion coefficient (ADC). This studyinvestigated the diagnostic performance of multiple MRI parameters in differentiating malignant from benignthyroid nodules.Methods: This was a retrospective study of 181 consecutive patients (148 benign and 111 malignant nodules,confirmed by pathological results). The patients underwent conventional MRI, DWI, and dynamic contrast-enhancedMRI before surgery. The chi-square test and the Student t test were used to compare the conventional featuresand ADC value between malignant and benign groups. Multivariate logistic regression was used to identify theindependent predictors and to construct a model. Receiver operator characteristic (ROC) curve analysis was usedto assess the diagnostic performance of the independent variables and model.Results: Tumor diameter, ADC value, cystic degeneration, pseudocapsule sign, high signal cystic area on T1weighted imaging, ring sign in the delayed phase, and irregular shape showed significant differences betweentwo groups (all P 0.05). The multivariable analysis revealed that ADC value (OR 694.006, P 0.001), irregularshape (OR 32.798, P 0.001), ring sign in the delayed phase (OR 20.381, P 0.004), and cystic degeneration(OR 8.468, P 0.016) were independent predictors. Among them, ADC performed the best in discriminatingbenign from malignant nodules, with an area under the curve (AUC) of 0.95, 0.90 sensitivity, and 0.91 specificity.When the independent factors were combined, the diagnostic performance was improved with an AUC of 0.99, 0.97 sensitivity, and 0.95 specificity.Conclusions: ADC value could discriminate between benign and malignant thyroid nodules with a goodperformance. Subjective features such as the ring sign, irregular shape, and cystic degeneration associatedwith malignant thyroid nodules could provide complementary information for differentiation.Keywords: Diffusion weighted imaging, Magnetic resonance imaging, Thyroid carcinoma, Thyroid noduleBackgroundAbout, 19–67% of the healthy, asymptomatic individualsare diagnosed with nodules of the thyroid [1]. Malignantthyroid nodules account for 5–15% of all thyroid nodules[2, 3]. With the rapid economic development of China,healthcare access and screening are improving in China* Correspondence: Sb72778@189.cn1Department of Radiology, Minhang Branch, Zhongshan Hospital, FudanUniversity, Shanghai, ChinaFull list of author information is available at the end of the articleand the detection and prevalence of thyroid nodules isreaching epidemics proportions, from 8% in 2002 to25% in 2013 [4], as has been observed in developedcountries [5].Although ultrasound (US) is widely used to detectthyroid nodules and determine their malignant potential,the US features and index of each grade of the ThyroidImaging Reporting and Data System (TI-RADS) remaincontroversial [6, 7]. US-guided fine-needle aspirationbiopsy (FNAB) is widely used for the diagnosis of thyroid nodules [7]. Nevertheless, up to 7% of the nodules The Author(s). 2018 Open Access This article is distributed under the terms of the Creative Commons Attribution 4.0International License (http://creativecommons.org/licenses/by/4.0/), which permits unrestricted use, distribution, andreproduction in any medium, provided you give appropriate credit to the original author(s) and the source, provide a link tothe Creative Commons license, and indicate if changes were made. The Creative Commons Public Domain Dedication o/1.0/) applies to the data made available in this article, unless otherwise stated.
Wang et al. BMC Medical Imaging(2018) 18:50yield non-diagnostic cytology and an additional 15–30%of fine-needle aspiration cytology (FNAC) show an indeterminate cytology [7, 8].DWI reflects the random Brownian motion of watermolecules within a voxel of tissue. The movement of thetissue water molecules between the two opposing gradients will result in dephasing, which is seen as signal loss.ADC can be quantified calculated with repeating the sequence in different magnetic field strengths [9]. The ADCdepends largely on the presence of barriers to diffusionwithin the water microenvironment, namely, cell membranes and macromolecules [10]. Malignant thyroidnodules usually have a lower ADC value compared tobenign nodules [11–15], but this is controversial [16]and most of these studies used relatively low b values( 500 10 3/m2) [11, 14]. DWI has been shown to beof diagnostic value for Graves’ Disease [17], but DWIstudies of thyroid nodules are relatively rare becausethe head and neck region is very heterogeneous andcontains a variety of tissues that include fat, muscle, air,soft tissues, glands, and bones. In addition, MRI ismore expensive and less available than US. Nevertheless, US has 40–80% sensitivity and 40–96% specificityfor malignant thyroid nodules, highlighting the need forcomplementary examinations. In addition, previousDWI studies of thyroid nodules focused on the ADC[11, 12, 14, 16, 18].Therefore, in the present study, we sought to improvethe image quality with a special coil on the neck surfaceand a breath-hold technique, and to investigate the valueof multiple MRI parameters for the diagnosis of thyroidcarcinoma. Quantitative and qualitative parameters wereexamined.MethodsPage 2 of 9Multiparametric MRI protocolMRI was performed with a 1.5 T scanner (EXCITE HDGE Healthcare, Waukesha, WI, USA) equipped with an8-channel special neck surface coil (Chenguang MedicalTechnology Ltd., Shanghai, China). All patients were examined using the same machine, coil, and scan series.The MR imaging protocol included T1-weighted image(T1WI), T2-weighted image(T2WI), DWI, and contrastenhanced T1WI of thyroid. Coronal fat-suppressed T2WI(repetition time (TR)/ echo time (TE), 1280 ms/85 ms;slice thickness; 4 mm; gap, 1 mm; matrix, 288 192; number of excitations (NEX), 4; field of view (FOV), 18 cm);axial T1WI (TR/TE, 460 ms/8 ms; slice thickness, 4 mm;gap, 0.5 mm; NEX, 2; FOV, 14 cm; matrix, 288 192); axialfat-suppressed T2WI (TR/TE, 3000 ms/85 ms, slice thickness, 4 mm; gap, 0.5 mm; NEX, 4;FOV, 14 cm; matrix,320 224). DWI was performed using a single-shot echoplanar imaging sequence with the diffusion gradient bfactor 800 s/mm2. Imaging parameters for DWI were:TR/TE, 6550 ms/minimum; FOV, 14 cm; NEX, 4;matrix, 128 128; slice thickness, 4 mm; and gap 0.5mm. Contrast enhancement studies were implementedusing axial T1WI obtained with a fast-spoiled gradientrecalled echo (TR/TE, 5.7 ms/1.7 ms; FOV, 14 cm;matrix, 192 256; NEX, 1). Gadolinium (Magnevist,Bayer HealthCare Pharmaceuticals, Montville, NJ, USA)was intravenously injected at 0.2 ml/kg body weight and3 ml/s, followed by a 20 ml saline flush. In each patient,a phase was performed prior to the injection of contrastmedium. Six phases were obtained after injection of thecontrast agent at 30, 60, 120, 180, 240, and 300 s. In thecontrast-enhanced protocol, breath-hold was performedduring each phase. Spatial saturation bands were alsoused to remove signal from overlying fat and adjacenttissues. All patients received training on the breath-holdtechnique before the MRI examination.PatientsThis was a retrospective diagnostic study. Between January2013 and December 2016, 479 consecutive patients underwent thyroidectomy at our hospital. Among them, 254 patients had undergone MRI examination within one weekbefore surgery at the Department of Radiology. This studywas approved by the institutional review board of our hospital. The requirement for individual written informedconsent was waived.The inclusion criteria were: 1) thyroid nodule thatunderwent surgery; and 2) available MRI data obtainedwithin one week of surgery. The exclusion criteria were: 1)lesion size 3 mm by US (n 39); 2) poor image qualitydeemed to be non-diagnostic after review (n 15); or 3)lesions with complete cystic changes (n 19).Among the 181 patients included, 140 patients underwent subtotal thyroidectomy, 25 underwent lobectomy,and 16 underwent total thyroidectomy.Image analysisTwo radiologists (13 and 18 years of MRI experience)reviewed all images using an AW4.5 workstation (GEHealthcare, Waukesha, WI, USA). Each radiologist wasblinded to histopathology results. All images were reviewedindependently by the two radiologists. Discrepancies weresolved by discussion.Lesions were evaluated for location, size (the largestlinear dimension of nodules), shape (regular or irregular),margin (clear or vague), signal intensity heterogeneity(homogeneous or heterogeneous on T2WI), cystic degeneration, high signal cystic area on T1WI, ADC value ofsolid tumor area, and degree and pattern of enhancement.ROI (region of interest) of solid tumor area were manuallydrawn in the largest slice of lesions on ADC maps. Thesolid tumor areas were defined as a bright signal intensityidentified on DWI images and dark signal intensity on
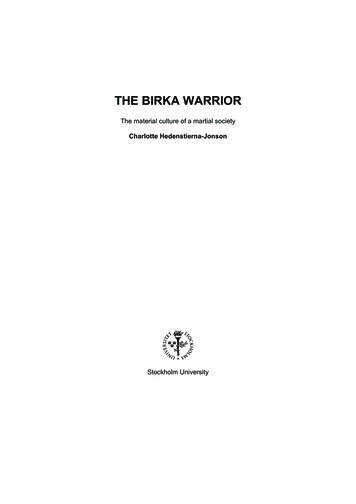
Wang et al. BMC Medical Imaging(2018) 18:50ADC maps. Meanwhile, obvious areas of cystic changes,hemorrhage, calcification, and lesion margins need toavoid based on combined T2WI, contrast enhanced T1WIand DWI. The size of ROIs was determined to correspondwith the darkest portion of lesions on ADC maps ranged10-50 mm2. The ADC values were measured twice andthen the average value was taken.In this study, blood vessels, thyroid tissue, and muscleswere used to assess subjectively the degree of early enhancement of the nodule, which was categorized as: mild(the enhancement was similar to that of adjacent muscletissues); moderate (the enhancement was higher than thatof adjacent muscle tissues but lower than that of bloodvessels); and marked (the enhancement approached thatof blood vessels). The pattern of enhancement reflectedthe dynamic contrast enhancement of thyroid nodulesafter the injection of the contrast agent in the delayedphase with ‘wash in’ or ‘wash out’. The ring sign was defined as the central area of the nodule showing ‘wash out’,whereas the peripheral area showed persistent enhancement. The pseudocapsule sign was defined as the tumorarea showing a clear capsule after contrast agent administration in the delayed phase.Statistical analysisCategorical data were presented as percentage and analyzed using the chi-square test. Continuous data weretested using the Kolmogorov-Smirnov test. Normally distributed continuous data were presented as means standard deviation and analyzed using the Student t test.Non-normally distributed data were presented as mediansFig. 1 Patient flowchartPage 3 of 9(range). All statistical analyses were performed with SPSS23 (IBM, Armonk, NY, USA). Two-sided P-values 0.05were considered statistically significant. Binary logisticregression was used to identify the features that wereindependently predictive of malignant thyroid tumor. Variables demonstrating a significant association with malignant thyroid lesions were entered into the model in aforward stepwise method. The final model was selectedbased on variables with P 0.05. The odds ratios (OR) and95% confidence intervals (95%CI) were used as a measureof the relative magnitude of an association between predictor variables and malignant tumor. ROC curves wereused to determine the cutoff value to differentiate the parameters of malignant from benign tumors.ResultsCharacteristics of the patientsFigure 1 presents the patient flowchart. From 479 patients who underwent thyroid surgery, 254 patientsunderwent MRI examination within 1 week before surgery and 181 patients met the eligibility criteria. Therewere 38 males and 143 females, with 148 benign thyroidnodules (137 nodular goiters, seven follicular adenomas,and four Hashimoto’s thyroiditis) and 111 malignant nodules (107 papillary thyroid carcinomas, three follicular carcinomas, and one medullary carcinoma). The patientswere 50.6 14.2 (range, 12–84) years. No significant differences in patient age (P 0.700) or gender (P 0.419)were found between the benign and malignant nodulegroups (Table 1). There were 140 nodules in the rightlobe, 104 in the left lobe and 15 in the isthmus. A single
(2018) 18:50Wang et al. BMC Medical ImagingPage 4 of 9Table 1 Characteristics of the patients and MRI features of thethyroid nodulesPParametersBenignnodulesMalignantnodulesAge (years)57.4 13.4b45.5 12.7b0.70023:88a0.419aGender (male: female)37:111bSize (mm)b20.1 12.612.0 7.5Location 0.0010.525Right lobe78 (52.7%)62 (55.9%)Isthmus of thyroid7 (4.7%)8 (7.2%)Left lobe63 (42.6%)41 (36.9%)Margin0.080Clear45 (30.4%)23 (20.7%)Vague103 (69.6%)88 (79.3%)Regular136 (91.9%)11 (9.9%)Irregular12 (8.1%)100 (90.1%)Shape 0.001Pseudocapsule sign eneous17 (11.5%)22 (19.8%)Heterogeneous131 (88.5%)89 (80.2%)Signal intensity0.079Cystic )Yes63(42.6%)9(8.1%)No85(57.4%)102(91.9%)High signal cystic area on T1WI 0.001Ring sign 0.001Yes2(1.4%)No146(98.6%) 32ADC values ( 10 mm /s)72(64.9%)39(35.1%)b1.946 0.3491.260 0.225b 0.001Degree of enhancement0.012Mild11 (7.4%)10 (9.0%)Moderate89 (60.1%)82 (73.9%)Marked48 (32.5%)19 (17.1%)Multivariable analysisTable 2 shows the results of the final logistic regressionmodel. The ADC value (OR 694.006, P 0.001), irregular shape (OR 32.798, P 0.001), ring sign in the delayedphase (OR 20.381, P 0.004), and cystic degeneration(OR 8.468, P 0.016) were independently associatedwith malignant thyroid nodules, with 0.961 accuracy.ROC curve analysis 0.001Yesnodules (20.1 12.6 mm, range: 3.8–64.6 mm) were significantly larger than the malignant thyroid nodules (12.0 7.5 mm, range: 4.3–47.3 mm) (P 0.001). The ADC ofthe benign group (1.95 0.35 10 3 mm2/s, range: 0.99–3.16 10 3 mm2/s) was significantly higher than that ofthe malignant group (1.26 0.23 10 3 mm2/s, range:0.77–2.22 10 3 mm2/s) (P 0.001). Cystic degeneration,the pseudocapsule sign, and high signal cystic area onT1WI were more common in benign thyroid nodules (allP 0.001). The ring sign in the delayed phase and irregular shape after contrast agent was significantly more common in the malignant group (both P 0.001) (Figs. 2, 3and 4). There were no significant differences regardingmargin and signal heterogeneity between the malignantand benign groups (both P 0.05).Data are numbers of patients, unless indicated otherwise. Numbers inparentheses are percentagesaGender ratiobmeans standard deviationnodule was found in 126 patients and multiple nodules in55 patients. Fourteen patients had concurrent benign andmalignant nodules.Association between MRI parameters and malignantnodulesTable 1 shows the univariable analyses of the associationbetween MRI features and malignant nodules. The benignThe ROC curve analysis revealed that the best cut-off ofADC values achieved AUC of 0.95, 0.90 sensitivity and0.91 specificity. Cystic degeneration, ring sign, and irregular shape had AUC of 0.76, 0.82, and 0.91, respectively. When the independent factors were combined, thediagnostic performance was improved to an AUC of0.99, 0.97 sensitivity, and 0.95 specificity (Fig. 5).DiscussionDWI has a good diagnostic value for thyroid disease.Previous studies [17, 19] showed that ADC values ofthe thyroid gland can be used to assess the activity ofGraves’ disease and to differentiate Graves’ disease frompainless thyroiditis in patients with untreated thyrotoxicosis. The ADC value is a noninvasive imaging approach used for differentiating malignant from benignsolitary thyroid nodules, but the published protocolssuffer from flaws and previous studies focus on the ADC[11, 12, 14–16, 18]. Therefore, the aim of the presentstudy was to investigate the diagnostic performance ofmultiple MRI parameters in differentiating malignantfrom benign thyroid nodules. The results showed thatADC, irregular shape, ring sign, and cystic degenerationwere independently associated with malignant thyroidnodules. While the irregular shape, ring sign, and cysticdegeneration can be subjective and dependent upon theradiologist’s experience, ADC can provide quantitativeinformation to differentiate thyroid carcinoma from benign thyroid nodules. The present study suggests that
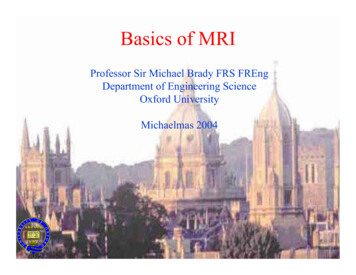
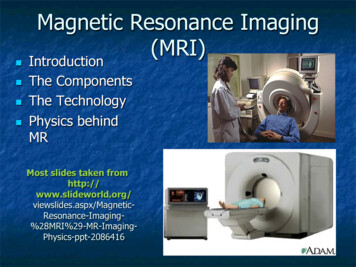
Wang et al. BMC Medical Imaging(2018) 18:50Page 5 of 9Fig. 2 A 47-year-old woman with thyroid nodular goiter in the left thyroid lobe. a Axial T1-weighted image showing a heterogeneous isointensenodule (long arrowhead) with patchy hyperintense signal (white arrow) in the left lobe. b Axial T2-weighted image showing a heterogeneoushyperintense nodule with cystic change (white arrow) in the left lobe. c Axial DWI image showing a hyperintense nodule (white arrow) with ADCvalue of 1.990 10 3 mm2/s. d Axial contrast-enhanced image showing a heterogeneous hyperintense lesion with regular shape and clearmargin in the left thyroid lobe during early phase. e Axial contrast-enhanced image showing the pseudocapsule sign (white arrow) in the leftthyroid lobe during delayed phase. f Histopathological hematoxylin and eosin (H&E, 40) staining showing heterogeneous follicular hyperplasiawith colloid and hemorrhage (white arrow)combining subjective MRI features to a quantitative measurement could improve the diagnostic yield of MRI formalignant thyroid nodules.The incidence of thyroid cancer is rapidly increasing,with a 3% estimated annual increase in the United States[20]. Similar patterns have been reported in Canada,Australia, China, and Western Europe [20, 21]. US is theprimary imaging modality to assess thyroid nodules [22].FNAB is an accurate and cost-effective method forevaluating thyroid nodules, with high diagnostic sensitivity and specificity [23]. Nevertheless, US-guided FNABis an invasive procedure and cannot distinguish betweenFig. 3 A 44-year-old woman with thyroid papillary carcinoma in the right thyroid lobe. a Axial T1-weighted image showing an isointense lesion(white arrow) in the right thyroid lobe. b Axial T2-weighted image showing a heterogeneous hyperintense lesion with extrathyroidal extension(white arrow) in the right thyroid lobe. c Axial DWI image showing a hyperintense nodule (white arrow) with ADC value of 1.070 10 3 mm2/s.d Axial contrast-enhanced image showing a moderately enhanced mass-like lesion with irregular shape and extrathyroidal extension (whitearrow) in the right thyroid lobe during the early phase. e Axial contrast-enhanced image showing central wash-out of the lesion, with the ringsign and irregular shape (white arrow) in the right thyroid lobe during the delayed phase. f Histopathological hematoxylin and eosin (H&E, 40)staining showing papillary growth of cancer cells (white arrow) and dense fibrous tissue (black arrow)
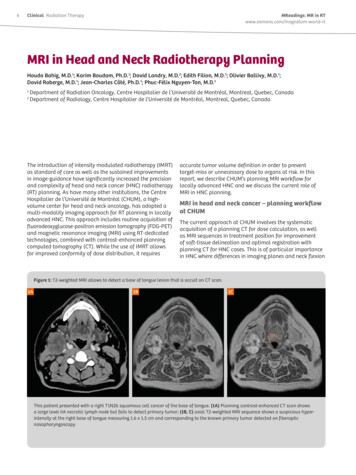
Wang et al. BMC Medical Imaging(2018) 18:50Page 6 of 9Fig. 4 A 53-year-old man with thyroid follicular carcinoma in the right thyroid lobe. a Axial T1-weighted image showing a heterogeneousisointense lesion (white arrow) in the right thyroid lobe. b Axial T2-weighted image showing a heterogeneous hyperintense lesion with regularshape and clear margin (white arrow) in the right thyroid lobe. c Axial DWI image showing a markedly hyperintense nodule (white arrow) withADC value of 0.998 10 3 mm2/s. d Axial contrast-enhanced image showing a markedly enhanced lesion with regular shape and clear margin(white arrow) in the right thyroid lobe during early phase. e Axial contrast-enhanced image shows a wash-out enhanced lesion with regularshape and clear margin (white arrow) in the right thyroid lobe during delayed phase. f Histopathological hematoxylin and eosin (H&E, 40)staining showing abundant follicular hyperplasia (white arrow) and tumor cell invasion in the peripheral stroma (black arrow)benign and malignant non-papillary follicular and oxyphilic cell lesions [6, 12]. MRI is an effective noninvasivemodality to differentiate malignant from benign tumors[24]. A number of MRI studies examined the ADCvalues of thyroid nodules [8, 22, 25], but image qualitywas considered to be relatively poor because of susceptibility artifacts, motion artifacts, and low signal-to-noiseratio with previous head and neck joint coil. One previous study showed that only 26/40 patients had imagesthat could be interpreted because of distortion [8]. Another study showed that patient motion was the majorfactor of exclusion due to breathing, swallowing, andcoughing [2]. In addition, the b value is a critical factoraffecting image quality and ADC values. When low bvalue is used, the ADC value tends to be higher due tothe contribution of perfusion. Applying high maximumb values may be preferable when ADC measurementsare performed to differentiate malignant from benign tissues, exclusively based on their water diffusion characteristics. Nevertheless, the signal-to-noise ratio decreases asthe b value increases, thus limiting the maximum b value.Table 2 Independent Variables in the regression equationParametersORP95% CILowerUpperADC694.00649.7699677.615 0.001Irregular shape32.7986.495165.619 0.001Ring sign20.3812.668155.7170.004Cystic degeneration8.4681.48748.2250.016In addition, we used a neck surface coil to increase thesignal-to-noise ratio. Indeed, because the coil was close tothe surface of neck, it could minimize the air-tissueboundary for reducing susceptibility artifacts. Therefore, arelatively high b value (800 10 3 s/mm2) was used,which could better reflect the actual diffusion characteristics in this study. In addition, we used special techniquesto improve image quality. A relatively small FOV (14 14cm) was used to reduce susceptibility artifacts. Shimblocks were used to optimize magnetic homogeneity inthe thyroid region. All patients received respiratory training to improve movement-related problems. We used abreath-hold technique on dynamic contrast-enhancedMRI phase to reduce breathing motion artifacts and addedsaturated zone to reduce carotid artery pulsatile artifacts.Therefore, 239 of the 254 patients showed excellent imagequality in this study.Some studies have shown that DWI can differentiatebenign from malignant thyroid nodules [7, 12, 14, 26].Nevertheless, the numbers of cases included in thesestudies were relatively small and the findings were sometimes inconclusive [16, 26]. The sample size of thepresent study was relatively large, with 181 patients and259 thyroid lesions. Malignant nodules in this studyshowed lower ADC values compared with benign nodules. Logistic regression showed that ADC values had ahigh prediction value for the malignant status of thyroidlesions. Cytological features of malignant thyroid nodules in this study included enlarged and irregular nuclei,increased cell density, and relatively severe desmoplastic
Wang et al. BMC Medical Imaging(2018) 18:50Page 7 of 9Fig. 5 Receiver operating characteristic (ROC) curve of the apparent diffusion coefficient (ADC) values, shape, ring sign, cystic degeneration, andthe combined model for differentiating benign from malignant thyroid nodulesresponse, whereas abundant follicles, extracellular fluidand smaller cell density resulted in higher ADC valuesin adenoma and nodular goiter. These results were consistent with previous studies [18, 26].Dynamic contrast enhancement can play a complementary role in the diagnosis of thyroid carcinoma. During thedelayed phase, the ring sign (with a central washoutenhancement) was seen in a large number of malignantthyroid nodules, which was not reported in previous studies. The central tumor area with washout indicates activegrowth of tumor cells, whereas the peripheral area ismainly composed of loose connective tissue with abundant intercellular matrix. Peripherally enhanced areas inmalignant thyroid tumors during the delayed phase mayalso be related to the fibrous stroma of the tumor and thepresence of vascular fibrotic stroma. Malignant thyroidnodules in the present study showed irregular shape aftercontrast agent. The histopathological characteristics ofthyroid carcinoma indicate the invasive and heterogeneous growing pattern. One recently published study [27]also showed that irregular margins on US were strong predictor of malignancy.In the present study, cystic degeneration, high signalcystic area on T1WI, and the pseudocapsule sign weresignificantly more frequent in benign thyroid nodulesthan in malignant nodules. Nodular goiter was the mainpathological type of benign thyroid nodules in this study.Due to the relative abundance of colloid follicles andhemorrhage, nodular goiter showed cystic changes andhigh signal intensity in cystic areas. Shi et al. [26] showedsimilar results. Na et al. [28] showed that the risk of malignancy of partially cystic nodules was lower than the risk ofmalignancy of purely solid nodules. Similar to previousstudies [28], the present study showed that 68.9% of thyroid benign nodules showed cystic changes, but only17.1% of the malignant lesions showed cystic changes.The pseudocapsule sign was not the real capsule of tumor,but showed a clear capsule after contrast agent administration because the tumor compressed the peripheralthyroid parenchyma and caused fibrosis. Therefore, thepseudocapsule sign indicates a chronic and benign pathological process.In this study, the enhancement degree between thetwo groups was significantly different, but there wasmajor overlap between the two groups. Nodular goiterand adenoma showed moderate or marked enhancement with abundant hyperplasia of thyroid follicles.Follicular thyroid carcinoma showed marked enhancement because of abundant hyperplasia of thyroid follicles and neovascularity. Papillary thyroid carcinomas
Wang et al. BMC Medical Imaging(2018) 18:50demonstrated moderate or marked enhancement withincreased cell density, severe desmoplastic response,and cell proliferation, which were consistent with previous studies [26, 29].Taken together, the present study strongly suggeststhat multiple MRI parameters should be consideredwhen evaluating thyroid nodules. While irregular shape,ring sign, and cystic degeneration can be subjective anddependent upon the radiologist’s experience, ADC canprovide quantitative information to differentiate thyroidcarcinoma from benign thyroid nodules. On the otherhand, whether the parameters observed in the presentstudy are better than other modalities such as US, computed tomography, and scintigraphy [30] require additional studies.This study has several limitations. Firstly, this studywas retrospective in design, leading to selection biasand therefore undermining the validity of the results.Prospective studies with larger sample size would increasethe credibility of the results. Secondly, thyroid nodulesmeasuring 3 mm were not included. Improvements inMRI software and using smaller slice gaps may facilitatethe detection of smaller lesions in future studies. Importantly, it has been shown that small thyroid lesions are athigher risk of malignancy than larger ones [21]. Therefore,the present study probably underreported the number ofmalignant lesions. Thirdly, in this study, the major malignant pathological type was papillary carcinoma, while themajor benign type was nodular goiter, similar to previousstudies [18, 26]. Nevertheless, the underrepresentation ofrarer pathological types could bias the results. We need toenlarge the samples in the following studies. Fourthly, ourcenter only has a 1.5-T MRI scanner and differences inimaging parameters for malignant thyroid nodules couldnot be compared with a 3-T scanner. In addition, 1.5 TMRI scanners cannot implement multiple b values and weapplied a high b value to better reflect the value of diffusion. Meanwhile, with technological and software development, some advanced diffusion imaging like diffusiontensor imaging has been used for the differentiation between malignant and benign tumors of the head and neck[31]. Our center could not implement those different advanced diffusion imaging modules. Furthermore, we couldnot determine the K-trans value because dynamic contrastenhancement at our center is routinely done at 30 s, 60s, and then every minute, and only the trend of dynamic enhancement could be extracted. Fifthly, weused a neck surface coil to increase signal noise ratioand many techniques to reduce artifacts, but we didnot compare the differences among the coils and techniques. In addition, we did not compare the differenceamong different pathological types. Finally, the irregularshape, ring sign, and cystic degeneration are indeedsubjective, but these parameters had nevertheless highPage 8 of 9sensitivity and specificity. These parameters have notbeen reported before, and could have some value forthe management of patients with thyroid nodule.ConclusionsMultiple MRI parameters could be helpful to differentiatemalignant thyroid nodules from benign nodules. The logistic regression showed that ADC value could discriminate between benign and malignant thyroid nodules with agood performance. Subjective signs such as the ring sign,irregular shape, and cystic degeneration associated withmalignant thyroid nodules could provide complementaryinformation for differentiation. Combining subjective MRIfeatures to a quantitative measurement could improve thediagnostic performance of MRI for malignant thyroidnodules.AbbreviationsADC: Apparent diffusion coefficient; AUC: Area under the curve;DWI: Diffusion weighted imaging; FNAB: Fine-needle aspiration biopsy;FNAC: Fine-needle aspiration cytology; FOV: Field of view; NEX: Number ofexcitations; ROC: Re
contrast-enhanced protocol, breath-hold was performed during each phase. Spatial saturation bands were also used to remove signal from overlying fat and adjacent tissues. All patients received training on the breath-hold technique before the MRI examination. Image analysis Two radiologists (13 and 18years of MRI experience)