Transcription
Faculty of Technology and SciencePhysicsStig E. ForshultMagnetic Resonance ImagingMRI – An OverviewKarlstad University Studies2007:22
Stig E. ForshultMagnetic Resonance ImagingMRI – An OverviewKarlstad University Studies2007:22
Stig E. Forshult. Magnetic Resonance Imaging – MRI – An OverviewResearch ReportKarlstad University Studies 2007:22ISSN 1403-8099ISBN 978-91-7063-125-2 The authorDistribution:Karlstad UniversityFaculty of Technology and SciencePhysicsSE-651 88 KarlstadSWEDENPhone 46 54 700 10 00www.kau.sePrinted at: Universitetstryckeriet, Karlstad 2007
Magnetic Resonance Imaging – MRI – An OverviewbyStig E. ForshultDepartment of Chemistry and Biomedical ScienceKarlstad University, SE 651 88 Karlstad, Sweden
Magnetic Resonance Imaging – MRI – An Spatial InformationMagnetic GradientsThree Dimensional EncodingTheoryThe Larmor FrequencyLongitudinal relaxationTransverse relaxationThe spin echoConstructing the MR imageCreating ContrastFast Acquisition MRI MethodsReceiver Coils and Parallel ImagingEco Planar ImagingMagnetic Resonance AngiographyContrast AgentsImaging with hyperpolarized gasesUse of MRISafety and RisksSafety in MRI ImagingRisks of MRIEquipment for MRIResistive MagnetsSuperonducting MagnetsPermanent MagnetsDesignRF- and Detector 525273030323336373838394242434343454546
10.ReferencesAppenix I, Weighting of the MR imageAppendix II, Some acronyms used in MRIAppendix III, MRI Literature46
Magnetic Resonance Imaging – MRI – An OverviewStig E. ForshultDepartment of Chemistry, University of Karlstads universitetSE 651 88 Karlstad, SwedenAbstractMagnetic Resonance Imaging or MRI is a modern diagnostic technique foracquiring information from the interior of a body. Usually this is a human bodyor an animal, but MRI is also used in the industry for more technical purposes.The greatest advantage of MRI is that it can create three-dimensional images ofthe object under study without hurting the object in any way and without usingany ionizing radiation.The body to be imaged is placed in a strong magnetic field; more than tenthousand times as strong as the magnetic field of the Earth. A radio signal inthe form of one or more short pulses is sent into the body, where it is absorbedby nuclei of hydrogen atoms. These are also called protons. The radio signal isof the same kind as radio waves used by TV and FM radio stations. Thehydrogen nuclei of the body respond by creating a slowly decaying radio signalin a receiver coil. The strength of this signal mirrors the amount of protons; i.e.the concentration of hydrogen in various parts of the imaged body.When creating an image of an organ within a body, the signal must be acquiredfrom every part of the organ point by point by a scanning procedure. Toaccomplish this, the magnetic field is varied with successive gradients in threedimensions. The monitored signal is the sum of signals from every uniquevolume element within the body. In this way the instrument receives thousandsor even millions of data creating a set of equations from which the signalmagnitude of every single volume element can be calculated.Most parts of the body have a roughly equal concentration of hydrogen. Thus,the radio signals from different tissues have similar strengths resulting in animage with low contrast. However, signals from protons decay with unequalspeeds depending on their various environments. Hydrogen atoms exist in1
different compounds and in different tissues. This fact can considerablyinfluence the so-called relaxation time. Therefore the magnitude of the inducedradio signal is monitored some time after the end of the primary radiofrequency pulses which had started the whole process. Now various tissuesshow different signal strengths, from which it is possible to build an image withdesired contrast. This is often excellent, even for soft tissues. Of special interestis that hydrogen in lesions and tumors may have other relaxation times thansurrounding tissues and therefore can be detected in the image.The contrast of the image is created by the experimental procedure and is notinherent in the imaged body. Thus different experimental routines will result inunequal images – not pictures – of the same object. Therefore it is crucial thatthe experimenter learns how to use different RF-pulse sequences and how tointerpret the result.2
Magnetic Resonance Imaging – MRI – an Overview1.IntroductionMagnetic resonance imaging or MRI, first demonstrated in 19731 is now amature analytical modality, which is extensively used as a diagnostic tool withinclinical medicine and also in research. It has many advantages compared toimaging with X-rays and similar diagnostic techniques. It is non-invasive and ituses no ionizing radiation. The disadvantages are few. However, as MRI utilizesradio waves and strong magnetic fields, people with pacemakers cannot beimaged and various kinds of metallic implants within the body may alsoprohibit imaging. In addition, the instruments are still very heavy and expensiveand they need a lot of specially designed space. Commonly they are set up inseparate buildings.MRI is in almost all cases sensitive only to one single element – hydrogen,which is a main constituent of every biological organ; more than 60% on anatomic basis. Thus there are almost no limitations to what samples of biologicalorigin can be imaged. Only bone tissue, which has less and more rigidly boundhydrogen than most other parts of the body, gives a signal with inherently lowamplitude. Other elements will not be seen, but some can influence the imagingprocedure. The contrast in an MRI image is due to the fact that hydrogenatoms in different tissues and compounds have a slightly different chemical andmagnetic environment2. As a consequence they will respond somewhatdifferently to radio waves in the shape of short (radio frequency) RF-pulses,which are sent into the studied object. This makes it possible to detectpathological changes deep within an organ3. Here MRI has its greatestadvantage over most other imaging techniques.The first human imaging with MRI took place more than a quarter of a centuryago4. At that time it took several hours to produce an image, an operation,which today can be performed within minutes or even seconds. The very muchfaster and more reliable machines now commercially available have givenphysicians a very valuable diagnostic tool. However, there is still need for theprofessional judgment and skill when evaluating the images and also whenchoosing the imaging parameters in order to achieve the desired contrast. Anddevelopments are ongoing. New pulse sequences for special tasks and enhancedcontrast are continuously being invented. Faster scanning routines make it3
possible to image dynamic processes as blood flow and drug metabolism withinthe body in real time. This is also the basis of fMRI5, where subtle changes inbrain metabolism caused by various mental or physical activities, can bestudied. Even the magnets are being improved but more slowly. There is atrend towards lighter and more shielded magnets making the stray field weakerin the vicinity of the apparatus in spite of an increased working field. The nextbreakthrough could be the construction of “high temperature” superconducting magnets, which would need only liquid nitrogen at 77 K and notexpensive liquid helium at 4 K in order to be cooled to super conductingcondition, i.e. to conduct an electric current without any resistance at all.1.1ImagingImaging can be done in many ways. Usually, but not always, electromagneticradiation is utilized. Here the golden rule is that it is not possible to imageobjects with a dimension less than the wavelength used. However, this is notvalid for MRI, which will be shown later.Most photographic imaging uses ordinary visible light (wavelength ca 0.5 µm),which is reflected from the surface of an object. Visible light can also be used intransmission mode as in the common microscope and slide projector. To getadditional or more detailed information from the surface of a body one canswitch to longer wavelengths as in IR-imaging (the heat-camera) or to shorterones and use UV-light (wavelengths from 0.4 µm and less) or even X-rays withwavelengths in the order of nanometers. Much longer wavelengths (mm–cm) inreflection mode come to use in Radar. To image very small objects (nm–µm)beams of electrons can be used as in electron microscopes, where bothtransmission and reflection modes are possible. A tunnel microscope, on theother hand, examines a surface in much the same way as one can do with onesfingertips, though almost on an atomic scale. Also reflection of ultra-soundwith wavelengths in the mm-range is a commonly used technique in bothmedicine and engineering.Common to all these imaging modalities is the fact that they result more or lessin only two-dimensional images. The object under study is passive, merelyreflecting or attenuating the radiation, which is directed onto it or through it. Incontrast, MRI is a true three-dimensional imaging technique, where the object4
itself is active, responding in various ways to the radiation, which is sent into it– not only onto it. In this way it has some resemblance to computedtomography (CT, CAT) and positron emission tomography (PET), where onealso can get information from small specific volumes deep inside a humanbody.1.2BackgroundThe foundation of MRI – at the start called NMR imaging – is the physicalphenomenon nuclear magnetic resonance, NMR, which was detectedbefore6 and developed just after WWII7 as proton (hydrogen) magneticresonance. In the beginning it was a spectroscopic technique among othersused mostly for structure identification in organic chemistry, even thoughgradient technique8 and the NMR of biological samples9 were in fact testedvery early. The major difference compared to other kinds of spectroscopy isthat the sample being studied must be positioned in a very strong magnet field,in the order of one Tesla 10,000 Gauss. This is more than ten thousand timesthe strength of the magnetic field of the Earth, which is about 0.5 Gauss.However, because of the need for an extremely homogeneous magnetic field, inthe order of 10 ppm, and even better for high-resolution NMR spectroscopy,the instrument must be shielded from all kinds of external magnetic fields andelectromagnetic radiation.With the introduction of pulsed RF-technique (instead of the earliercontinuous wave) in combination with computerized Fourier transformation,FT10 in the beginning of the seventies, NMR took a giant step forward makingmany new applications available. The next almost simultaneous major step wasthe utilization of super conducting magnets11, which can create magneticfields that are a magnitude higher than ordinary resistive coils. NMRinstruments with magnetic fields of more than 20 Tesla (T) are nowcommercially available. The stronger the magnetic field the higher thefrequency of the RF-pulse. The proportionality factor is called the gyromagnetic ratio, which is γ 42.58 MHz/T for protons. Therefore the NMRinstruments are often labeled 200 MHz or 800 MHz etc, showing the resonanceradio frequency, which they use for proton NMR spectroscopy. For humanimaging however, magnetic fields in the order of 0.1–4 T are commonly used12.This means that the RF-pulses will have frequencies up to about 170 MHz –5
not far from commercial TV and FM radio stations, which can interfere withthe imaging and vice versa.Table 1 Some biologically important 39K40Ca43CaXenon189XeNaturalSpinabundanceI%Nuclear Gyromagneticmoment* ratio, γ #µNMHz/T99.9850.0151.38 –2.869711.8604* The nuclear moment µ, is expressed as the number of nuclear magnetons,µN, where µN eh/2 mp 5.050783 10–27 J/T. Nuclei with spin, I 1/2also possess quadrupole moment, which make them less useful for MRIstudies.# The gyromagnetic ratio γ, is the radio frequency at which the nucleus absorbsenergy in a magnetic field of 1 Tesla.Today NMR is probably the most versatile of all spectroscopic techniques witha very rapidly growing use in biochemistry, biology, and even in medicine,despite the fact that the instruments are still rather large and expensive. NMR isno longer limited to hydrogen. Also carbon, in the form of the rare nuclidecarbon-13, fluorine, phosphorus, and several other elements (with magneticnuclei, i.e. nuclei with spin, I 0) are now easily available for routine study.6
However, in MRI still almost only hydrogen is utilized. In special cases one canmake use of Phosphorous-3114 or of Fluorine-1915, Helium-3 and Xenon-189(see section 5.1), which do not occur naturally in humans.1.3SpectroscopySpectroscopic techniques exist in many shapes. The best knowns are absorptionand emission spectroscopy. In the first kind electromagnetic radiation ofvarious wavelengths (frequencies) is continuously directed towards a sample,where some wavelengths are attenuated more than others. Commonly UV-,VIS- or IR-wavelengths are utilized. The absorbed energy lifts some moleculesinto a higher energy state. They get excited. However, they immediately deexcite again, resulting in a steady state concentration during irradiation. Thetransmitted wavelength pattern can be used for analytical purposes – bothquantitative and qualitative. Also X-ray imaging works in approximately thisway and continuous wave NMR, which was used before about 1970.In emission spectroscopy the sample is heated or energized with an electricaldischarge or in some other way – also here more or less continuously. Somemolecules get excited and when they de-excite, they emit their excess energy inthe form of electromagnetic radiation. The wavelength pattern of this emittedradiation can be measured and analyzed in much the same way as in absorptionspectroscopy. In fact, a molecule, which can absorb radiation of a certainwavelength, can usually emit the same wavelength after being excited.Fluorescence spectroscopy is a combination of absorption and emission. Thesample is continuously irradiated, but only with one wavelength, which isabsorbed by the compound being studied. Other compounds will be very littleaffected. The absorbed electromagnetic energy makes some of the moleculesexcited. They quickly re-emit their excess energy as electromagnetic radiation,which again is measured and analyzed. Where this technique can be used, it isusually both sensitive and very selective.All the spectroscopic varieties discussed in the above paragraphs are based onthe fact that excited molecules relax very fast, i.e. they return almostinstantaneously to their energy ground states. This takes usually only about 10–8seconds, even if there are examples from fluorescence, where the relaxation can7
last much longer, for even seconds and more. Then one usually talks aboutphosphorescence. In most spectroscopy however, the very fast ongoingexcitation – de-excitation process results in a steady state situation with veryfew excited molecules, which is stable throughout the whole analyticalprocedure.NMR and MRI are based on a quite different principle. As in fluorescencespectroscopy the sample is energized with electromagnetic radiation. However,in NMR the radiation is sent into the sample from a RF-emitter as one or morevery short pulses of linearly polarized radio waves of a suitable single (almost)frequency. These pulses last less than a tenth of a millisecond. Hydrogen nucleiin the sample get excited into their higher energy state from which they beginto relax back to the ground state. But they do so without emitting anyradiation. This process is many magnitudes slower compared to most otherrelaxation processes mentioned earlier. It takes usually from milliseconds up toseveral seconds – depending on the chemical and magnetic environment of theprotons – before the sample is back into its ground state again. During therelaxation process however, the excited protons will induce a weak RF-signal ina suitably positioned detector coil, which can be the same as the emitter, a socalled volume coil. However, in most cases specially designed detection coilsare used as surface coils or array coils. This RF-signal, the so-called freeinduction decay, FID, contains all the information that can be extracted fromthe system studied. As the RF-wavelength is about five meters, no image can bedirectly projected. It has to be reconstructed using the information in the FID.The pulse technique makes it possible to vary the excitation situation in analmost unlimited number of ways and thus to get much more information fromthe system than with other spectroscopic alternatives.2Spatial InformationIn imaging the most important thing besides measuring the signal amplitude isto know from where in the test object the signal originates. For this themagnetic resonance procedure is superior as it can give rise to threedimensional images in situations where most other techniques can show onlytwo. This is achieved because the RF-pulses excite exclusively hydrogen atomsthat are at resonance, i.e., which feel exactly the right magnetic field andtherefore oscillate with the same frequency as the radio waves. To get spatialinformation the magnetic field is varied linearly through the test object with the8
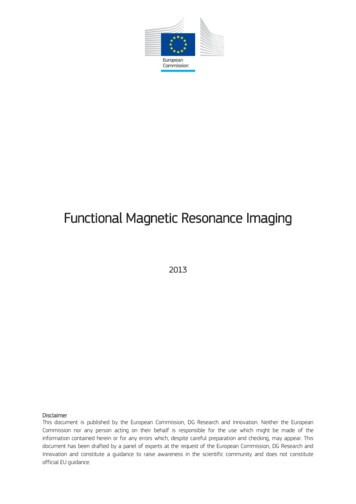
aid of magnetic field gradients16 in three dimensions. These gradients areactive only during short and different parts of the scanning procedure. Thisplaces great demands on the electronic system of the MRI instrument, whichvery quickly has to switch on and off strong electric currents with highprecision. Rising and declining magnetic gradients will also make a lot of noise,which can be very disturbing and even harmful12.2.1Magnetic GradientsThe gradients divide the object studied into a great number of volumeelements, called voxels, each of which has a volume of about one cubicmillimeter or less. Every voxel gives rise to one signal with a unique amplitude.Calculating the amplitudes of all these signals and their space coordinates in thestudied body is more or less what MRI is about. However, all the millions ofvoxel signals are added together and the MRI instrument can only monitor theirsum. Thus one must utilize a scanning procedure and acquire a large number ofaggregated signals during a series of consecutive experiments. These signals areFourier-transformed and used to build an image of the object with a spatialresolution equal to the voxel volume. The three-dimensional image can bepresented as a 3D illusion, which may be turned and twisted, but more often asa series of two-dimensional images. The plane for these can usually be freelychosen.When imaging a patient the main magnetic field of a few Tesla (up to 8 T isallowed by FDA12) will in most cases run along the lying body (see figure 1).This is by convention the longitudinal z-direction, even if it is often drawnvertically. A magnetic gradient (G) of about 5 mT/m (0.5 Gauss/cm) isswitched on in this direction for a short moment (τ), about 10 ms (followed bya reverse gradient for half the time to compensate for the phase shiftintroduced). Halfway into the magnetic gradient a RF-pulse is sent into thebody. It should have a duration of much less than one millisecond and containonly a narrow band of closely lying frequencies around the desired one. TheRF-pulse excites protons within a thin axial cross-section of the body, i.e. in anaxial slice with a thickness of about one millimeter or less17. After the pulseonly the excited protons will relax and induce a sinusoidal signal with graduallydecaying amplitude in the receiving coil. This signal is the free induction decay,the FID (see figure 15). A shallower gradient or a broader frequency band will9
result in a thicker slice, i.e. lower resolution. The slice thickness, d, can beapproximately calculated by equation (1).d (γ G τ)–1 0,5 mm, with figures in the paragraph abovewhere the gyromagnetic ratio for protons is, γ table 1.42.58 106(1)Hz/T, according toyzTray for patientFigure 1Coils creating a homogenous horizontal magnetic field along the z-axis.On the periphery of the big coils are smaller so-called saddle coils (seefigure 2), which create magnetic gradients in the x- and y-directionsFigure 2Pair-wise arrangement of saddle coils within the main ones for creatingmagnetic gradients in the x- and y-directions. For the z-gradient there areadditional coils concentric with the main ones.2.2Three Dimensional EncodingInformation from the two other dimensions can be extracted with so calledphase and frequency decoding18. This is because the frequency of thesinusoidal radio signal depends on the strength of the magnetic field in a waythat will be described later – the stronger the field the higher the frequency.However, as all excited protons experience (almost) the same magnetic field10
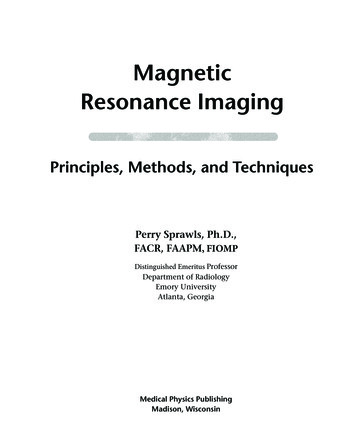
they will also create a coherent radio signal with (almost) a single frequency. If,when the relaxation process has started, another magnetic gradient is switchedon along the y-axis, perpendicular to the first one, protons at different levels ofthe axial slice will oscillate with different speeds. Thus, when the gradient isswitched off again, the signals from the front side of the body will be slightlyahead of those from the rear side (or opposite). They will have differentphases, when the read-out starts. These phases describe how far from the frontof the body the signal comes. Usually 128 or 256 phase encoding gradients withincreasing steepness are used.During read-out a third gradient along the x-axis – perpendicular to the othertwo – is switched on. Then signals from the left and right sides of the body willhave different frequencies and can be distinguished from one another with theaid of a Fourier transform of the FID signal19. Even here the axis is digitizedinto 128 or 256 steps for every step of the phase encoding gradient. In this wayimaging of several axial slices can be made – one after the other. However, it isequally possible to create images of coronal or sagittal slices or in any desireddirection and even curved slices by the proper choice of magnetic gradientsequences. In fact most slices are slightly curved as it is almost impossible tomake the magnetic field perfectly homogenous.yPhase encoding directionzxFrequency encoding directionFigure 3Slice with 16x16 voxels. After phase and during frequency encodingvoxels in the x-direction have signals with different frequencies andalong the y-axis they have different phases. Thus every voxel shows aunique frequency-phase combination.11
Depending on the desired resolution a single slice may consist of 256x256 65,536 voxels. To calculate the signal amplitudes from all these voxels oneneeds to solve at least an equal number of equations, thus the great number ofmagnetic gradients. Every signal the detection coil picks up is a sum of signalsfrom all voxels with different space-related frequencies, phases andamplitudes. It must be sampled with at least twice the signal frequency20; i.e. atabout 200 MHz. During a 100 µs readout this will result in some 20,000 datapoints (times 256 read-out cycles). The sampled data belong to the spatialfrequency domain (inverted distance) and are stored in the computer in an arraycalled k-space. Every line in k-space holds the data sampled after one phaseencoding gradient. However, there is no direct connection between the cells ink-space and the voxels of the object. Instead the spatial frequency domaindata in k-space must be two-dimensionally Fourier transformed into the realspace domain. These data can be converted into an image of the object, asevery combination of frequency and phase is related to a single point in space,to a single voxel. In reality the situation is slightly more complicated as thedetection coils have different sensitivities in different directions and distancesand because the signal will often decay during read-out etc. Corrections forsuch things are built into the standard sampling routines. There are also otherways to sample the data.The image produced will consist of a large number of points with variousamplitudes, which usually are presented as different shades of gray oroccasionally color-coded. It is important to understand that this is not a pictureof the examined object. It is a coded image, which has to be interpreted by anexperienced user. Primarily the amplitudes reflect the number of mobile andfairly loosely bound (water and fat) protons in the voxel where the signaloriginates. However, as most biological tissues have similar proton (hydrogen)densities (see table 2, which shows average values as the literature is notconsistent), the contrast in such an image is not as good as desired. To enhancethe contrast one can use the fact that hydrogen atoms in various chemicalenvironments have a broad range of different relaxation speeds. This can beused in an almost unlimited number of ways to create images with lots ofinformation. One example of this has already been mentioned. Because of veryshort relaxation time for hydrogen atoms in bone tissue, these will already haverelaxed when the read-out procedure starts. Thus bone will give a very weaksignal in contrast to soft tissue. Also the lungs will give weak signals because oftheir very low content of protons (and other nuclei). On the other hand, tumors12
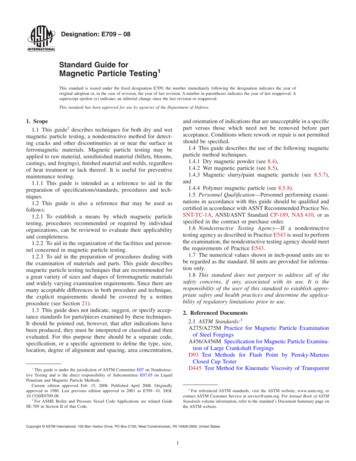
are often vascular and thus give rise to rather strong signals.Table 2 Relative effective mobile hydrogen densities of some tissues21BloodBoneCerebrospinal fluidFatGray matter93129688843Theory3.1The Larmor Fr equencyLiverLungMuscleWhite matterWater8158270100Even a very small piece of biological tissue contains billions of billions ofhydrogen atoms. Actually 1 cm3 of any organ contains more than 1022hydrogen atoms. The nuclei of hydrogen atoms – the protons – act as smallcompass magnets, which normally have a totally random orientation and equalenergy. For every magnet pointing in an arbitrary direction there is another onepointing in the opposite direction. Thus they average out the magneticmoments of one another and no external magnetic effect is seen.Figure 4Protons in no external field, symbolized by magnets pointing in randomdirectionsHowever, if one places a sample containing hydrogen in a magnetic field, B0, anew situation arises. The magnetic field defines a direction in space, which byconvention is the longitudinal z-axis. The magnetic moments of the protonsline up along this axis, half of them parallel to the field (as compasses) and theother half (almost) anti-parallel to the field. The protons with magnetic vectorsparallel to the field (mI 1/2) will have a slightly lower energy than the others(mI –1/2) and because of this, there is a small but very important differencein population between the two energy levels. Thus, the magnets no longercancel out exactly. At equilibrium a small net magnetization is left along the13
positive z-axis. This is called the net magnetization vector, the NMV, oftensymbolized by Mz (see figure 5). In the xy-plane the magnetic moments of theprotons still cancel out. The magnitude of Mz and accordingly, the amplitudeof the MR-signal are proportional to the proton density, the external magneticfield, and to the square of the gyromagnetic ratio, γ. This has resulted in a movetowards ever-higher fields.EzMzmI - 12Net magnetization vectory!E ImI 12xB0Figure 5Net magnetization ofprotons in an external fieldFigure 6The energy difference, EI,depends on the magneticfield, B0The energy difference between the two levels can be calculated by means ofequation (2). E h γ B0(2)In this formula h is Planck’s constant, h 6.626 10-34 Js, and γ the gyromagnetic ratio for protons (see table 1). With B0 1 Tesla the energydifference is E 2.821 10-26 J, which is a very small energy indeed.Nevertheless, it is the energy needed to “lift” or excite protons from their lowerenergy level to their higher one. This can be done with the aid of electromagnetic radiation of a suitable frequency, ƒ, which must have photon energyof ε according to equation (3). The photon energy and the energy difference, E, between the two proton levels must equalize for resonance to occur.ε h ƒ E(3)ƒ γ B0(4)As can be seen in equations (2) and (4) both E and ƒ are linearly dependenton B0. At a magnetic field of 1 Tesla the resonance frequency, is ƒ 42.58MHz. This is called the Larmor frequency, ƒL. The Larmor frequency shouldbe compared to FM radio, which uses frequencies around 100 MHz, and14
television, which broadcasts between 50 and 90 MHz and from 200 MHz andup, i.e. in the same range as MRI.In most other spectroscopic techniques the energy difference is much larger,leaving the higher energy level virtually unpopulated. This is not at all the casein NMR. The population ratio between the two levels can be calculated withBoltzmann’s distribution law, equation (5), where Boltzmann’s constant is k 1.381 10-23 J/K.Nlow/Nhigh exp (- E/kT)(5)Here the indices refer to the parallel and the anti-parallel states respectively. Atbody temperature, i.e. at T 37 C 310 K and a field of 1 Tesla one getsNlow/Nhigh 1.000007. This means that per one million protons in the higherenergy state there are one million and seven in the lower state, i.e. an excess ofonly about 7 ppm. Nevertheless, this small excess is what
Magnetic Resonance Imaging or MRI is a modern diagnostic technique for acquiring information from the interior of a body. Usually this is a human body or an animal, but MRI is also used in the industry for more technical purposes. The greatest advantage of MRI