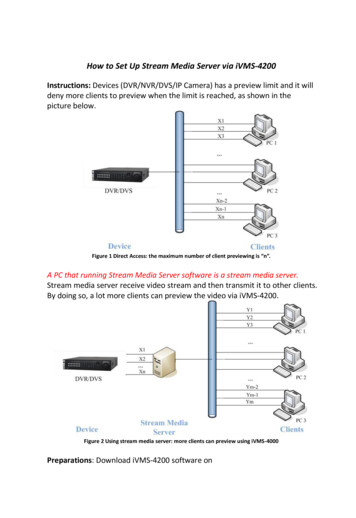
Transcription
Stream Functions PyramidWill Harman, PGwww.stream‐mechanics.com
We are at a 2nd CrossroadCrossroad # 1Traditional Channel DesignTransport water quickly; Bed andbanks don’t movegNatural Channel DesignCreate a dimension, pattern, andprofile that transports water andsediment.
Crossroad # 2Restoration ofDimension, Pattern, andP filProfileRestoration of Functions
What is a Stream Function?“The physical, chemical, and biologicalprocesses that occur in ecosystems,ecosystems ” CleanWater Act (33 CFR 332.2; 40 CFR 230.92)“ The processes that create and support ayEPA Regiong10stream system.“
Stream Function and Structure Structural measures evaluate stream conditionat a point in time– Channel Form, Habitat Features, Number ofSpecies– Describes “How the System Is.” Functional Attributes describe processes andrates (per unit time)– Describes how the system is performingSource: Palmer and Bernhardt, 2009
Why do we need the Pyramid? So we don’t incentivize this result and we think about whatwe’re trying to achieve.
So we don’tdon t miss keyfunctions and processesduringg the designgprocess.
SoS we ddon’t’t dod thithis!!
Why are we struggling with success? WeW don’td ’ askk why.h– We don’t link functional lift to functional loss. Because we don’td ’ focusfon whath functionsfcanbe improved and how to restore thosefunctions.functions We don’t align the site selection with thefunctional goals.goals– We’re not going to fully restore biological functionswith severely degraded watersheds and patchworkrestoration.
So, what do we do?How can we use the Pyramid to help?To Create Better: Goals and Objectives Function‐Based Assessment Protocols SOP’sSOP s– Debit and Credit Determination Methods– Success Criteria– Performance Standards
To Create Better Goals and Objectives Common Goal– Create a stable dimension,, ppattern and pprofile so that thechannel doesn’t aggrade or degrade Better Goal– Reduce sediment supply to improve native fish populations: Restore floodplain connectivity, Reduce streambank erosion,erosionObjectives Improve bedform diversity, and Establish a riparian buffer.
Functional Drivers forC and E Stream Types Floodplain ConnectivityBedform DiversityStreambank Erosion ((Lateral Stability)y)Riparian BufferSite SelectionRequiresAppropriate Watershed Condition.Adequate hydrology functions.Reach scale versus watershed scaleunderstanding.
Quantitative Objectives Floodplain Connectivity– Reduce bank height ratios from 2.0 to 1.0.– Increase entrenchment ratio from 1.2 to 3.0. Bedform Diversity– Convert riffle dominated bedform (95% riffle)to riffle‐pool sequence (70/30). Streambank erosion– ReduceR derosioni rates bby 95%.95%– Reduce erosion rates to reference reach condition. Riparian Buffer– Increase buffer width from 0 feet to 50 feet.
Framework for Function‐BasedAssessments Functional Assessments– FocusFon parameterst listedli t d ini pyramidid– Acknowledge the hierarchy– Tailorl to ddifferentffregions
Assessments for Different Reasons Mitigation Related Departure from Stability and RestorationPotential Watershed Management and Planning
Assessments for Different Reasons Mitigation Related– Assess lost functions at permitted impact site– Assess functional lift at mitigation site– Basis for credit determination and performancep
Assessments for Different Reasons Departure from Stability and RestorationPotential– Hydrologic Changes– Geomorphic Assessments– Physiochemicalyand BiologicalgHealth– Restoration Potential Watershed Management and Planning
Assessments for Different Reasons Watershed Management and Planning– Watershed scale– ID healthyy sub‐watersheds– ID unhealthy sub‐watersheds / reaches and thestressor– Develop management plan to restore functions Use all appropriate tools, like restoration, BMPs,preservation, etc.
Framework for Mitigation SOPs SOPs– MoveMffrom restorationt ti off didimension,ipattern,ttanddprofile to functions.– Better link between impact site and mitigationsite.– Applies to: Debit and Credit Determination Methods Functional Assessment Performance Standards
Rural Piedmont: South Fork Mitchell RiverDarnell / Harman Reach Not a mitigation project Funded by the NC Clean Water ManagementTrust Fund Mitchell River Watershed Coalition and SurrySoil and Water Conservation District Watershed scale effort Designg byy Michael Baker Corporationp
Pre‐Restoration ConditionWidespreadWiddbbankk erosioniChannel is re‐adjusting pattern
Pre‐Restoration ConditionStreamTypeFeatureRiffleBKF Area76BKF WidthBKF DepthMax BKFDepthW/DBH RatioERBKF ElevTOB Elev27.772.744.1610.151.5 357.2087.8489.95Cross-section 7 50Elevaation (ft)11010510095908580600650700Station (ft)Moderately Incised. BHR 1.5750800850BankfullFloodprone
Pre‐Restoration ProfileSouth Fork Mitchell River - Longitudinal NCH8378100300500700900Station110013001500
Functional Lift HydrologyH d liHydraulicGeomorphicPhysiochemicalBiological
Hydrology No lift– No change in rainfall / runoff relationship– No changeg in designg dischargeg (bankfull)()– No change in flow duration
Hydraulics Floodplain Connectivity– Bank Height Ratio reduced from 1.51 5 to 1.010– Entrenchment ratio did not change Flow Dynamics– Reduced average channel velocities– Reducedd d shearhstress ffrom 0.85 to 0.67 lbs/sqftlb / f– Reduced stream power
ExistinggReferenceDesigngFloodplain ConnectivityBeforeAfter
Floodplain ConnectivityDarnell Reach Post Construction 20032003, 20042004, 20052005, 20062006, 2007Cross-section 9 45 -- Riffle949290Elevation (ft)E888684828001/27/2003203/26/2004406080Distance (ft)3/22/20053/29/20061002/27/2007120Bankfull
Geomorphic Sediment Transport Competency– Reduced average depth from 3.43 4 to 2.525– As‐built depth matches required depth SedimentS diTTransport CCapacityi– Not quantitatively assessed
Geomorphic Channel Evolution– Pre‐restoration condition E moving towards a Gc – F – C –E– Restored to a C/E/
Geomorphic Lateral Stability– Did not do before and after BEHI assessments,,which could be used for functional lift– Used cross section surveysy to show lateral stabilityyafter restoration construction.
Lateral StabilityDarnell Reach Post ConstructionCross-section 3 90 -- Pool9492Elevation (fft)9088868482800201/27/2003403/26/200460Distance (ft)3/22/2005803/29/20061002/27/2007120Bankfull
Bed Form Diversity Percent Riffle and Pool PoolP lDDepthh VariabilityV i bili Substrate Distributions
RRosgenPPriorityi i 1
Profile Design949290Bankfull88Bankfull &TOB868482807876020040060080010001200140016001800
Profilefil AfterAf Restorationi
Percent Riffle and PoolBed FormBefore RestorationPercentageYear 5 RestorationPercentageRiffle5146Pool4954
Cross Vane Too HighgDownstream Cross VaneUpstream Riffle
Substrate VariabilityDarnell Reach Wide Sediment Distribution 2002-200710090Darnell 2003Cumulaative Percent80Darnell 20047060Darnell 200550Darnell 20064030Darnell 20072002002 B/4 Restoration1000.010.1110Particles Finer Than (mm)100100010000
Pre and Post Beaver DamSummer 2008Winter 2008
Physiochemical Functional Lift Not measured– DO– Temperature– pH– Conductivity– Nutrients Discussion
BiologicalgFunctional Lift Primary Production – not measured Macroinvertebrate Communities– Ken Bridle, Ecologic Fish Communities– Stamper Aquatics Riparian Communities
Macroinvertebrate CommunitiesTotal Number of wnstream394835Total Number of 49286Downstream186294362184
Fish Communities
Volunteer Monitoring 2007‐8
Riparian Communities
Riparian Communities
Wetland Communities
Volunteer Wetland Monitoring
Fun for the whole family
Mountain Stream ExampleMitchell RiverRiver, Mickey Reach Drainage Area 0.45 square milesChannel Slope 3.5%Bankfull Discharge 55 cfsBankfull Cross Sectional Area 14 ft²D50 31 mm (Coarse(gravel))Rosgen Stream Type B4Design by Michael Baker Corporation
Existing Condition
Before Restoration ProfileMickey Reach Profile ChartTW500LTOBRTOB495WSRBKFLBKFElevation (ft)4904854807 pools out of 3,300 feet of channel47547010001100120013001400Station (ft)150016001700
Before20042005
2009 PhotosPh t
Pool to Pool Spacing / Bankfull Widthandd TTotalt lNNumberb off PPoolslYearMinMaxTotal #20021 1007Existing Condition200321629As‐built Condition2005050.595320060.595020070.6848
Lower end of project
Riparian Buffer
Functional Summary Improved floodprone area connection in lowerreach.– Converted G to B Improved bed form diversity– 7 pools to 50 pools– Maintained pool to pool spacing Improved wetland / bog Created riparian buffer
Thank You
Why are we struggling with success? We d'don't ask why. - We don't link functional lift to functional loss. Because we d'don't focus on what functions can be improved and how to restore those functions. We don't align the site selection with the functional goals.