Transcription
ntentsSummary . 1Introduction . 31: Americans’ Retirement Well-Being Has Improved over Time . 52: Access to and Participation in Retirement Plans Are Both Strong . 83: Defined Contribution Plans Can Produce Meaningful Retirement Benefits . 94: The 401(k) Is a Good Fit for America’s Mobile Workforce . 125: Americans Report High Levels of Confidence in the 401(k) System . 146: Retirement Plan Contributions Are Tax-Deferred—Not Tax-Free . 187: Retirement Assets Constitute a Major Share of U.S. Household Savings and Investments. 248: Innovation and Incentives Improve Retirement Security . 26Acknowledgement: This paper was prepared by the staffs of the American Benefits Council, the American Councilof Life Insurers, and the Investment Company Institute, based on a draft written by Robert Stowe England.
SummaryThe U.S. retirement system has many components: Social Security provides a strong base,complemented by employer-sponsored retirement plans, IRAs, annuities, homeownership, andother savings. A growing component of that system is employer-sponsored defined contributionarrangements, such as 401(k) plans. These plans are popular and successful with employees andemployers. With consistent contributions over time, defined contribution plans can generatesubstantial retirement benefits, especially when combined with Social Security. This reportbrings to bear the most recent statistical data and the results of rigorous academic research toclearly illustrate:1. Americans’ retirement well-being has improved over time, as successive generations ofretirees have been better off than previous generations.2. Access to and participation in retirement plans are both strong, with almost 80% of fulltime workers having access to employer-sponsored retirement plans, and more than 80% ofworkers with access to plans participating. With further refinements, coverage could beincreased to benefit other workers as well.3. Defined contribution plans can produce meaningful retirement benefits, as evidenced byaccount balances that reflect combined 401(k) and IRA assets accumulated over a fullworking career. Near-retirees (age 60–64) have on average nearly 360,000 in their definedcontribution accounts and IRAs combined.4. The 401(k) is a good fit for America’s mobile workforce, in which workers tend to movefrom job to job, because these plans are portable. When employees accumulate savings inworkplace retirement plans like the 401(k), those assets grow with them when they changejobs.5. Americans report high levels of confidence in the 401(k) system—despite recent marketturmoil—and appreciate its many user-friendly features including the tax benefits, theconvenience of payroll deduction, their control over their own assets, and the choice ofdistribution options.6. Retirement plan contributions are tax-deferred, not tax-free, meaning that efforts to raisemoney by reducing tax incentives for retirement plans are short-sighted and illusory—andcould ultimately decrease retirement savings, especially for low-income workers.7. Retirement assets constitute a major share of U.S. households’ savings and investments,providing more than 20 trillion ( 5.3 trillion from defined contribution plans alone) inprivate investment capital for American businesses.8. Innovation and incentives improve retirement security, as demonstrated by initiatives thatare well under way (such as automatic enrollment, automatic escalation, and MERICANSUCCESSSTORY1
The evidence is compelling: the current retirement savings system is fostering economicsecurity in retirement for Americans across all income levels. Defined contribution plans havegrown in importance in U.S. retirement accumulations, rising to be a key component of thevoluntary, private-sector employer-sponsored system. Defined contribution plans, which offerworkers a portable benefit that grows throughout their careers, are a flexible platform for furtherinnovation and improvement. Defined contribution plans are not just “working,” they are ESSSTORY
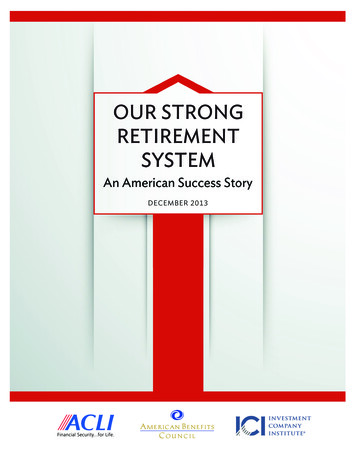
IntroductionThe accomplishments of the retirement system in the United States do not receive enoughattention. For this reason, it is critical that we take a closer look.This report delves into the evidence from data, studies and surveys that explain how theretirement system contributes to the retirement security of Americans. The report alsodemonstrates that the ability of the retirement system to provide resources during retirement hasimproved over the past two decades.Defined contribution (DC) plans have become the dominant private-sector retirement savingsvehicle in the United States.1 This paper will demonstrate how these voluntary, employersponsored arrangements are helping Americans prepare for retirement. Furthermore, whileworkers retiring today have not had full careers with DC plans as their primary retirement plan, anumber of studies demonstrate that DC plans will provide significant resources during retirementfor the nation’s workers.There are several key strengths that characterize the nation’s retirement system, which can beenvisioned as a “pyramid” composed of many components (see figure below). The five broadcomponents of the retirement resource pyramid are Social Security; homeownership; employersponsored retirement plans, both private-sector employer and government employer plans, aswell as both defined benefit (DB) and DC plans; individual retirement accounts (IRAs),including rollovers; and other assets. This paper primarily focuses on the important role thatemployer-sponsored plans play in the nation’s retirement system.1Broadly, there are two types of employer-sponsored retirement plan designs, defined benefit (DB) and definedcontribution (DC). A DB plan is an employer-sponsored pension plan where the amount of future benefits anemployee will receive from the plan is defined, typically by a formula based on salary history and years of service.The amount of contributions the employer is required to make will depend on the investment returns experienced bythe plan and the benefits promised. A DC plan is an employer-sponsored retirement plan, such as a 401(k) plan or a403(b) plan, in which contributions are made to individual participant accounts. Depending on the type of DC plan,contributions may be made by the employee, the employer, or both. The employee’s benefits at retirement ortermination of employment are based on the employee and employer contributions and earnings and losses on thosecontributions. For data on trends in private-sector pension plans, see U.S. Department of Labor Employee BenefitsSecurity Administration, Private Pension Plan Bulletin Abstract of 2011 Form 5500 Annual Reports, Version 1.0,June 2013, URSTRONGRETIREMENTSYSTEM:ANAMERICANSUCCESSSTORY3
U.S.RetirementResourcePyramidOther assetsIRAs(including rollovers)Employer-sponsoredretirement plans (DB and DC plans)HomeownershipSocial Security(and Supplemental Security Income)Source: Investment Company Institute; see Brady, Burham, and Holden, The Success of the U.S. Retirement System (December SSTORY
1:Americans’RetirementWell- ‐BeingHasImprovedoverTimeA number of broad measures of retiree well-being indicate that the U.S. retirement system hassuccessfully provided resources for American workers during retirement, and that successivegenerations of retirees have been better off than previous generations. These measures includerising levels of assets earmarked for retirement; measures of retirees’ wealth, income, andconsumption; and studies of workers’ savings for retirement. Other research has examined theretirement preparedness of today’s workers and found evidence of success.Assets specifically earmarked for retirement have increased significantly. As of June 2013,Americans had accumulated 20.9 trillion in assets specifically earmarked for retirement, notincluding the value of Social Security benefits.2 Retirement assets have grown significantlyfaster than inflation or the number of households since 1975, when the Employee RetirementIncome Security Act (ERISA) took effect. In 1975, average retirement assets per U.S. householdwere 27,300 in constant (inflation-adjusted) 2012 dollars.3 By June 2013, they stood at 167,800 (in 2012 dollars)—more than six times higher than in 1975 (see figure below).4More retirees receive income from private-sector retirement plans, and the amount of incomehas risen. Data from the United States Census Bureau’s yearly Current Population Survey showthat in 1975, 21% of retirees (former employees and their spouses) were receiving income fromretirement plans sponsored by a private-sector employer. Among retirees with private-sectorretirement plan income, the median annual income per person in 1975, in 2012 dollars, wasabout 4,800.5 In 2012, by contrast, 32% of retirees were receiving income from private-sectorretirement plans, and the median annual income per person was about 6,300.6Social Security forms a strong foundation for a “pyramid” of retirement resources. SocialSecurity provides retirement income for almost all working Americans, with higher replacementrates for lower-earning households (replacing 70% of lifetime earnings for the lowest-incomequintile and 47% in the second quintile).7Most near-retirement households have resources from employer-sponsored retirement plans.In 2010, 81% of households headed by a worker aged 55 to 64 had accrued DB plan benefits, DCassets, or IRA assets, from either private-sector or government employment-based plans,2Investment Company Institute, “The U.S. Retirement Market, Second Quarter 2013” (September 2013),www.ici.org/info/ret 13 q2 data.xls. Retirement assets include individual retirement accounts (IRAs), DC plans,public and private-sector DB plans, the federal Thrift Savings Plan, and annuity reserves. The total does not includeSocial Security benefits, home equity, or other financial assets not specifically earmarked for retirement.3Peter Brady, Kimberly Burham, and Sarah Holden, The Success of the U.S. Retirement System, Washington, DC,Investment Company Institute, December 2012, Figure 4, p. 11, www.ici.org/pdf/ppr 12 success retirement.pdf.4Update of calculations in Peter Brady, Kimberly Burham, and Sarah Holden, The Success of the U.S. RetirementSystem, Washington, DC, Investment Company Institute, December 2012, Figure 4, p. 11.5Peter Brady and Michael Bogdan, “A Look at Private-Sector Retirement Plan Income After ERISA, 2012,” ICIResearch Perspective, vol. 19, no. 8, October 2013, Figure 7, p. 13, www.ici.org/pdf/per19-08.pdf.6Ibid.7Congressional Budget Office, The Long-Term Projections for Social Security: Additional Information (October2012), Exhibit 10, p. 16, YSTEM:ANAMERICANSUCCESSSTORY5
according to data from the Federal Reserve Board’s Survey of Consumer Finances.8 This figurehas been consistently high since 1989, suggesting that the transition from DB to DC plans hasnot reduced the share of near-retirees with employment-based retirement onstant2012dollars,roundedtonearest 100,end- ‐of- 00020,00027,300019751985199520052013 (June)Chart updated and reprinted with permission from Investment Company Institute (ICI): The Success of the U.S. Retirement System,December 2012, Page 11, Fig. 4Note: “Retirement assets” include annuities, federal pension plans, state and local government pension plans, private defined benefitplans, defined contribution plans, and IRAs.Sources: Investment Company Institute; U.S. Federal Reserve Board; National Association of Government Defined ContributionAdministrators; American Council of Life Insurers; Internal Revenue Service, Statistics of Income Division; U.S. Department ofCommerce, U.S. Census Bureau; U.S. Department of Labor, Bureau of Labor Statistics; and U.S. Department of Labor, EmployeeBenefits Security AdministrationStudies indicate that American workers are reaching appropriate savings goals. Another wayto look at whether or not Americans have saved adequately is to measure to what extent they are“saving optimally.”9 A study published in 2006 looked at measures of retirement well-being of6,322 households obtained from interviews of retirees born between 1931 and 1941 by theHealth and Retirement Study (HRS). Comparing household net worth with the amount eachhousehold needed to save over a life cycle to preserve its living standard and consumption inretirement, the authors found that about 80% of households in the HRS sample had accumulatedas much as or more wealth than their optimal targets.10 A follow-up study in 2008 looked at8Peter Brady, Kimberly Burham, and Sarah Holden, The Success of the U.S. Retirement System, Washington, DC,Investment Company Institute, December 2012, Figure 13, p. 29, www.ici.org/pdf/ppr 12 success retirement.pdf.9John Karl Scholz, Ananth Seshadri, and Surachai Khitatrakun, “Are Americans Saving ‘Optimally’ forRetirement?” NBER Working Paper, No. 10260, National Bureau of Economic Research, February 2004; Alsopublished in Journal of Political Economy 114 (August 2006): ICANSUCCESSSTORY
earlier and subsequent birth cohorts, including early Baby Boomers, and found that “Americansare, by in large [sic], preparing sensibly for retirement.”11The accumulation of retirement assets has improved over time. A University of Wisconsinstudy12 looked at two comprehensive sets of retirement asset and income data13 to compare thewealth accumulated by people who had just received their first Social Security benefit in the1980s with another set of new retirees in the 1990s. Including the value of Social Securitybenefits, a married couple in the 1980s cohort of new retirees had, on average, sufficient wealthto produce a steady annual income of about 34,000 (in 2012 dollars).14 In the 1990s cohort, theaverage married couple’s wealth could produce a steady income stream of about 53,00015 (in2012 dollars)—a 55% real increase.16Workers generally maintain their standard of living when they retire. Analysis of data fromthe Internal Revenue Service’s Statistics of Income Division shows that income from wages,Social Security benefits, employer-sponsored retirement plans, and IRAs, net of taxes andadjusted for inflation, on average remains fairly stable in the year individuals first claim SocialSecurity benefits and for three years thereafter. For three-quarters of these individuals, income inthe year in which they retired equaled 87% or more of their income in the prior year.17The independent academic studies cited above demonstrate that the U.S. retirement systemhas improved over time.11John Karl Scholz and Ananth Seshadri, “Are All Americans Saving ‘Optimally’ for Retirement?” University ofMichigan Retirement Research Center, Working Paper WP 2008-189 pdf/wp189.pdf.12Robert Haveman, Karen Holden, Barbara Wolfe, and Andrei Romanov, “The Sufficiency of Retirement Savings:A Comparison of Two Cohorts of Retired Workers at the Time of Retirement,” Robert M. La Follette School ofPublic Affairs at the University of Wisconsin at Madison, Working Paper, No. 2006-019 (2006).13The earlier set of data comes from the New Beneficiary Survey that linked Social Security records withcomprehensive data on pensions and wealth for a cohort that first received Social Security benefits in 1980 and1981. The later set of data is from the HRS at the University of Michigan and for individuals who retired in the mid1990s.14Haveman et al. (2006), Table 2, p. 36. Net annuitized values updated to 2012 constant dollars by AmericanBenefits Council.15Ibid.16Net annuitized wealth increased by 12,022 in constant 1994 dollars to 34,036 for the 1990s cohort, which is a55% increase over the 22,014 value calculated for the 1980s cohort.17Peter Brady and Kevin Pierce, “Using Panel Tax Data to Examine the Transition to Retirement,” presented at theNational Bureau of Economic Research, November 2011. “Employment-related income” includes wages, SocialSecurity benefits, distributions from pension plans, and ORY7
StrongU.S. employer-sponsored retirement plans offer more than 84 million American workers andtheir families the opportunity to accumulate savings and improve their retirement security.18These plans build upon the foundation of Social Security, which in 2010 had 157 millionparticipating American workers.19According to the U.S. Department of Labor’s Bureau of Labor Statistics, almost 80% of fulltime workers have access to employer-sponsored retirement plans, and more than 80% ofworkers with access to plans participate.20 When one includes all part-time and seasonal workers,68% have access to employer-sponsored retirement plans, and 80% of workers with accessparticipate.21These data demonstrate the powerful reach of the employer-sponsored retirement plansystem. The challenge now is to build on this system so that workers have greater ability andencouragement to accumulate employment-based retirement resources beyond Social Security.Access to and participation in private-sector plans vary by the size of the company. At largercompanies with 500 workers or more, 89% have access to employer-sponsored retirement plans;of those, an impressive 90% participate.22 At companies with fewer than 100 workers, half of allworkers have access to plans; 72% of those offered a plan participate.23As these data show, part-time, temporary and seasonal workers and those at small businessesare somewhat less likely to have access to a retirement plan at work. That does not mean theseworkers are not accruing retirement resources to supplement their Social Security benefits. Manyof these workers have had access to a retirement savings plan at prior employers, have a spouseaccruing retirement benefits at work, will accumulate retirement resources in the future, or cansave in a tax-advantaged IRA.18Bureau of Labor Statistics, Employee Benefits in the United States—March 2013, Press Release, July 17, 2013,www.bls.gov/news.release/pdf/ebs2.pdf. Note: In the civilian workforce 78% of full-time workers have access witha take-up rate of 83%. The civilian data, with both private-sector and state and local government workers, reflectthose who benefit under the current tax system with existing tax incentives.19Social Security Administration, Earnings and Employment Data for Workers Covered Under Social Security andMedicare, by State and County, 2010, Table 1, p. 3,www.ssa.gov/policy/docs/statcomps/eedata sc/2010/table01.html.20Bureau of Labor Statistics, Employee Benefits in the United States—March 2013, Press Release, July 17, 2013,www.bls.gov/news.release/pdf/ebs2.pdf, Table 1, p. 6.21Ibid.22Ibid, p. CCESSSTORY
rementBenefitsThe 401(k) was introduced in the early 1980s. None of today’s retirees or near-retirees has spenta full 40- to 45-year career in the 401(k) era. Even a worker who first participated at thebeginning of his or her working life in the earliest 401(k) plans is still more than a decade awayfrom retirement—and has not enjoyed the full benefits of the many innovations andimprovements reflected in today’s 401(k) plans.Nonetheless, critiques of 401(k) plans and the DC system frequently focus on measures ofthe average or median account balances of today’s workers or for a wide array of households.Missteps commonly made in evaluating 401(k) and DC plan accumulations include: The analyses often highlight average or median account balances for all workers,without considering workers’ income, job tenure, or age.These analyses usually report on account balances in a worker’s current plan. Thus,they do not include DB accruals or retirement assets accumulated in DC plans at priorjobs or assets in IRAs. Nor do they look at other resources a household might have—for example, a spouse’s or partner’s DC balances, DB plans, or IRAs.These analyses do not consider that individuals’ savings goals vary over a lifecycle.Younger workers typically focus on savings for education, for buying and furnishinga home, and for childrearing rather than in ways specifically earmarked forretirement. Measures of retirement preparedness that do not separate 30-year-oldsfrom 55-year-olds are inherently misleading.These analyses judge the retirement account balances while failing to recognize that401(k) plans are a component of people’s retirement resources.Analyzing data on accumulated balances cannot yet reflect the full potential benefit that canbe produced in the 401(k) system.Studies have, in fact, attempted to address these data shortcomings and better assess howwell the 401(k) plan is doing in achieving retirement security. One approach is to look at 401(k)balances for long-tenured workers close to retirement. At year-end 2011, the average balance forparticipants in their 60s with at least 30 years of tenure with the same employer was 208,892,according to an analysis of 401(k) plans by the Employee Benefit Research Institute (EBRI) andthe Investment Company Institute (ICI).24 This compared to an overall average for all 401(k)participants of 58,991.2524Sarah Holden, Jack VanDerhei, Luis Alonso, and Steven Bass, “401(k) Plan Asset Allocation, Account Balances,and Loan Activity in 2011,” ICI Research Perspective, Vol. 18, no. 9, and EBRI Issue Brief, no. 380 (December2012), EMENTSYSTEM:ANAMERICANSUCCESSSTORY9
Other studies attempt to aggregate workers’ assets held in multiple accounts. For example,Fidelity Investments 26 analyzed balances of nearly 1 million investors who have both aworkplace savings plan, such as a 401(k) or 403(b), and an IRA at Fidelity. For investors of allages in this sample, the average combined balance was 225,600 at the end of 2012.27 Averagecombined balances rose by age group from 32,317 for those aged 25 to 29 to 447,751 for thoseaged 70 to 75 (see figure .S.dollars 447,75170-75 397,35865-69 357,19660-64 328,52755-59 259,63750-54 194,59245-49 144,97540-44 103,12435-39 60,66330-34 32,31725-29 0 50,000 100,000 150,000 200,000 250,000 300,000 350,000 400,000 450,000Chart reprinted with permission from Fidelity Investments: Infocgraphic accompanying news release, “Fidelity Retirement SavingsAnalysis Highlights Higher Balances and Contribution Rates of Investors Saving Beyond Workplace Savings Plans,” February 28, 2013Note: This analysis was based on the population of 999,000 individuals who had both IRA and 401(k) (or 403(b)) balances at Fidelity as of12/31/2012. These individuals consist of those actively employed as well as those terminated from their 401(k)/403(b) plan sponsor. Only asubset of these individuals made contributions into their IRAs and/or 401(k)/403(b) plan in 2012. Excluded are individuals in Fidelity’sown employee plans, as well as those in the advisor-sold channel. Additionally, many workplace plan participants presumably have IRAsthat are not serviced by Fidelity, and these balances are not reflected in this analysis.Source: Fidelity Investments 26Fidelity Retirement Savings Analysis Highlights Higher Balances and Contribution Rates of Investors SavingBeyond Workplace Savings Plans, Press Release, February 28, 2013, tion-rates-of-combined-retirement-savings.27This analysis was based on the population of 999,000 individuals who had both IRA and 401(k) (or 403(b))balances at Fidelity as of 12/31/2012. These individuals consist of those actively employed as well as thoseterminated from their 401(k)/403(b) plan sponsor. Only a subset of these individuals made contributions into theirIRAs and/or 401(k)/403(b) plans in 2012. Excluded are individuals in Fidelity’s own employee plans, as well asthose in the advisor-sold channel. Additionally, many workplace plan participants presumably have IRAs that arenot serviced by Fidelity, and these balances are not reflected in this CESSSTORY
Other studies have used simulation models to demonstrate that meaningful benefits can beaccumulated within a 401(k) plan over a full working life. For example, a study in 2002 by EBRIand ICI found that accumulations through 401(k) plans, including balances rolled over into IRAsfrom 401(k) plans, could generate significant income for retirees across all income groups.28The EBRI/ICI study focused on participants who were in their late 20s in the year 2000 andwho would reach age 65 sometime between 2035 and 2039. The EBRI/ICI 401(k) AccumulationProjection Model29 found that 401(k) accumulations would enable those with continuouscoverage in the lowest-earning one-fourth (or quartile) of the participant population to replace51% of their working income in the first year of retirement, not including Social Security.30 Themodel found the replacement rate to be 69% for the highest income quartile.31When assets accumulated in 401(k) plans are combined with estimated Social Securitypayments, together they could provide a replacement rate of 103% for the lowest-earning quartileof 401(k) plan participants and between 83% and 86% for the other income quartiles.32 Evenwhen employees do not have continuous 401(k) coverage and equity returns are assumed to bebelow normal, participants can build up significant accumulations.33A Congressional Research Service study34 in 2007 projected that the median-incomehousehold would have an accumulated retirement savings at age 65 of 468,000 (in 2004dollars).35 That projection is for a married-couple household with median earnings thatcontributed 8% of earnings each year for 30 years (starting at age 35) to an account that wasinvested in a mix of stocks and bonds earning 5.5% a year.36These studies demonstrate that workers can achieve significant accumulated savings in theirworkplace DC plans when they reach retirement age—enough to provide meaningful retirementbenefits.28Sarah Holden and Jack VanDerhei, “Can 401(k) Accumulations Generate Significant Income for FutureRetirees?” Investment Company Institute Perspective, Vol. 8, No. 3, and EBRI Issue Brief, No. 251 (November2002), www.ici.org/pdf/per08-03.pdf.29The model includes 401(k) balances at employer-sponsored plans and rollover IRA balances.30Ibid, Figure 1, p. 3.31Ibid.32Ibid.33Ibid.34Patrick Purcell and Debra B. Whitman, “Retirement Savings: How Much Will Workers Have When TheyRetire?” Congressional Research Service Report for Congress, January 29, 2007, p. 15.35Ibid, Figure 2, p. 17.36If a married-couple household started saving at age 25 and contributed for 40 years, they would be able toaccumulate 844,000 (in 2004 dollars) by age 65. A household that waited until age 45 to start contributing 8% ofincome would still be able to accumulate 213,000 (in 2004 dollars) by age Y11
The dynamism of the economy in the United States naturally means that Americans mayexperience significant job changes over their working lives, as the employer landscape changesover time. New businesses, especially small businesses, often as start-ups, offer most of the netnew jobs in the economy.One vital element of a dynamic economy is a highly active and mobile workforce. TheBureau of Labor Statistics in 2012 found in its National Longitudinal Survey that younger babyboomers held an average of 11 jobs between the ages of 18 and 46 (see figure .1TotalMenWomen1085.565.75.343.0 3.1 2.82.4 2.6 2.32.1 2.1 2.02.1 2.1 2.120TotalAges 18 to 24Ages 25 to 29Ages 30 to 34Ages 35 to 39Ages 40 to 46Note: This table excludes individuals who turned age 18 before January 1, 1978, or who had not yet turned age 47 when interviewed in2010–11. The National Longitudinal Survey of Youth 1979 consists of men and women who were born in the years 1957–64 and wereages 14 to 22 when first interviewed in 1979. These individuals were ages 45 to 53 in 2010–11.Source: Bureau of Labor Statistics, “Number of Jobs, Labor Market Experience, and Earnings Growth: Results from a NationalLongitudinal Survey,” News Release, July 25, 2012, Table 137Bureau of Labor Statistics, “Number of Jobs, Labor Market Experience, and Earnings Growth: Results from aNational Longitudinal Survey,” News Release, July 25, 2012, REMENTSYSTEM:ANAMERICANSUCCESSSTORY
The mobility of the workforce and the dynamic nature of job creation and loss puts apremium on retirement benefits that are portable; that is, benefits tha
envisioned as a "pyramid" composed of many components (see figure below). The five broad components of the retirement resource pyramid are Social Security; homeownership; employer-sponsored retirement plans, both private-sector employer and government employer plans, as