Transcription
Retirement InsightsGuide toRetirement2022
Page referenceRetirement Landscape3. The retirement equation4. Life expectancy probabilities5. Changes in lifestyle6. Older Americans in the workforce7. Managing expectations of ability to work8. Percentage of households with apension9. Social Security timing trade-offs10. Claiming Social Security: decision tree11. Maximizing Social Security benefits:maximum earner12. Social Security benefit avingRetirement savings checkpoints:Household Income 90kRetirement savings checkpoints:Household Income 100kIncome replacement needs vary byhousehold incomeAnnual savings needed if starting today:Household Income 90kAnnual savings needed if starting today:Household Income 100kHistorical annual savings rateBenefit of saving and investing earlyEvaluate a Roth at different life stagesMaximizing an HSA for health .34.35.36.37.38.39.SpendingDiversified sources of retirementfunding“The Prosperous Retirement”:theoretical spending profileChanges in spendingChanges in spending: partially and fullyretired householdsSpending and inflationThe 4% rule: projected outcomes vs.historical experienceDollar cost ravaging: timing risk ofwithdrawalsMitigating dollar cost ravaging:dynamic spendingHealth care costs for retirees before age65Marketplace plan costs usuallyincrease with ageThree steps for Medicare coverage65 and working: should I sign up forMedicare?Rising health care costs in retirement2022 Monthly Medicare surchargesLong-term care planningDisability incidence increases with ageMedian cost of a home health aideLong-term care planning options40.41.42.43.44.2InvestingGoals-based wealth managementStructuring a portfolio in retirement: thebucket strategyStructuring a portfolio to match investorgoals in retirementRetirement profiles by planningoutcomeImpact of being out of the marketDefined Contribution45. Tax implications for retirement savingsby account type46. Prioritizing long-term retirementsavings47. The benefits of auto-escalation48. The toxic effect of loans andwithdrawalsReference49. Traditional IRAs vs. Roth IRAs:2021/202250. Retirement plan contribution anddeferral limits: 2021/202251. A closer look at tax rates: 202252. Disclosures
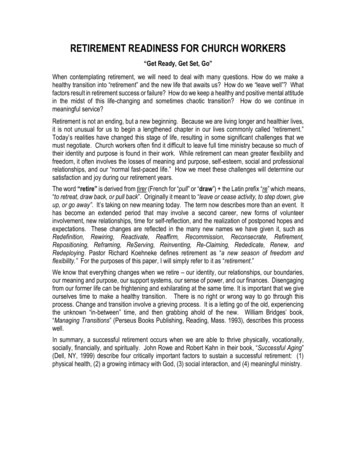
Retirement LandscapeThe retirement equationTOTALCONTROLGTR3A sound retirement planAssetallocationandlocationMake the most of the thingsthat you can control but besure to evaluate factors thatare somewhat or completelyout of your control withinyour comprehensiveretirement plan.MarketreturnsSaving vs.spendingOUT OF gs andbenefitsEmploymentearnings anddurationLongevitySOMECONTROLSource: The Importance of Being Earnest, J.P. Morgan Asset Management, 2013.
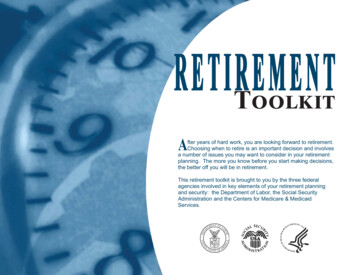
Retirement LandscapeLife expectancy probabilitiesGTRIf you’re age 65 today, the probability of living to a specific age or beyond89%14%80%72%71%60%Plan for longevityAverage life expectancy at age 65100%15% 09089.387.22.130%49% 22%34%25%23%8%0%85 yearsMen90 years24%16% 20%14%18%13%13%14%Average life expectancycontinues to increase and isa mid-point not an endpoint. You may need to planon the probability of livingmuch longer – perhaps 35years in retirement –particularly if you are a nonsmoker in excellent health.Investing a portion of yourportfolio for growth isimportant to maintain yourpurchasing power over time.44%18%44%WomenMen18% 41%56%20%Women52%45%40%Year23%18%20% 6%7%95 yearsCouple – at least one lives to specified age45%10%7% 14%6%1%100 yearsCouple – both live to specified ageNon-smoker in excellent healthSource (chart): Social Security Administration, Period Life Table, 2018 (published in the 2021 OASDI Trustees Report); American Academy ofActuaries and Society of Actuaries, Actuaries Longevity Illustrator, http://www.longevityillustrator.org/ (accessed January 14, 2022), J.P.Morgan Asset Management.Source (table): Social Security Administration 2021 OASDI Trustees Report.Probability at least one member of a same-sex female couple lives to age 95 is 26% and a same-sex male couple is 14%.
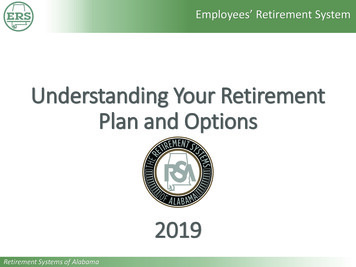
GTRDaily hours spent by activity per age24Hours per dayRetirement LandscapeChanges in lifestyleEating, drinking, personal care & home management16Socializing, leisure, exercise12Spend time planningyour timeOther20Retirement offers the gift oftime to do the things thatmatter most to you.Working84Sleeping050556065Age707580An individual who “PUSHES” tends to age well:Has a senseof PurposePracticesHealthybehaviors5Uses time to work,help others, go toevents and/orparticipate in activitiesExperiencesgratitudeSocializes withfriends & family;spends timewith othersWhile our happiest years maybe in retirement, thetransition isn’t always a walkon the beach. Do yourhomework in advance toknow what you are retiring to,not just what you are retiringfrom.To make the most of yourretirement years, be sure toprioritize what “PUSHES” youto age well.Focuses onStrengthsand abilitiesSource (top chart): Bureau of Labor Statistics American Time Use Survey 2019, J.P. Morgan Asset Management analysis. Values includeindividuals who do and do not participate in the activities. Values are averaged across rolling five-year age groups. Each category includestime spent traveling to and from the activity if applicable.Source (bottom chart): J.P. Morgan Asset Management analysis; PNAS.org, Vol 116, No. 4, Leading a Meaningful Life at Older Ages, January22, 2019, Volume 8, Article 517226; Frontiers in Medicine, Fostering Well-being in the Elderly, April 2021, The Gerontologist Vol. 53, No. 6, 939–949; Perceptions of Successful Aging Among Diverse Elders with Late-Life Disability, December 11, 2012.
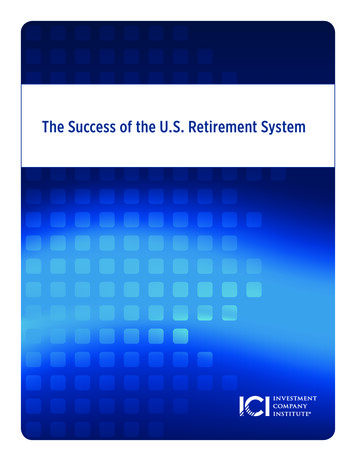
GTRPercentage of people in the civilian labor force 020203033m39m55m72mMore people are workinglater in life, motivated by thedesire to do so.75 0%Total civilianpopulation 65 Major reasons people work in retirementBuy extras27%NeedsAvoid reducing savings / "nest egg"24%Make ends meet17%Decreased savings / investments11%Keep insurance or benefits9%Financially support others5%Stay active and involved52%Enjoy working38%Job opportunity22%Try new career6%0%20%6It’s still off to work I go32%30%WantsRetirement LandscapeOlder Americans in the workforce40%60%Source (top chart): Bureau of Labor Statistics, Employment Projections, Table 3.2 and Table 3.3. Actual data to 2020 and projection to 2030.Civilian population age 65 is non-institutionalized population.Source (bottom chart): Employee Benefit Research Institute, Mathew Greenwald & Associates, Inc., 2021 Retirement Confidence Survey.Latest available data as of December 31, 2021. Individuals may have given more than one answer.
Retirement LandscapeManaging expectations of ability to workExpectations of workers vs. retireesTo retire at age 65 or older70%64%GTRReasons cited for retiring earlierthan plannedHealth problems ordisability60%50%Care for spouse orother family memberEarly Retirement36%Company downsizing/ closing32%11%You may not have completecontrol over when you retire,so you should considerhaving a back-up plan. Youmay have to draw incomeearlier and make yourportfolio last longer than youanticipate.40%Outdated skills7%Other work-relatedreason7%28%30%20%Able to afford earlyretirement10%41%Want to dosomething else0%Current workers'expectationsExperience ofactual retireesMedian retirement age:Expected:Actual:6562Employer offeredincentive to retire earlyCOVID risk0%19%15%5%25%750%Source: Employee Benefit Research Institute, Mathew Greenwald & Associates, Inc., 2021 Retirement Confidence Survey. Individuals mayhave given more than one answer. Latest available data as of December 31, 2021.
Retirement LandscapePercentage of households with a neration Z(Age 21-25)Millennials(Age 26-41)Generation X(Age 42-57)Baby Boomer(Age 58-76)Silent(Age 77 )Source: LIMRA Secure Retirement Institute analysis of 2019 Survey of Consumer Finances, Federal Reserve Board, 2020. Latest availabledata as of December 31, 2021. Age is for head of household in 2022. Percent of households having access to a DB plan denotes either surveyrespondent or spouse: a) has DB pension at current job; b) had accrued a DB pension benefit from a former job but has not yet claimedbenefits; or c) is currently receiving benefits from DB pension. A pension is also referred to as a defined benefit (DB) pension plan.All Households
Retirement LandscapeSocial Security timing trade-offsGTRBenefits differ by birth year and claim ageFull Retirement Age (FRA) 100% benefitBirth year: 1954 or earlierAge 62Decreased benefits75%74.2%Age 70Full Retirement Age: 66Increased benefits100%benefit-6.25% average per yearBirth year: 1955 (current age: 67)73.3%1956 (66)72.5%1957 (65)71.7%1958 (64)70.8%1959 (63) 8% per yearFull Retirement Age: 66 2 months66 4 months66 6 months66 8 months66 10 monthsBirth year: 1960 or laterAge 6270%Full Retirement Age: 67-6.00% average per yearCost of living increase forbenefits received in 20225.9%100%benefit 8% per yearAverage cost of livingadjustment rstand the tradeoffsDeciding when to claimbenefits will have apermanent impact on thebenefit you receive. Claimingbefore your full retirementage can significantly reduceyour benefit, while delayingincreases it.In 2017, full retirement agebegan transitioning from 66to 67 by adding two monthseach year for six years. Thismakes claiming early evenmore of a benefit reduction.Age 70124%2.6%For illustrative purposes only. The Social Security Amendments Act of 1983 increased FRA from 65 to 67 over a 40-year period. The first phaseof transition increased FRA from 65 to 66 for individuals turning 62 between 2000 and 2005. After an 11-year hiatus, the transition from 66 to67 (2017-2022) will complete the move. This material should be regarded as educational information on Social Security and is not intendedto provide specific advice. If you have questions regarding your particular situation, you should contact the Social Security Administrationand/or your legal or tax professional.Source: Social Security Administration, J.P. Morgan Asset Management.
Retirement LandscapeClaiming Social Security: decision treeSTARTHEREDo you have other sources of income?YAgeConsider claimingyour benefit77 Do you expect to livebeyond age 77?NDelay claiming,particularly if youare subject to theearnings test!!NAre youworking?YGTRDo you prefer receiving asmaller benefit earlier vs.waiting for a largerbenefit?Do you want to claim your benefitNYto preserve your investmentportfolio?YNY!Weigh the odds of living to variousages and consider health status &family history of longevityGTR 4: Life expectancyprobabilitiesNConsider takingyour benefit asearly as age 62AgeConsider takingbenefit at FullRetirement Age*AgeConsider waitingto age 70 to takeyour benefitAge62Age81 Do you expect to livebeyond age 81?YYou may want to take your benefit,but understand what you may beleaving on the table at older agesGTR 11: Maximizing SocialSecurity benefits10NEvaluate which claiming age results inthe highest lifetime benefit based onyour expected rate of return and lifeexpectancyGTR 12: Social Security benefitclaiming considerationsSource: Social Security Administration, J.P. Morgan Asset Management. This material should be regarded as educational information onSocial Security and is not intended to provide specific advice. If you have questions regarding your particular situation, you should contactthe Social Security Administration and/or your legal or tax professionals.*Full Retirement Age (FRA) of 67 is for individuals born 1960 or later. This decision tree is also appropriate for other FRAs.6770
Retirement LandscapeMaximizing Social Security benefits: maximum earnerCumulative individual maximum benefit by claim ageFull Retirement Age (FRA) Age 67Breakeven ageFRA/70Claim at 70: 4,159 per month 454k62/FRA 505kClaim at FRA: 3,354 per monthClaim at 62: 2,348 per monthAgeAt age 62,probability ofliving to atleast age:62* 1,622k 749k 1,448kGTRPlanning opportunityDelaying benefits meansincreased Social Securityincome later in life, but yourportfolio may need to bridgethe gap and provide incomeuntil delayed benefits arereceived. 743k 502k 668k %33%100%99%99%94%87%48%11Source: Social Security Administration, J.P. Morgan Asset Management.*Couple assumes at least one lives to the specified age or beyond. Breakeven assumes the same individual, born in 1960, earns themaximum wage base each year ( 147,000 in 2022), retires at the end of age 61 and claims at 62 & 1 month, 67 and 70, respectively. Benefitsare assumed to increase each year based on the Social Security Administration 2021 OASDI Trustee’s Report intermediate estimates(annual benefit increase of 2.4% in 2023 and thereafter). Monthly amounts with the cost of living adjustments (not shown on the chart) are: 3,776 at FRA and 5,027 at age 70. Exact breakeven ages are 76 & 9 months and 80 & 7 months.
GTRComparison of claim age based on an individual’s expected rate of return and longevityColor represents the claim age with the highest expected lifetime benefits10%9%8%6%Consider portfolioreturns and your lifeexpectancy5%4%3%Claim at age 702%1%0%6267707712The lower your expectedlong-term investment returnand the longer your lifeexpectancy, the more it paysto wait to take your benefit.Claim at age 62Claim at age 627%Net of FeesExpected annual rate of returnRetirement LandscapeSocial Security benefit claiming considerations8190100Expected longevityHow to use: Go to the intersection of your expected rate of return and your expected longevity. The color at this intersection represents the Social Security claim age that maximizes total wealth (cumulativeSocial Security benefit and investment portfolio) given three claiming options: age 62, Full Retirement Age (age67) and age 70. Example: For a woman with an expected consistent 5.5% rate of return (net of fees) and life expectancy of 88:consider claiming at age 70.Source (chart): Social Security Administration, J.P. Morgan Asset Management.Source (longevity): Social Security Administration 2021 OASDI Trustees Report.Assumes the same individual, born in 1960, retires at the end of age 61 and claims at 62 & 1 month, 67 and 70, respectively. Benefits areassumed to increase each year based on the Social Security Administration 2021 OASDI Trustee’s Report intermediate estimates (annualbenefit increase of 2.4% in 2023 and thereafter). Analysis is based on an average earner (all earnings profiles yield similar results). Expectedrate of return is deterministic, in nominal terms, and net of fees.
Retirement savings checkpointsHousehold income 90kAnnual savings rate: 5%GTR13Current household income 30,000 40,000Currentage 60,000 70,000 80,000 90,000Model assumptionsAnnual gross savings rate:5%Checkpoint (x current household .11.51.71.90.31.11.41.72.22.42.6Post-retirement portfolio:40/60 diversified portfolio450.71.62.12.43.03.23.5Inflation rate: 2.3%501.12.32.83.23.94.14.5Retirement age:551.73.03.64.14.85.25.6 Primary earner: 65602.23.74.44.95.86.16.7 Spouse: 63652.54.14.95.56.56.97.525Saving 50,00035See “Annualsavingsneeded”on slide 16*4030Pre-retirement portfolio:60/40 diversified portfolioYears in retirement: 35This analysis assumes you would like to maintain an equivalent lifestyle in retirement.Household income is assumed to be gross income (before taxes and savings).How to use: Go to the intersection of your current age and your closest current household income. Multiply your current household income by the checkpoint shown. This is the amount you should have savedtoday, assuming you continue contributions of 5% going forward. Example: For a 40-year-old with a household income of 50,000: 50,000 x 1.4 70,000*Households age 25-35 earning 30k may need to save less than the 5% annual savings rate assumed in this analysis. If they were to save5% annually going forward they would not need to have current assets to be on track. They should refer to the annual savings rate they needto be saving today found on slide 16. This chart is for illustrative purposes only and must not be relied upon to make investment decisions.J.P. Morgan Asset Management’s (JPMAM) model is based on proprietary Long-Term Capital Market Assumptions (first 10 years) andequilibrium returns, and an 80% confidence level. Portfolios are described as equity/bond percentages (e.g., a 40/60 portfolio is 40%equities and 60% bonds). Assumptions include household income replacement rates shown on slide 15. Consult with a financialprofessional for a more personalized assessment. Allocations, assumptions and expected returns are not meant to represent JPMAMperformance. Given the complex risk/reward trade-offs involved, we advise clients to rely on judgment as well as quantitative optimizationapproaches in setting strategic allocations. References to future returns for either asset allocation strategies or asset classes are notpromises or even estimates of actual returns a client portfolio may achieve.
Retirement savings checkpointsHousehold income 100kAnnual savings rate: 10%GTR14Current household income 100,000 125,000SavingCurrentage 150,000 175,000 200,000 250,000 300,000Model assumptionsAnnual gross savings rate:10%Checkpoint (x current household ost-retirement portfolio:40/60 diversified portfolio453.64.34.75.15.45.86.2Inflation rate: 2.3%505.05.86.36.77.17.68.0Retirement age:556.57.58.08.58.99.510.0 Primary earner: 65608.09.19.710.310.811.412.0 Spouse: 63659.310.511.111.812.313.013.7Pre-retirement portfolio:60/40 diversified portfolioYears in retirement: 35This analysis assumes you would like to maintain an equivalent lifestyle in retirement.Household income is assumed to be gross income (before taxes and savings).How to use: Go to the intersection of your current age and your closest current household income. Multiply your current household income by the checkpoint shown. This is the amount you should have savedtoday, assuming you continue contributions of 10% going forward. Example: For a 40-year-old with a household income of 100,000: 100,000 x 2.5 250,000This chart is for illustrative purposes only and must not be relied upon to make investment decisions. J.P. Morgan Asset Management’s(JPMAM) model is based on a blend of proprietary Long-Term Capital Market Assumptions (first 10 years) and equilibrium returns, and an80% confidence level. Portfolios are described as equity/bond percentages (e.g., a 40/60 portfolio is 40% equities and 60% bonds).Assumptions include household income replacement rates shown on slide 15. Consult with a financial professional for a more personalizedassessment. Allocations, assumptions and expected returns are not meant to represent JPMAM performance. Given the complexrisk/reward trade-offs involved, we advise clients to rely on judgment as well as quantitative optimization approaches in setting strategicallocations. References to future returns for either asset allocation strategies or asset classes are not promises or even estimates of actualreturns a client portfolio may achieve.
Income replacement needs vary by household incomeGTR15Replacement rate detail by household 2%SavingIncome replacement %25%20%16%80%60%73%66%61%58%55%50%47%44%37%Changes inexpenditures, taxesand pre-retirementsavingsSocial Security benefitAmount required fromprivate and %50%51%53%56%0% 30k 40k 50k 60k 70k 80k 90k 100k 125k 150k 175k 200k 250k 300kPre-retirement incomeSource: J.P. Morgan Asset Management analysis, 2021. Household income replacement rates are derived from an inflation-adjusted analysis of: ConsumerExpenditure Survey (BLS) data (2016-2019) for income and longitudinal Chase data (2013-2020) for spending. Chase data includes internal select data fromJPMorgan Chase Bank, N.A. and its affiliates (collectively “Chase”) including select Chase check, cash, credit and debit card, and electronic paymenttransactions from January 1, 2013 – December 31, 2020. Additional information on J.P. Morgan Asset Management’s data privacy standards available od/insights/retirement-insights/gtr-privdisc/. Social Security benefits uses modified scaledearnings in 2021 for a single wage earner at age 65 and a spousal benefit at age 63. The income replacement needs may be lower for households in which bothspouses are working and the second spouse’s individual benefits are greater than their spousal benefit. Single household income replacement needs may varyas spending is typically less than a two-spouse household; however, the loss of the Social Security spousal benefit may offset the spending reduction.Percentages and values may not sum due to rounding.
Annual savings needed if starting todayHousehold income 90kCurrent household income 30,000 40,000SavingCurrentage 50,000 60,000 70,000GTR16Model assumptions 80,000 90,000Savings rate (x current household income)Pre-retirement portfolio:60/40 diversified portfolioPost-retirement portfolio:40/60 diversified %10%12%13%14%406%10%12%14%16%17%18% Primary earner: 65459%14%17%19%22%23%25% Spouse: 635013%21%25%28%33%35%38%Years in retirement: 35Inflation rate: 2.3%Retirement age:Values assume you would like to maintain an equivalent lifestyle in retirement.Household income is assumed to be gross income (before taxes and savings).How to use: Go to the intersection of your current age and your closest current household income. This is the percentage of your current household income to contribute annually going forward ifyou have 0 saved for retirement today. Example: A 40-year-old with household income of 50,000 and 0 saved for retirement today mayneed to save 12% every year until retirement.This chart is for illustrative purposes only and must not be relied upon to make investment decisions. J.P. Morgan Asset Management’s(JPMAM) model is based on a blend of proprietary Long-Term Capital Market Assumptions (first 10 years) and equilibrium returns, and an80% confidence level. Portfolios are described as equity/bond percentages (e.g., a 40/60 portfolio is 40% equities and 60% bonds).Assumptions include household income replacement rates shown on slide 15. Consult with a financial professional for a more personalizedassessment. Allocations, assumptions and expected returns are not meant to represent JPMAM performance. Given the complexrisk/reward trade-offs involved, we advise clients to rely on judgment as well as quantitative optimization approaches in setting strategicallocations. References to future returns for either asset allocation strategies or asset classes are not promises or even estimates of actualreturns a client portfolio may achieve.
Annual savings needed if starting todayHousehold income 100kCurrent household income 100,000 125,000SavingCurrentage 150,000 175,000 200,000GTR17Model assumptions 250,000 300,000Savings rate (x current household etirement portfolio:60/40 diversified portfolioPost-retirement portfolio:40/60 diversified portfolioInflation rate: 2.3%Retirement age: Primary earner: 65 Spouse: 63Years in retirement: 35Values assume you would like to maintain an equivalent lifestyle in retirement. Household income isassumed to be gross income (before taxes and savings).How to use: Go to the intersection of your current age and your closest current household income. This is the percentage of your current household income to contribute annually going forward ifyou have 0 saved for retirement today. Example: A 40-year-old with household income of 100,000 and 0 saved for retirement today mayneed to save 22% every year until retirement.This chart is for illustrative purposes only and must not be relied upon to make investment decisions. J.P. Morgan Asset Management’s(JPMAM) model is based on a blend of proprietary Long-Term Capital Market Assumptions (first 10 years) and equilibrium returns, and an80% confidence level. Portfolios are described as equity/bond percentages (e.g., a 40/60 portfolio is 40% equities and 60% bonds).Assumptions include household income replacement rates shown on slide 15. Consult with a financial professional for a more personalizedassessment. Allocations, assumptions and expected returns are not meant to represent JPMAM performance. Given the complexrisk/reward trade-offs involved, we advise clients to rely on judgment as well as quantitative optimization approaches in setting strategicallocations. References to future returns for either asset allocation strategies or asset classes are not promises or even estimates of actualreturns a client portfolio may achieve.
Historical annual savings rateGTRPersonal savings rateAnnual, % of gross income16%High inflation 021:11%10%Average: 7.9%8%6%18Beware the wealtheffectDuring economicexpansions when the valueof stocks and homesincrease, Americans tend tosave less than duringrecessions.Government help throughthe pandemic includingstimulus checks andadvance child tax creditpayments boosted savingsrates to levels not seen sincethe 1970s.On average, Americans aresaving well below the 10%15% consistent annualsavings rate required tosuccessfully 9651970197519801969-70 1973-75 1980-82Vietnam Oil Crisis EnergyWar EraCrisis198519901990-91S&L Crisis19952000 0202020GlobalPandemic*Recommended savings rates are based on J.P. Morgan Asset Management’s analysis of median and affluent households.Source: Bureau of Economic Analysis, National Bureau of Economic Research, J.P. Morgan Asset Management, as of December 31, 2021.Personal savings rate is calculated as personal savings (after-tax income minus personal outlays) divided by gross income. Employer andemployee contributions to retirement funds are included in after-tax income but not in personal outlays, and thus are implicitly included inpersonal savings.
Benefit of saving and investing earlyGTRAccount growth of 200 invested/saved monthly 450,000SavingSaving fundamentalsEnding portfolioConsistent Chloe invests fromages 25 to 65 earning 6.25%( 96,000 total) 400,000 420,30077%Late Lyla invests from ages35 to 65 earning 6.25%( 72,000 total) 350,000 250,00066%Nervous Noah saves from ages25 to 65 in cash earning 2.0%( 96,000 total) 200,000Saving early and often, andinvesting what you save, aresome of the keys to asuccessful retirement due tothe power of long-termcompounding. 210,700Quitter Quincy invests fromages 25 to 35 earning 6.25%( 24,000 total) 300,000 209,60089% 147,900 150,00035% 100,000 50,000Investment returnSavings 02530354045Age5055196065The above example is for illustrative purposes only and not indicative of any investment.Source: J.P. Morgan Asset Management, Long-Term Capital Market Assumptions. Compounding is the increasing value of assets due toinvestment return earned on both principal and prior investment gains.
Evaluate a Roth at different life stagesGTRChanges in lifetime taxable incomeTax diversificationHypothetical wage curveManaging taxes over alifetime requires a balance ofyour current and future taxpictures. Make income taxdiversification a priority tohave more flexibility andcontrol in retirement.1Annual taxable income ( )SavingNext tax bracketPre-tax 401(k) /Traditional IRA*Rule: Contributing to aRoth early in your careerand shifting as yourincome increases.RMDsEither / bothR1. Roth 401(k) contributionsin peak earning years ifwealth is concentrated intax-deferred accounts.2Roth 401(k) or IRA20253035402045Working years50Age5560657075802. Proactive Roth conversionsin lower income retirementyears if RMDsare likely to push you intoa higher bracket.Retirement*If eligible to make a deductible contribution (based on your MAGI). The illustration reflects savings options into Traditional and Roth IRAaccounts, as well as into pre-tax and Roth 401(k) accounts. RMD Required Minimum Distributions, which are typically due no later thanApril 1 following the year the owner turns 72 and are calculated every year based on the year-end retirement account value and theowner/plan participant’s life expectancy using the IRS Uniform or Joint Life Expectancy Table. Employer contributions are typically pre-taxand are subject to tax upon distribution.The above example is for illustrative purposes only.Source: J.P. Morgan Asset Management.
Maximizing an HSA for health care expensesHealth Savings Account (HSA) savings are triple tax advantaged121Maximum family contribution with catch-ups, 6.25% return and 24% marginal tax rateMake the most of it 300,000If you are enrolled in aqualified high-deductiblehealth plan and are eligibleto contribute to a HealthSavings Account (HSA), besure to open and fund yourHSA.Ending balance 250,000SavingGTR 242,450 Tax free for qualifiedhealth care expenses in retirement 200,000 36,290 91,230 Tax-deferred earningsSavings from taxdeductions 150,000 100,000 151,220 Contributions withcatch-ups for the last 10 years 50,000Investing your HSAcontributions for the longterm and paying for currenthealth care expenses out ofincome or short-termsavings can providesignificant tax-free funds forhe
42 Sequence of return risk – saving for and spending in retirement 43 Impact of being out of the market Defined Contribution . 44 Tax implications for retirement savings by account type. 45 Prioritizing long-term retirement savings. 46 Maximize your employer match. 47 The benefits of auto