Transcription
A Life-Cycle Analysis of the Greenhouse GasEmissions from Corn-Based EthanolSeptember 5, 2018Prepared forU.S. Department of AgricultureOffice of Energy and Environmental Policy1400 Independence Avenue, SWWashington, DC 20250Prepared byICF1725 I (Eye) StreetWashington, DC 20006
A Life-Cycle Analysis of the Greenhouse Gas Emissionsfrom Corn-Based EthanolICF prepared this final project report under USDA Contract No. AG-3142-D17-0161 in support of the project: Technical Support CommunicatingResults of “Retrospective and Current Examination of the Lifecycle GHGEmissions of Corn-Based Ethanol” Report.This final project report is presented in the form in which ICF provided it toUSDA. Any views presented are those of the authors and are notnecessarily the views of or endorsed by USDA.For More InformationJan Lewandrowski, USDA Project Manager(JLewandrowski@oce.usda.gov)Bill Hohenstein, Director, USDA Energy and Environmental Policy(whohenstein@oce.usda.gov)Suggested CitationJ. Rosenfeld, J. Lewandrowski, T. Hendrickson, K. Jaglo, K. Moffroid, andD. Pape, 2018. A Life-Cycle Analysis of the Greenhouse Gas Emissions fromCorn-Based Ethanol. Report prepared by ICF under USDA Contract No.AG-3142-D-17-0161. September 5, 2018.Persons with DisabilitiesIndividuals who are deaf, hard of hearing, or have speech disabilities andyou wish to file either an EEO or program complaint please contact USDAthrough the Federal Relay Service at (800) 877‐8339 or (800) 845‐6136 (inSpanish).Persons with disabilities, who wish to file a program complaint, please seeinformation above on how to contact us by mail directly or by email. Ifyou require alternate means of communication for program information(e.g., Braille, large print, audiotape, etc.) please contact USDA’s TARGETCenter at (202) 720‐2600 (voice and TDD).
blankpage
A Life-Cycle Analysis of the Greenhouse Gas Emissions from Corn-Based EthanolCONTENTSINTRODUCTION . 1General ApproachOrganization of the Report47ASSESSING CURRENT LIFECYCLE GHG EMISSIONS FOR CORNETHANOL . 8Domestic Farm Inputs and Fertilizer N2O8Literature Review Findings . 9EPA RIA and Current Condition GHG Emissions Value . 14Domestic Land-Use Change20Literature Review Findings . 21EPA RIA and Current Condition GHG Emissions Value . 26Domestic Rice Methane30Literature Review Findings . 30EPA RIA and Current Condition GHG Emissions Value . 35Domestic Livestock36Literature Review Findings . 37EPA RIA and Current Condition GHG Emissions Value . 39International Livestock Emissions42Literature Review Findings . 42EPA RIA and Current Condition GHG Emissions Value . 43International Land-Use Change46Literature Review Findings . 46EPA RIA and Current Condition GHG Emissions Value . 55International Farm Inputs and Fertilizer N2O62Literature Review Findings . 62EPA RIA and Current Condition GHG Emissions Value . 66International Rice Methane69Literature Review Findings . 69EPA RIA and ICF Current Condition GHG Emissions Value . 70Fuel and Feedstock Transport73Literature Review Findings . 73EPA RIA and Current Condition GHG Emissions Value . 73Fuel Production77Literature Review Findings . 77EPA RIA and Current Condition GHG Emissions Value . 79Tailpipe83Literature Review Findings . 83EPA RIA and Current Condition GHG Emissions Value . 84Aggregating Source Category GHG Emissions into a Current GHGProfile for U.S. Corn Ethanol85PROJECTED GHG EMISSIONS SCENARIOS FOR CORN ETHANOL IN2022: BUSINESS-AS-USUAL (BAU) AND HIGH EFFICIENCY-HIGHCONSERVATION (HEHC) . 87Key Parameters and BAU and HEHC Scenarios87Domestic Farm Inputs and Fertilizer N2O88Methodology: 2022 BAU Scenario . 88CONTENTS i
A Life-Cycle Analysis of the Greenhouse Gas Emissions from Corn-Based EthanolMethodology: 2022 HEHC Scenario . 89Domestic Farm Inputs and Fertilizer N2O Results . 91Domestic Land-Use Change92Methodology. 92Domestic Land-Use Change Results . 93Fuel Production93Methodology. 93Fuel Production Results . 94Fuel and Feedstock Transportation95Methodology. 95Fuel and Feedstock Transportation Results . 96Summary of the 2022 BAU and 2022 HEHC Scenarios Results97Summary99REFERENCES . 100CONTENTS ii
A Life-Cycle Analysis of the Greenhouse Gas Emissions from Corn-Based EthanolFiguresFigure 1-1: Summary of Data Sources and Models Used in the Development of the Eleven Emission Sources.2Figure 1-2: Summary of LCA emission Factors Showing the Relative Contributions Across the 11 EmissionCategories .3Figure 2-1: Changes in Corn Production Practices from 2005 to 2010 .13Figure 2-2: U.S. Map of Average 2006–2010 Major and Minor Rice Crop Areas .31Figure 2-3: U.S. Map of Average 2006–2010 Major and Minor Corn Crop Areas .31Figure 2-4: Corn Only Scenario Compared to Control Scenario: Changes in Harvested Hectares by 2022 .50Figure 2-5: Comparison of International Land-use Change Emissions Related to Increases in U.S. CornEthanol Production - Various Sources .51Figure 2-6: Extensive and Intensive Land-use Changes: 2004–2006 to 2010–2012 from FAOSTAT .53Figure 2-7: Comparison of Brazilian Deforestation (sq. km) and U.S. Corn Ethanol Production (billion gallons)by Year.55Figure 2-8: Literature and ICF Values for International Land-Use Change Due to U.S. Corn Ethanol Demand.61Figure 2-9: GREET Process Maps for Fuel and Feedstock Transportation .75Figure 2-10: Fuel and Feedstock Transportation Emissions .76Figure 2-11: Ethanol Industry Corn Utilization and Average Yield, 1982–2014 .78Figure 2-12: Comparison of EPA-RIA and ICF Carbon Intensities .86Figure 3-1: Range of Emissions for the Domestic Farm Inputs and Fertilizer N2O Emission Category Based onAdoption of USDA Conservation Practice Standards .91Figure 3-2: Fuel and Feedstock Transportation Emissions by ICF Scenario .96Figure 3-3: Full Life-Cycle Corn Ethanol GHG Results for the Current Conditions, 2022 BAU, and 2022 HEHCScenarios .97CONTENTS iii
A Life-Cycle Analysis of the Greenhouse Gas Emissions from Corn-Based EthanolTablesTable 1-1: 2022 Fuel Volumes Modeled in FASOM (Billions of Gallons).5Table 1-2: Global Warming Potentials .6Table 2-1: N Application for Corn .11Table 2-2: Summary of Domestic Agricultural Inputs for Corn Ethanol, 2022 .15Table 2-3: Relative Change in N2O Emissions (DAYCENT/CENTURY).16Table 2-4: Emission Factors and Energy Use for Domestic Farm Inputs and Fertilizer N2O .16Table 2-5: Effective Chemical Application Rates (Pounds per Acre) .17Table 2-6: Calculated Changes in Corn Production in the Current Conditions Control Scenario (Acres) .18Table 2-7: N2O from Fertilizer, Fertilizer and Pesticides, and Fuel Use Emissions Impacts .19Table 2-8: Ethanol Production Market Breakdown and Animal Feed Displacement by Ethanol Plant Type .19Table 2-9: Ethanol Co-Product Credit by Ethanol Plant Type .20Table 2-10: U.S. Corn Crop Actual Performance.21Table 2-11: U.S. Ethanol Production and Ethanol Conversion 2007 to 2014 .22Table 2-12: Comparing U.S. Cropland Changes in Taheripour et al. (2011) and Taheripour and Tyner (2013)by AEZ and Land Type .23Table 2-13: RIA Projection of 2022 Total Cropland and Corn Acres by Case (millions of acres) .26Table 2-14: Soil Carbon Emission Factors for Conventional Till in Century/COLE.28Table 2-15: Soil Carbon Emission Factors for Reduced Till in Century/COLE .28Table 2-16: Final Scenario Results for 2013 GTAP Acreage Change Data .29Table 2-17: U.S. Planted and Harvested Rice (millions of acres) .32Table 2-18: Rice Methane Emission Factors from the Inventory of U.S. Greenhouse Gas Emissions and Sinks.33Table 2-19: Comparison of Inventory (2005–2013) and RFS2 RIA Effective Emission factors (kg CO2e/acre) .34Table 2-20: EPA RIA Domestic Rice Acreage for Corn Only Case and Control Case.35Table 2-21: Methane Emission Factors from Irrigated Rice Cultivation by Region (kg CO2e/acre) .35Table 2-22: Regional Acreage and GHG Emissions for Domestic Rice Methane .36Table 2-23: FASOM Changes in Domestic Livestock Herd in 2022 .39Table 2-24: Enteric CH4 Annual Emission Factors .39Table 2-25: Domestic Manure Management Annual Emission Factors.40Table 2-26: Differences in Livestock Populations .40Table 2-27: Livestock GHG Emissions Per Head (g CO2e/head) .41Table 2-28: Livestock GHG Emissions .41Table 2-29: Reduced Methane Emissions from DGS as Animal Feed by Ethanol Plant Type .42Table 2-30: 2022 International Livestock Changes Due to Corn Ethanol Production (thousands of head) .44Table 2-31: Enteric CH4 Emission Factors Used in the RFS2 RIA.44Table 2-32: Manure Management CH4 Emission Factors Used in the RFS2 RIA .45Table 2-33: Manure Management N2O Emission Factors Used in the RFS2 RIA .45CONTENTS iv
A Life-Cycle Analysis of the Greenhouse Gas Emissions from Corn-Based EthanolTable 2-34: FAPRI-CARD Projected Changes in Harvested Hectares in 2022 .47Table 2-35: Comparison of GTAP 2013 Change in Hectares and GTAP 2013 Adjusted with Data fromBabcock and Iqbal (2014) .53Table 2-36: International Land-Use Change GHG Emission Impacts by Region, 2022 (kg CO2e/MMBtu) .57Table 2-37: GTAP Land-Use Change Output Generated by Taheripour and Tyner (2013) .59Table 2-38: Comparison of International Crop Area Change Between RIA and Proposed Data MillionGallons of Additional Ethanol Demand .60Table 2-39: International Land-Use Change Results by Scenario, Emission Factor Data Set and AnnualizedEmission Value .61Table 2-40: Nitrogen Consumption by Region by Calendar Year as Provided by International Fertilizer IndustryAssociation (metric tons of N) .63Table 2-41: Consumption by Brazil by Calendar Year as Provided by International Fertilizer IndustryAssociation (metric ton of N) .65Table 2-42: Nitrogen Fertilizers Consumed (N Total Nutrients) in Brazil as Provided by Food and AgricultureOrganization of the United Nations (metric ton of N) .66Table 2-43: Changes in International Agricultural Inputs (Short Tons) .67Table 2-44: Relative Change in International Fertillizer N2O Emissions .67Table 2-45: International Agricultural Input Emissions by Chemical and Application (g CO2e/MMBtu) .69Table 2-46: IPCC (2006) Default Global Rice Methane Emission Factorsa .70Table 2-47: Global Harvested Rice Area and CH4 Emissions, 2005-2012.70Table 2-48: 2022 International Rice Acreage, Emission Factors, and Associated GHG Emissions with CornEthanol Expansion .72Table 2-49: Transportation Distance and Mode Assumptions for DGS (per ton) .74Table 2-50: Transportation Distance and Mode Assumptions for Corn Ethanol .74Table 2-51: Emission Factors Used for Fuel and Feedstock Transport .74Table 2-52: Mode and Distance Assumptions .76Table 2-53: GHG Intensity for Corn Ethanol Production Facilities .77Table 2-54: 2022 Energy Use at Ethanol Plants with CHP (Btu/gallon) .79Table 2-55: Upstream Emission Factors for Fuels and Electricity .81Table 2-56: Assumptions and Inputs for Fuel Production Modeling in GREET .82Table 2-57: Corn Ethanol Fuel Production Results (g CO2e/MMBtu).83Table 2-58: Emission Factors for Tailpipe Combustion .84Table 2-59: Ethanol Tailpipe Emissions .85Table 3-1: Key Parameters and Scenarios Considered.88Table 3-2: USDA Corn Crop Long-Term Projections .89Table 3-3: Domestic Farm Inputs and Fertilizer N2O Emissions Including Ethanol Co-Product Credit .91Table 3-4: ICF Analysis Results for Reduced and Conventional Till Practices .93Table 3-5: Fuel Production Emissions by Refinery Technology and Process Fuel .94Table 3-6: Emission Factor Variations for Fuel and Feedstock Transportation Pathways .95Table 3-7: Fuel and Feedstock Transportation Emissions for Current Conditions, 2022 BAU, and 2022 HEHCScenarios .96CONTENTS v
A Life-Cycle Analysis of the Greenhouse Gas Emissions from Corn-Based EthanolConversion Factors1 kilogram (kg)1000 grams (g)1 kilogram (kg)2.20462 pounds (lbs)1000 kilograms (kg)1 metric ton (MT)1 metric ton (MT)1.10231 short tons (ton)1,000,000 metric tons (MT)1 million metric ton (MMT)1 metric gigaton (GT)1,000 million metric tons (MMT)1 hectare (ha)2.47105 acres (ac)1 megajoule (MJ)947.817 British thermal units (Btu)1,000,000 British thermal units (Btu)1 million metric British thermal units (MMBtu)1 gallon of ethanol76,330.0 British thermal units (Btu) of energyaa.Basedon the lower heating value (LHV) of ethanol.CONTENTS vi
A Life-Cycle Analysis of the Greenhouse Gas Emissions from Corn-Based EthanolIntroductionBetween 2004 and 2014, U.S. ethanol production, virtually all from corn starch,increased from 3.4 to 14.3 billion gallons per year. This increase in production waslargely the result of two pieces of legislation that mandated the nation’s supplyof transportation fuel contain specified quantities of renewable fuels (i.e.,biofuels). Specifically, the Energy Policy Act of 2005 established the RenewableFuel Standard (RFS), which included a schedule of required biofuel use thatstarted at 4 billion gallons in 2006 and rose to 7.5 billion gallons by 2012. Two yearslater, the Energy Independence and Security Act of 2007 replaced the RFS withthe Revised Renewable Fuel Standard (RFS2). The RFS2 included a new scheduleof required biofuel use that began at 9 billion gallons in 2008 and ramped up to36 billion gallons in 2022 (including corn ethanol, biomass based diesel, cellulosicbiofuels and other renewable advanced biofuels). Corn ethanol’s mandatestarted at 9 billion gallons in 2008, gradually increased to 15 billion gallons in 2015,and is held constant at that level through 2022.A key objective of the RFS2 is to reduce greenhouse gas (GHG) emissionsassociated with transportation fuels. Except for ethanol from grandfatheredrefineries, a biofuel must have a life-cycle GHG profile at least 20 percent lowerthan the fossil fuel it replaces to qualify as a renewable fuel. Biofuels with a 50percent or higher reduction qualify as “advanced biofuels.” Over time, advancedbiofuels receive an increasing share of the annual renewable fuel mandate.Quantifying the GHG profile of corn ethanol has been contentious sinceSearchinger et al. (2008) and Fargione et al. (2008) concluded that the emissionsassociated with its production and combustion exceeded the emissionsassociated with production and combustion of an energy equivalent quantity ofgasoline. These authors argued that using billions of bushels of U.S. corn toproduce ethanol reduces supplies of, and increases prices for, corn and othercommodities in domestic and world food and feed markets. Farmers in theUnited States and elsewhere respond by bringing new land into production.These land-use changes (LUC) are related to ethanol production because thenew land is used to grow more corn and to replace some of the decreasedproduction of other commodities that occur when U.S. farmers allocate moreexisting cropland to corn. Bringing new land into commodity production typicallyresults in CO2 emissions and these emissions can be large if the former land usewas native grassland, wetland, or forest. Searchinger et al. (2008) and FargioneINTRODUCTION 1
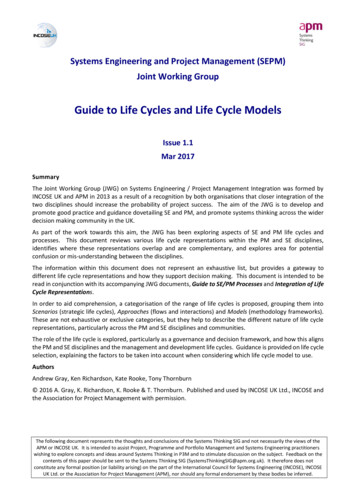
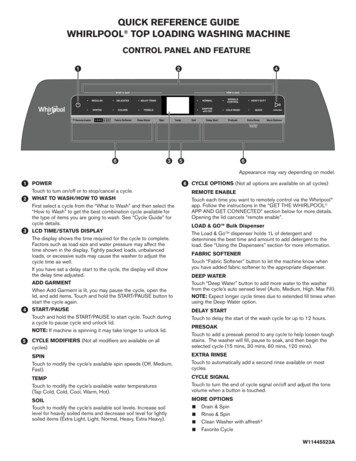
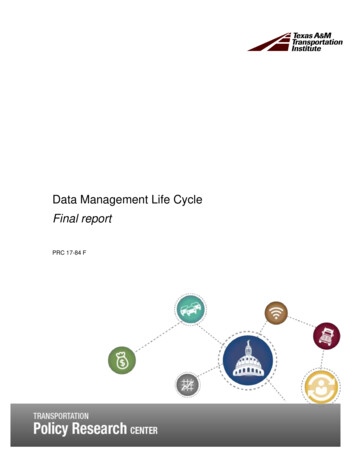
A Life-Cycle Analysis of the Greenhouse Gas Emissions from Corn-Based Ethanolet al. (2008) argued that counting emissions related to LUC, particularlyinternational LUC (iLUC), results in corn ethanol having a higher GHG profilethan gasoline.The RFS2 directed the U.S. Environmental Protection Agency (EPA) to do a fullGHG life-cycle analysis (LCA) for corn ethanol and to include both direct andsignificant indirect sources of emissions. EPA designated iLUC, internationallivestock, international rice methane, and international farm inputs as significantindirect sources. The LCA was released in the 2010 Regulatory Impact Analysis(RIA) of the RFS2 (EPA, 2010a). The EPA RIA developed projections through 2022of the GHG emissions associated with 11 specific emission categories that,conceptually, capture the full range of direct and indirect GHG emissionsassociated with corn-ethanol production and combustion (i.e., from corn field totailpipe). These emission categories include:1. Domestic farm inputs andfertilizer N2O2. Domestic land-use change3. Domestic rice methane4. Domestic livestock5. International land-use change6. International farm inputs andfertilizer N2O7. International rice methane8. International livestock9. Fuel and feedstock transport10. Fuel production11. TailpipeFigure 1-1 presents these emission categories and the data sources and modelsthat EPA used to estimate their GHG emissions.Figure 1-1: Summary of Data Sources and Models Used in the Development of theEleven Emission SourcesSource: EPA, 2010a (see Figure 2.2-1).INTRODUCTION 2
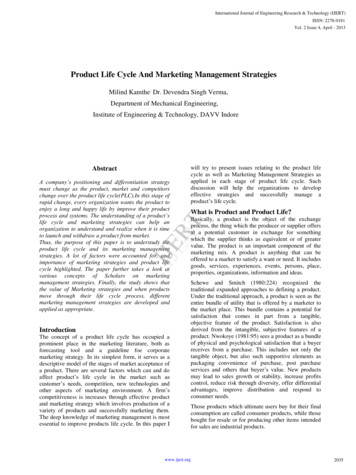
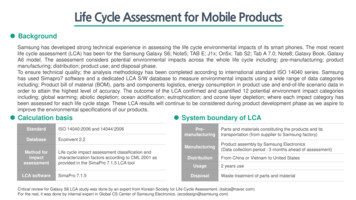
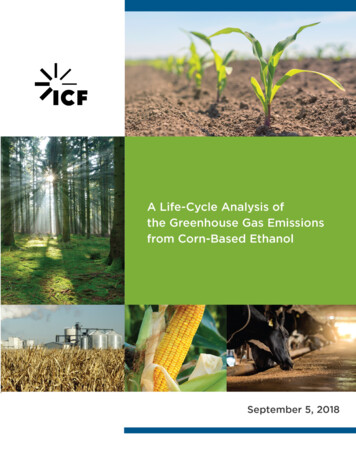
A Life-Cycle Analysis of the Greenhouse Gas Emissions from Corn-Based EthanolEPA evaluated the emissions and energy use associated with each emissioncategory and the upstream components. EPA concluded that in 2022, the GHGemissions associated with production of a unit of corn-based ethanol from a newnatural gas powered refinery would be about 21 percent lower than theemissions from an energy equivalent quantity of an “average” gasoline in 2005. 1Figure 1-2 shows the EPA RIA emissions profiles for corn ethanol and the averagegallon of gasoline.Figure 1-2: Summary of LCA emission Factors Showing the Relative ContributionsAcross the 11 Emission Categories120,000Fuel Production60,000International Land UseChangeInternational Farm Inputsand Fertilizer N2OFuel and FeedstockTransportDomestic Land UseChangeInternational Livestock40,000International RiceMethaneTailpipe100,00080,000-21%Domestic Rice Methane20,000-Domestic Farm Inputs andFertilizer N2ODomestic Livestock-Net Emissions(20,000)20% Reduction Threshold2005 Gasoline Baseline2022 Ave Dry Mill NGSource: EPA, 2010a (See Figure 2.6-2 entitled Results for a New Natural Gas Fired Corn Ethanol Plant by Lifestyle Stage (Average 2022plant: natural gas, 63% dry, 37% wet DGS (with fractionation)).Figure 1-2 shows that for corn ethanol—refined in a dry mill plant using naturalgas as its process fuel —the largest sources of emissions are international landuse change, fuel production, and domestic farm inputs and fertilizer N2O. Withinthe iLUC category, the largest source of emissions is projected land-use changein Brazil, particularly in Brazil’s Amazon region (EPA, 2010a). Assessing the actual1The “average” gasoline was constructed as a weighted blend of different gasolines that were consumed in the United Statesin 2005.INTRODUCTION 3
A Life-Cycle Analysis of the Greenhouse Gas Emissions from Corn-Based Ethanolcontribution of iLUC to the GHG emissions profile of corn ethanol is an importantfocus of our analysis.In 2010, the EPA RIA was the most comprehensive modeling framework yetdeveloped for projecting how the GHG profile of corn-based ethanol mightchange in response to anticipated changes in market conditions and/orrenewable energy policies. Much of the EPA RIA analysis still reflects our bestunderstanding of the relationships between some emission categories, the keyemissions drivers within them, and corn ethanol’s GHG profile. At the same time,a large body of new information has become available since 2010—includingnew data, scientific studies, industry trends, technical reports, and updatedemissions coefficients. Collectively, the new information indicates that for manyof the emission categories in the EPA RIA, the actual emissions pathways thathave developed since 2010 differ, sometimes significantly, from those projectedin the RIA. The primary purpose of this report is to consider the complete set ofinformation now available related to the life-cycle emissions for corn-basedethanol and based on this information, assess its current GHG emissions profile.This report also develops two projected emission profiles for corn ethanol in 2022(the last year of the RFS2). Starting with our current emission profile, the firstprojection, labeled the business-as-usual (BAU) scenario, assumes that recenttrends observed in corn inputs, per-acre corn yields, refinery technologies,vehicle fleets, and other factors continue through 2022. The continuation ofthese trends has implications for the path that GHG emissions attributable to cornethanol production will follow over the next few years even if refineries take noactions to actively reduce emissions. The second projection, labeled the HighEfficiency-High Conservation (HEHC) scenario, adds to the BAU scenario theassumption that refineries adopt a set of currently available technologies andpractices that are known to reduce emissions in corn production, ethanolrefining, transportation, and co-product management. The HEHC scenario canbe viewed as a case where refineries take a more aggressive approach toreducing emissions.General ApproachSince 2010, EPA’s estimated GHG mitigation value for corn ethanol (i.e., 21percent lower emissions than an energy equivalent quantity of gasoline) hasdominated academic, industry, and policy discussions of GHG issues related torenewable transportation fuels, as well as the design of federal renewable fuelspolicy (specifically, the RFS2). For these reasons, the structure for the LCAdeveloped for this report is designed so that comparisons of its results with thosein the RIA are relatively straightforward. For example, to match boundaryconditions and emissions coverage, this study employs the same 11 emissioncategories that make up the EPA RIA. Due to the RIA’s comprehensive coverageof GHG emissions, both in aggregate and within each category, it is generallystraightforward to assess where new information indicates that current emissionsINTRODUCTION 4
A Life-Cycle Analysis of the Greenhouse Gas Emissions from Corn-Based Ethanoldiffer from the paths projected in 2010, as well as what the magnitudes anddirections of the differences are.Another structural similarity that facilitates comparisons between the LCAdeveloped here and that in the RIA is a focu
A Life-Cycle Analysis of the Greenhouse Gas Emissions from Corn-Based Ethanol ; September 5, 2018 ; Prepared for ; U.S. Department of Agriculture ; Office of Energy and Environmental Policy ; . Table 2-41: Consumption by Brazil by Calendar Year as Provided by International Fertilizer Industry